

 PDF
PDF ePub
ePub Citation
 Print
Print


INTRODUCTION
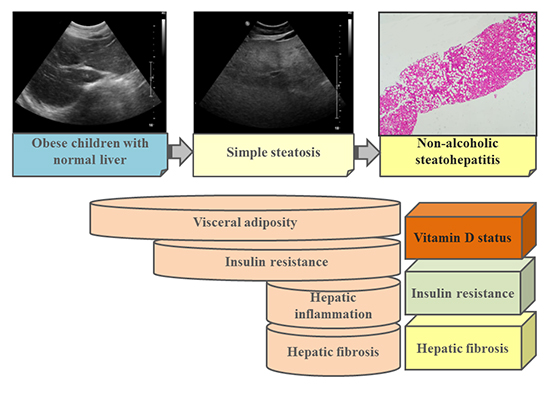
Nonalcoholic fatty liver disease (NAFLD) encompasses a wide spectrum of liver disease ranging from simple steatosis to nonalcoholic steatohepatitis (NASH), with varying degrees of inflammation and fibrosis leading to cirrhosis and liver cancer (12). In the last decade, the prevalence of pediatric NAFLD has markedly increased worldwide in parallel with the obesity epidemic. NAFLD has become the most common cause of chronic liver disease in children, affecting up to one-third of obese children (34).
Vitamin D insufficiency and deficiency are also a worldwide concern (5). The role of vitamin D in calcium homeostasis and bone metabolism is widely known (678910), and previous studies have shown that low 25-hydroxyvitamin D (25[OH]D) levels are associated with lower bone mineral density (BMD) in children and adolescents (71112). In contrast, relations between vitamin D status and BMD in childhood obesity are controversial. Vitamin D insufficiency or deficiency may be more prevalent in obese children and adolescents than nonobese controls in association with adiposity or insulin sensitivity (1314), whereas increased bone mass and BMD have also been reported in obese children and adolescents, occurring by mechanisms that are not yet understood (14).
Furthermore, because of few studies and limited data the significance of BMD and vitamin D status related to NAFLD in obese children and adolescents is more controversial (131415). The first study from Turkey reported that obese children with abnormal liver ultrasonographic findings suggestive of hepatic steatosis had lower spine BMD z-scores than obese children with normal liver ultrasonographic findings (13). Another study on the relationship between vitamin D and hepatic steatosis suggesting NAFLD reported that serum 25(OH)D levels decreased as the ultrasonographic severity of steatosis increased, independent of adiposity and insulin resistance (16). However, these studies focused primarily on the presence or absence of NAFLD, and did not consider the degree of inflammation and hepatic fibrosis (indicative of NASH), or the association of BMD and vitamin D status in obese children with NAFLD. For this reason, the association of serum 25(OH)D levels and BMD with the degree of inflammation and fibrosis shown in NAFLD, especially NASH, has not been reported yet in obese children and adolescents.
Therefore, this study aimed to evaluate vitamin D status and BMD in obese children according to their condition within the NAFLD spectrum, and to evaluate factors that affect vitamin D and BMD status in obese children and adolescents with NAFLD, such as insulin resistance and body composition, particularly in those patients with NASH.
MATERIALS AND METHODS
Subjects
A total of 94 obese children and adolescents who visited the Seoul National University Bundang Hospital between April 2012 and April 2014 were included in the study. The subjects were divided into three groups according to their condition within the NAFLD spectrum: normal liver (controls, n=32), simple steatosis (n=15), and NASH (n=47).
Subjects were excluded if they had underlying liver disease including hepatitis B, hepatitis C, alpha-1 antitrypsin deficiency, autoimmune hepatitis, Wilson disease, drug toxicity, and total parenteral nutrition within the prior 3 months (17). Children with factors that could have adversely influenced BMD, such as a fracture within the past year, history of orthopedic surgery or chronic glucocorticoid use, were also excluded. None of the patients had a history of alcohol consumption.
Anthropometric data
Anthropometric measurements were performed for all patients. Body weight was determined to the nearest 0.1 kg using a calibrated digital scale, and height was measured to the nearest 0.1 cm on a standard height board. Body mass index (BMI) was calculated as weight (kg) divided by height (m2) squared. BMI z-score was calculated using the least mean square method adjusted for age and sex according to the 2007 Korean National Growth Charts (19). Obesity was defined as ≥95th percentile for BMI adjusted for age and sex.
Laboratory tests
Serum concentrations of triglycerides (TG), total cholesterol, high-density lipoprotein (HDL) cholesterol, low-density lipoprotein (LDL) cholesterol, γ-glutamyl transpeptidase (γGT), fasting glucose, and insulin levels were obtained by venipuncture at the first visit after an overnight fast of at least 12 hr. The homeostasis model assessment of insulin resistance (HOMA-IR) was calculated as (fasting insulin [µU/mL]×fasting glucose [mg/dL])/405.
Serum levels of aspartate aminotransferase (AST) and alanine aminotransferase (ALT) were measured using the TBA-200FR NEO (Toshiba Medical Systems Corporation, Tokyo, Japan), and AST or ALT serum levels exceeding 40 IU/L were considered abnormal. Serum levels of highly sensitive C-reactive protein (hsCRP) were also measured.
Serum 25(OH)D level was measured using an ultra-performance liquid chromatography tandem mass spectrometry (UPLC-MS/MS) (Waters, Milford, MA, USA).
Dual-energy X-ray absorptiometry (DXA)
BMDs and age-matched BMD z scores were measured using whole body DXA scanning (Lunar, General Electric Medical systems, Madison, WI, USA). DXA quantifies body composition by measuring tissue absorption of photons emitted at two energy levels, categorizing body weight into bone mineral mass, lean body mass, and fat mass using software provided by the manufacturer. Patients underwent DXA scanning for 15 min in a supine position without any movement in accordance with the manufacturer's recommendations.
The amount of total mass, fat mass, fat free mass, body fat percentage (fat mass/total mass×100), trunk fat percentage, and extremity fat percentage were measured simultaneously using a whole body DXA scanner.
Diagnosis of NAFLD and radiological evaluation of fatty liver
An expert pediatric radiologist performed abdominal ultrasonography (USG). The diagnosis of NAFLD was made utilizing serum liver enzyme levels and abdominal USG findings in obese children and adolescents, and NASH was defined as abnormally elevated serum aminotransferase levels with fatty liver on abdominal USG. All patients with elevated levels of transaminases and abnormal USG findings were screened for other causes of liver diseases, and all were negative.
Statistical analysis
Data were expressed as median (range). All results were analyzed using the SPSS 18.0 software program (SPSS Inc., Chicago, IL, USA). Nonparametric analysis was performed using the Kruskall-Wallis method. Spearman correlation was used to analyze the correlation between two variables. Multiple regression analysis was employed to evaluate factors related to serum vitamin D levels or age-matched BMD in obese children with NASH. A P value less than 0.05 defined statistical significance.
RESULTS
Patient characteristics
A total of 94 obese children and adolescents (66 boys, 28 girls; 6.6-19.3 yr of age; mean±SD=11.3±2.9 yr) were included and were divided into three groups according to their condition within the NAFLD spectrum: a control group of patients with normal liver (n=32), those with simple steatosis (n=15), and those with NASH (n=47).
Clinical and laboratory factors and vitamin D status according to the condition within the NAFLD spectrum
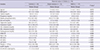
Table 1 lists the clinical, anthropometric, and laboratory features of the patients. The factors related to NAFLD that were statistically significant among the three groups included age, BMI, uric acid level, HDL-cholesterol level, HOMA-IR, AST, ALT, γGT level and hsCRP (Table 1). There were no differences among the three groups in the levels of serum 25(OH)D (Table 1).
Hepatic fibrosis, BMD, and body fat according to the condition within the NAFLD spectrum
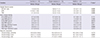
Table 2 compares hepatic fibrosis scores, BMD, and body fat percentage of each NAFLD group. There were significant differences in hepatic fibrosis scores such as aspartate aminotransferase to platelet ratio index (APRI) and FIB4 (Table 2). There were significant differences in BMDs in the area of trunk, whereas no significant difference was noted in age-matched BMD z-scores (Table 2). In addition, trunk fat percentage, but not total body fat percentage or extremity fat percentage, was significantly different among the three groups of NAFLD (P=0.025).
Factors affecting vitamin D levels in each NAFLD spectrum group
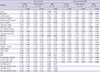
Serum 25(OH)D levels were negatively correlated with age and serum uric acid levels in obese children with NASH (r=-0.368, P=0.023 for age; r=-0.371, P=0.022 for uric acid) (Table 3). Serum 25(OH)D levels were also negatively correlated with HOMA-IR in the NASH group (r=-0.530, P=0.001). Serum 25(OH)D levels were not correlated to AST or ALT levels, but negatively correlated with FIB4 out of the hepatic fibrosis scores in the NASH group (r=-0.406, P=0.011).
Serum 25(OH)D levels were negatively associated with total BMD and total body less head (TBLH) BMD measured by DXA, which were not significantly related to age-matched BMD z-scores and age-matched TBLH BMD z-scores (Table 3).
In addition, serum 25(OH)D levels did not significantly correlate with body fat percentage, extremity fat percentage, or trunk fat percentage in any of the NAFLD groups (Table 3).
Factors affecting BMD in each NAFLD spectrum group
Age-matched BMD z-score correlated significantly with BMI in obese children with NASH (r=0.496, P=0.001), and was negatively correlated with serum cholesterol level in the NASH group (r=-0.309, P=0.047), but not in the controls or the simple steatosis group (Table 3).
In obese children, total age-matched BMD z-score was significantly associated with total body fat percentage (P=0.020), extremity fat percentage, and trunk fat percentage (P=0.028 & P=0.038, respectively) in the NASH group, but not in the controls or the simple steatosis group (Table 3).
Multiple regression analysis of factors affecting vitamin D status and BMD in obese children with NASH
Multiple regression analysis was performed for serum 25(OH)D levels in the NASH group using variables including age, uric acid, HOMA-IR, FIB4, trunk fat percentage by adding total age-adjusted BMD z-score. Analysis revealed that age (P=0.019) and HOMA-IR (P=0.024) were significant factors in obese children with NASH (Table 4).
In addition, multiple regression analysis for age-adjusted BMD z-score was performed with the NASH group to determine the significance of variables such as BMI, serum total cholesterol levels, and trunk fat percentage by adding 25(OH)D levels, showing that BMI (P=0.001) and cholesterol (P=0.030) were statistically significant factors (Table 4).
DISCUSSION
In the present study, serum 25(OH)D levels and age-matched BMD were not significantly different among the three groups of NAFLD. Instead, there were significant differences in the levels of systemic inflammatory marker such as hsCRP, hepatic fibrosis score such as FIB4, insulin resistance such as HOMA-IR, and trunk fat percentage according to the NAFLD spectrum. However, serum 25(OH)D levels were related to HOMA-IR in the NASH group regardless of age-matched BMD or trunk fat percentage, whereas age-matched BMD was not in the NASH group.
According to a previous study in 2009 that examined the relationship between childhood obesity and serum vitamin D status, it was reported that obese adolescents with 25(OH)D deficiency but without elevated serum parathyroid hormone levels had a bone mass within 2 standard deviations of national standards, but a higher fat mass percentage on DXA, providing the initial evidence that composition and distribution of body fat in obese patients may be associated with vitamin D status, regardless of their bone mineral status (18). Another study that investigated the relationship of vitamin D deficiency with puberty and insulin resistance in obese children and adolescents showed a statistically significant rate of 25(OH)D deficiency in the pubertal group compared with that in the prepubertal group, and that those subjects with 25(OH)D deficiency had greater insulin resistance (19). Moreover, according to a report examining the relationship between 25(OH)D level and the markers of abnormal glucose metabolism and blood pressure, 25(OH)D negatively correlated with HOMA-IR and 2-hr glucose, after adjustment for BMI and age (20). This study concluded that lower 25(OH)D levels might be associated with risk factors for type 2 diabetes in obese children (20). While these cross-sectional and prospective studies have suggested vitamin D deficiency may play a role in worsening insulin resistance, a recent study identified obesity as a strong predisposing factor for both vitamin D deficiency and insulin resistance, and the association between vitamin D and obesity- or insulin resistance-related complications were suggested in obese patients, requiring further research (21).
NAFLD is a well-known complication of obesity, caused by the accumulation of fat in the liver, resulting in oxidative damage of hepatocytes, inflammation, and fibrosis, which is related to insulin resistance and other causative factors (14). According to a recent cohort study, serum 25(OH)D concentrations were found to significantly decrease as the sonographic severity of hepatic steatosis increased, unrelated to adiposity or insulin resistance (16). However, this study had some limitations as it did not evaluate BMD in relation to vitamin D status in children with NAFLD and it did not consider NASH, which can progress to cirrhosis. In our study, when vitamin D status was evaluated according to the condition within the NAFLD spectrum, there were no differences in the levels of 25(OH)D among them. However, interestingly, when serum vitamin D status was evaluated according to biochemical parameters, bone density, and body composition factors, serum 25(OH)D levels were negatively correlated with age, uric acid levels, HOMA-IR, and FIB4 in obese children with NASH, whereas there were no correlations in those with simple steatosis or normal liver. Additionally, multiple regression analysis in our study did reveal that age and insulin resistance were significant in relation to vitamin D status in obese children with NASH.
In our study, hsCRP (a marker of systemic inflammation), HOMA-IR (a marker of insulin resistance), APRI, and FIB4 (both indirect markers of hepatic fibrosis) are significantly different among our three groups of NAFLD, independent of serum vitamin D status and bone mineral status. However, after adjusting for age and sex, there are no statistically significant differences in BMD among the three NAFLD groups. Furthermore, BMI and cholesterol, but not vitamin D or body fat distribution, are significant factors regarding age-matched BMD in obese children with NASH by multiple regression analysis. In this study population of obese children and adolescents, all BMDs were measured using DXA scanning, as in several previous studies (151617). One of these studies revealed that hsCRP, a low grade systemic inflammatory marker, was associated with BMD (17), and the others showed that the presence of NAFLD was associated with lower BMD and insulin resistance (1516). However, none of these studies measured levels of vitamin D, as in our study, despite evaluating bone mineral status and insulin resistance related to NAFLD (151617).
One limitation of this study is that it was performed in a single center with a small number of patients; therefore, we could not show statistically significant results in some aspects. Another limitation is the use of liver USG to diagnose NAFLD, rather than the gold standard of liver biopsy. Liver USG may be less sensitive in detecting a low degree of hepatic steatosis. However, liver USG is useful in large population based studies because it is noninvasive and provides an estimate of histological hepatic steatosis in both children and adults.
To the best of our knowledge this is the first prospective, observational study to evaluate serum vitamin D status, BMD, and body composition as well as demographic, anthropometric, and biochemical profiles of pediatric patients with obesity and NAFLD (in particular, NASH). In the present study, we evaluated vitamin D status, BMD, and body composition in association with obesity- and obesity-related complication factors among obese children and adolescents according to the NAFLD spectrum. Although there are no differences in the levels of vitamin D or age-matched BMD among the three groups of NAFLD, the levels of systemic inflammatory markers, hepatic fibrosis scores, insulin resistance, trunk fat, and insulin resistance are significantly different according to the NAFLD spectrum.
Therefore, hsCRP, HOMA-IR, and fibrosis scores such as APRI and FIB4 may increase in children of NAFLD compared to healthy children. Especially, fibrosis score may be an indirect marker which reflects the degree of the severity of NAFLD. Additionally, in obese children with NASH, serum vitamin D levels can increase insulin resistance and hepatic fibrosis, irrespective of bone mineral density or body fat composition. These suggest the preventive role of vitamin D in obese children with NASH. Based on these results, early evaluation to detect NASH as obesity-related complication should be considered when serum vitamin D level is persistently low in obese children. Further research with a large number of obese children and adolescents is warranted.

 XML Download