Journal List > J Korean Med Sci > v.30(10) > 1022762

Park, Suh, Lee, Ahn, Park, Choe, and Hong: Dosimetric Effects of Magnetic Resonance Imaging-assisted Radiotherapy Planning: Dose Optimization for Target Volumes at High Risk and Analytic Radiobiological Dose Evaluation

Abstract

Based on the assumption that apparent diffusion coefficients (ADCs) define high-risk clinical target volume (aCTVHR) in high-grade glioma in a cellularity-dependent manner, the dosimetric effects of aCTVHR-targeted dose optimization were evaluated in two intensity-modulated radiation therapy (IMRT) plans. Diffusion-weighted magnetic resonance (MR) images and ADC maps were analyzed qualitatively and quantitatively to determine aCTVHR in a high-grade glioma with high cellularity. After confirming tumor malignancy using the average and minimum ADCs and ADC ratios, the aCTVHR with double- or triple-restricted water diffusion was defined on computed tomography images through image registration. Doses to the aCTVHR and CTV defined on T1-weighted MR images were optimized using a simultaneous integrated boost technique. The dosimetric benefits for CTVs and organs at risk (OARs) were compared using dose volume histograms and various biophysical indices in an ADC map-based IMRT (IMRTADC) plan and a conventional IMRT (IMRTconv) plan. The IMRTADC plan improved dose conformity up to 15 times, compared to the IMRTconv plan. It reduced the equivalent uniform doses in the visual system and brain stem by more than 10% and 16%, respectively. The ADC-based target differentiation and dose optimization may facilitate conformal dose distribution to the aCTVHR and OAR sparing in an IMRT plan.

Graphical Abstract

jkms-30-1522-ab001

INTRODUCTION

Conventional magnetic resonance (MR) imaging [e.g., contrast-enhanced T1-weighted (CE-T1) imaging with gadolinium and fluid attenuated inversion recovery imaging)] has been recommended for reliable delineation of intracranial tumors (12). However, because high-grade gliomas often diffusely infiltrate surrounding normal brain tissues, morphology-based target delineation using conventional MR imaging and computed tomography (CT) can miss lesions that should be included in the treatment volumes (345). Enlarging clinical target volumes (CTVs) to encompass suspicious regions which are not visible on CT and CE-T1 images of high-grade gliomas can hinder dose optimization for local high-risk regions. Moreover, image-based target definition including the tumor bed is even more critical for residual tumors after incomplete surgical resection to ensure coverage of the neoplastic regions and prevent recurrence (6). Thus, various attempts have been made to improve the radiation treatment outcome of high-grade gliomas by integrating multi-modal imaging, beam intensity-modulated techniques, and other adjuvant therapies (78910).
However, high-grade gliomas showed poor survival rates and frequent recurrence, even within the pre-irradiated gross tumor volume (GTV) receiving higher doses than marginal tumors (10). It CTV delineation considering physiological and histopathological characteristics of the tumor and dose optimization to high-risk regions that may be positively applied to create more effective treatment plans (11).
One of the characteristics for high-grade gliomas is increase of cellularity during tumor progression (12). Apparent diffusion coefficient (ADC) maps reconstructed from diffusion-weighted (DW) MR images can describe histopathological information about cellularity in high-grade gliomas (2), by providing a quantitative index of restricted water diffusion in intracellular spaces relative to extracellular spaces (13). Enhanced regions of malignant gliomas with compact cellularity on ADC maps (aCTVHR) can be used to define high-risk CTV (141516) and doses were optimized to the aCTVHR.
In this study, we defined aCTVHR on the ADC maps by making reference to the reported quantitative ADC criteria which indicates malignancy level of high-grade gliomas. The benefits of aCTVHR-targeted dose optimization were assessed in dose distributions of an intensity-modulated radiation therapy (IMRT) plan based on ADC values (IMRTADC) as compared with a conventional IMRT (IMRTconv) plan.

MATERIALS AND METHODS

Image acquisition

A patient was diagnosed with a high-grade glioma (grade III) in the right anterior temporal lobe and basal ganglia of the brain. After surgical resection of the tumor, ADC images of the cavity showed a suspicious malignant lesion; therefore, adjuvant radiation therapy was performed according to the National Comprehensive Cancer Network practice guidelines (17). To determine residual tumor volumes, we examined perfusion-weighted, MR spectroscopy, and DW images along with conventional MR and CT images.
MR imaging and CT were performed using a 1.5-Tesla MR unit (GE SIGNA system, GE Medical Systems, Milwaukee, WI, USA) and a GE 9800 Quick System CT scanner (GE Medical Systems), respectively. CE-T1 imaging used gadolinium as the contrast agent and a spin echo T1-weighted sequence with a time to echo (TE) value of 500 ms and a repetition time (TR) of 13 ms. The ADC maps were constructed from DW images that were scanned over 3 orthogonal diffusion gradients with 2 different gradient factors (b=0, 1,000 s/mm2) using a TE of 75 ms and a TR of 8,000 ms. To obtain reliable signal-to-ratio and consider clinically practical application of ADC maps, commonly applied b-value of 1,000 s/mm2 was used (18).

Incorporation of ADCs into the radiation treatment plan

ADC values were used to verify the severity of the residual malignant lesion and to differentiate the aCTVHR from the tumor bed. Average, maximum, and minimum ADC values and ADC ratios (rADCs) were calculated using MATLAB (version 7.10.0.499, MathWorks, Natick, MA, USA). To reduce variability in the selection of the boundaries of tumor regions, ADC values were evaluated in the compact rectangular volumes of interest (VOIs) covering all apices of the suspected regions closely surrounding hypo-intense voxels on ADC maps. Then, volumetric averaged ADC values were evaluated within the expanded VOIs (VOIs with at least a 2-cm margin on each side). Because high-grade gliomas often contain cystic or necrotic regions, we averaged the ADC values from 3-5 regions of interest (ROIs, 2-3 mm2 each) in the expanded VOIs. The rADC is obtained from the ADC of the aCTVHR divided by the ADC of the volume in contralateral normal brain tissues.
The aCTVHR showing a lower ADC value than the averaged ADC value was extracted via computational analysis and image processing of ADC maps. The extracted aCTVHR was re-marked on the ADC maps (pixel intensity equal to the maximum pixel intensity of the original ADC map). The ADC values were also confirmed by comparing with those reported for high-grade gliomas in diagnostic studies.
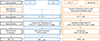
Because quantitative analysis of ADC maps and extraction of aCTVHR by applying the ADC criteria were not possible in commercial planning system (Eclipse, version 7.3.1, Varian Medical Systems, Palo Alto, CA, USA), two kinds of CT images were imported into Eclipse: the original CT images and another CT images including the aCTVHR and the CE-T1 image-based CTV (tCTV). To obtain the contours of the aCTVHR and tCTV on CT images using more reliable image registration functions, two sets of images (ADC map vs. CE-T1, CE-T1 vs. CT) were registered using BrainSCAN (version 5.31, BrainLab, Munich, Heimstetten, Germany). The overall procedure used to incorporate the determined aCTVHR into radiation treatment plans is shown in Fig. 1.
We also referred to the converted DW ratio to confirm volumes with low diffusion levels on DW-MR images. The DW-ratio maps were obtained by normalizing the original DW images to the average diffusion intensity of corresponding contralateral normal brain tissues.

Treatment plans

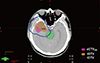
To evaluate dose distribution in the IMRTADC plan, the following tumor volumes were contoured on each CT image: CE-T1-based GTV (tGTV), ADC-based CTV (aCTVHR), and relative complement volume of aCTVHR in tCTV (sCTV) (Fig. 2).The tCTV is tGTV plus a 2.0-cm margin (1.5 cm for microscopic spread and 0.5 cm for set-up uncertainty). The CTV margin adjacent to critical structures, such as the right optic nerve, optic chiasm, and pituitary gland, was compromised to spare organs at risk (OARs).
The IMRTADC plan was optimized to deliver 60 Gy to the aCTVHR via the simultaneous integrated boost (SIB) technique (21719). Because the ADC maps indicated the differentiated 
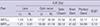
aCTVHR from the residual tumor, the tumor bed needed to receive the required dose of 50 Gy (16). However, because the IMRTconv plan was based only on conventional CE-T1 images, which showed the tumor bed but not CTVHR at the specific position, the tCTV received 60 Gy. The other plan parameters were equally applied to both plans, and they are summarized in Table 1. To provide a conformal dose to CTVs, 5 coplanar fields with different gantry angles (70°, 130°, 250°, 270°, and 310°) and 2 non-coplanar fields (60°/60° and 300°/300° for gantry/couch angles, respectively) were used.

Evaluation of dose distributions

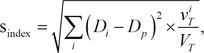
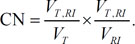
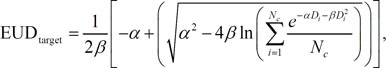
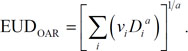
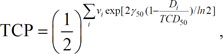
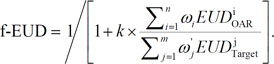
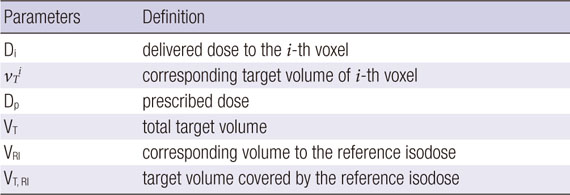
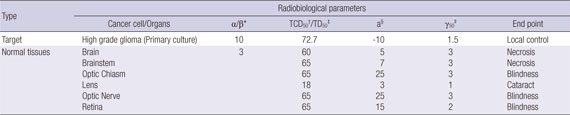
Dose distributions in the two plans were evaluated using biophysical indices for plan comparison and dose volume histograms (DVHs) for the aCTVHR and the tCTV. The homogeneity and conformity of dose distributions in the CTV were analyzed using the statistically modified homogeneity index (s-index) and the conformity number (CN), respectively (2021). The s-index and CN were evaluated using the prescribed doses (59.4 Gy for the aCTVHR and 50.4 Gy for the tCTV). Dosimetric effects were evaluated on the basis of the equivalent uniform dose (EUD) of the two plans according to a linear quadratic model for the tumor (2223) and a power law for the OARs (24). Tumor control probability (TCP) based on Poisson statistics was compared for the aCTVHR in both plans (25). In addition, the EUD-based figure-of-merit (f-EUD) was calculated for comprehensive plan evaluation using the EUD value of each primary structure (24). The weighting factors and the relative importance in f-EUD were assumed to be 1 in this study. Formulas and radiobiological parameters to evaluate dose distributions and calculate biophysical values are summarized in Appendix A and B (262728).

Ethics statement

This study protocol was approved by the institutional review board (IRB) of Konkuk University Medical Center (IRB No. KUH 1280065). Informed consent was waived by the board.

RESULTS

Clinical target volumes in multimodal images and apparent diffusion coefficients

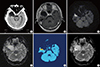
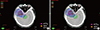
Conventional CT images did not clearly distinguish between the high-risk CTV and normal brain tissues (Fig. 3A). The resection cavity was enhanced by the contrast medium in the CE-T1 images (Fig. 3B), but the histopathological characteristics of the high-risk CTV were not apparent. In contrast, the DW images and ADC maps could reveal residual high-risk CTV as enhanced and suppressed regions, respectively (Fig. 3C, D). In the converted color map of the DW image, the diffusion values for the high-risk CTV were more than two-fold higher than those for normal brain tissues. Higher intensity regions appear red or orange in Fig. 3E.
The average ADC of the high-risk CTV was (0.73±0.23)×10-3 mm2/s, and the average rADC was (0.67±0.32)×10-3 mm2/s; both were less than 1×10⁻³ mm2/s. The minimum ADC of the high-risk CTV was 0.37×10⁻³ mm2/s, which is lower than the ADCs reported in medical diagnostic studies of high-grade gliomas [(0.86±0.12)×10-3 mm2/s and (0.82±0.13)×10-3 mm2/s for average ADC and rADC, respectively] (1529). The volumes with values lower than the average ADCs were defined as aCTVHR (Fig. 3F).

Plan evaluation

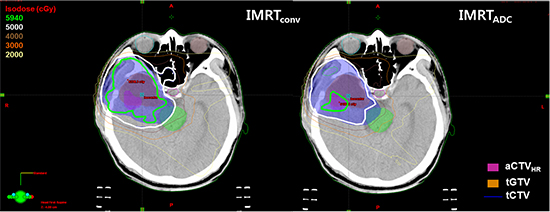
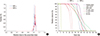
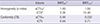
Dose distributions in two IMRT plans were evaluated using DVHs and various dosimetric metrics. The IMRTADC plan, which focused on dose optimization for the aCTVHR, produced a well-confined conformal dose distribution around the aCTVHR within the prescribed 60-Gy isodose surface (fluorescent green in Fig. 4A). Because dose conformity is mainly affected by the size of the total volume which received dose more than prescribed value (VRI) (area surrounded by fluorescent green line in Fig. 4B), the aCTVHR-targeted dose distribution resulted in less irradiation of the VRI. The IMRTADC plan improved the dose conformity of the aCTVHR up to 15 times, compared to the IMRTconv plan (Table 2). In addition, the IMRTADC plan showed superior dose uniformity of the aCTVHR by 7%, as indicated by a lower s-index in this plan compared with that of the IMRTconv plan.
Although the IMRTADC plan slightly increased the EUD (61.42 Gy vs. 60.00 Gy in the IMRTADC and IMRTconv plans, respectively) and the TCP (26.67 % vs. 24.01%, respectively), the differential DVHs of the aCTVHR were comparable in both plans (Fig. 5A). The DVHs showed greater dose sparing of OARs in the IMRTADC plan (Fig. 5B), owing to differences in dose optimization with and without focusing on the aCTVHR. The tailored dose delivery in the IMRTADC plan reduced EUDs by up to 16% in the brain stem and right lens (Table 3) and by more than 10% in the right optic nerve, optic chiasm, and left lens. Lower EUDs in these OARs could lead to an increase in f-EUDs in the IMRTADC plan.

DISCUSSION

Combining DW images and ADC maps with conventional CT and CE-T1 images can bring advantages in cancer diagnosis and therapy. In some cases, especially those involving high-grade gliomas with a rim that is not enhanced by contrast agents on CE-T1 images, DW images and ADC maps can help delineate CTVs by detecting pathologically relevant tumor characteristics not seen on conventional morphological images (5). As the large CTV is located close to critical organs, determination of image-based anisotropic target margin becomes more important for reducing toxicity in normal tissues. When we adopt DW images into radiotherapy plans for such as determination of target margins and high-risk CTV mentioned above, more rigorous image analysis and multimodality image-based confirmation of target volumes can support reliable application of advanced functional MR images.
Moreover, because DW images can show physiological and pathological variations of tumor to evaluate treatment responses through rapid and noninvasive scanning (30), those can be considered as an appropriate and powerful tool for adaptive radiation treatment plans. Patients can be monitored without additional radiation exposure during fractionated radiation treatment.
As application of extra-cranial DW images for patients with breast, prostate, and liver cancers (31) and the advent of a MRI-linac hybrid machine gradually become widespread, the role of DW images or ADC maps to define CTV becomes more important (32). Image-based dose optimization, especially targeting to the high-risk CTV, may facilitate effective and delicate dose delivery using dose painting techniques (33).
In conclusion, the aCTVHR was determined via quantitative analysis of ADC maps of a residual high-grade glioma. The IMRTADC plan in combination with DW images and ADC maps showed optimized dose distribution to the aCTVHR with dense cellularity. Incorporating ADC maps into radiation treatment plans for high-grade gliomas may help achieve biophysical dose optimization in local high-risk tumor volumes.

Figures and Tables

Fig. 1

Overall procedures used in the conventional intensity-modulated radiation therapy (IMRTconv) and an apparent diffusion coefficient (ADC) map-based IMRT (IMRTADC) plans. The left flow chart connected with black lines describes the general and common procedures to create two IMRT plans. The blue dashed line corresponds to the IMRTconv plan. Additionally required procedures for the IMRTADC were presented with orange line.

jkms-30-1522-g001
Fig. 2

The delineated target volumes in the intensity-modulated radiation therapy plan. The ADC-based high-risk clinical target volume (aCTVHR), contrast enhanced T1 image-based gross tumor volume (tGTV) and CTV (tCTV). The aCTVHR is defined on ADC maps by applying the ADC criteria for high-grade glioma to extract the high-risk residual target volume. The tCTV is defined by adding a 2-cm margin to the tGTV.

jkms-30-1522-g002
Fig. 3

Multi-modal and post-processed images used to determine the high-risk tumor volume in a high-grade glioma. (A) Computed tomography image. (B) Contrast enhanced-T1 weighted image. (C) Diffusion-weighted (DW) image (b=1,000 s/mm2). (D) ADC map. (E) DW ratio map with normalized average diffusion values of the contralateral normal brain tissues. The red and orange regions represent double- and triple-restricted water diffusion, respectively. (F) Extracted malignant residual tumor volumes on ADC maps with quantitative analysis for suspicious high-risk lesions.

jkms-30-1522-g003
Fig. 4

Comparison of the dose distributions in the IMRTconv plan and IMRTADC plan. (A) Dose distribution in the IMRTADC plan. Prescribed doses of 59.4 Gy and 50.4 Gy were optimized to the aCTVHR and relative complement volume of aCTVHR in tCTV (sCTV), respectively, using the simultaneous integrated boost technique. (B) Dose distribution in the IMRTconv plan. A dose of 59.4 Gy was prescribed to the tCTV.

jkms-30-1522-g004
Fig. 5

Comparison of the dose volume histograms (DVHs) in the IMRTconv and the IMRTADC plans. (A) Differential DVHs for the residual clinical target volumes at high risk on the ADC maps. Horizontal axis: doses normalized to the prescribed dose (59.4 Gy). (B) Cumulative DVHs for organs at risk.

jkms-30-1522-g005
Table 1

Planning parameters for conventional intensity-modulated radiation therapy (IMRTconv) and IMRT based on apparent diffusion coefficient (ADC) maps (IMRTADC). Both plans were based on contrast enhanced (CE)-T1 weighted images

jkms-30-1522-i001
Plan Images Total dose (Gy) Fraction number (fx) Daily dose (Gy/fx) Fields and beam delivery techniques
IMRTADC CE-T1* 59.4 (aCTVHR) 28 2.12 5 coplanar fields + 2 non-coplanar fields + SIB** technique
DW-MR 50.4 (sCTV) 1.8
ADC§
CTll
IMRTconv CE-T1 59.4 (tCTV††) 33 1.8 5 coplanar fields + 2 non-coplanar fields
CT

*CE-T1, contrast enhanced-T1 weighted; DW-MR, diffusion weighted-magnetic resonance; aCTVHR, clinical target volume (CTV) at high risk determined based on the ADC maps; §ADC, apparent diffusion coefficient; CT, computed tomography; sCTV, the relative complement volume of aCTVHR in tCTV, tCTV- (tCTV∩aCTVHR); **SIB, simultaneous integrated boost; ††tCTV, CTV delineated on the CE-T1 images by expanding gross tumor volume with a 2-cm margin.

Table 2

Evaluation of dose distributions using homogeneity (s-index) and conformity indices (conformity number) for the target volumes, aCTVHR showing malignancy of high-grade gliomas on ADC maps and tCTV defined on CE-T1 images

jkms-30-1522-i002
Volume IMRTADC* IMRTconv
Homogeneity (s-index) aCTVHR 1.49 1.60
tCTV§ 3.26 10.48
Conformity (CN) aCTVHR 0.48 0.032
tCTV 0.94 0.71

*IMRTADC, intensity-modulated radiation therapy (IMRT) plan optimized to aCTVHR and tCTV using simultaneous integrated boost; IMRTconv, conventional IMRT plan using CE-T1 images for tCTV; aCTVHR, clinical target volume at high risk defined on the ADC maps; §tCTV, expanded tGTV (gross tumor volume on CE-T1 images) with a 2-cm margin.

Table 3

Evaluation of the equivalent uniform doses (EUDs) for organs at risk (OARs) and EUD-based figure-of-merit (f-EUD) in the IMRTADC and the IMRTconv plans

jkms-30-1522-i003
Plan EUD [Gy]
Lens Optic nerve Optic Chiasm Brain Stem Pituitary Gland fEUD*
Lt. Rt. Lt. Rt.
IMRTADC 1.09 3.40 17.87 36.09 35.56 35.95 30.17 0.14
IMRTconv 1.21 3.91 18.60 41.19 39.12 41.62 34.99 0.12

*fEUD, EUD-based figure-of-merit to evaluate plan quality using EUDs for structures of interest.

Notes

Funding This research was supported by the Leading Foreign Research Institute Recruitment Program through the National Research Foundation of Korea (NRF) funded by the Ministry of Science, ICT & Future Planning (MSIP) (Grant No. 2009-00420).

DISCLOSURE The authors have no conflicts of interest to disclose.

AUTHOR CONTRIBUTION Conception and design of the study: Lee JW, Ahn KJ, Choe BY, Park JY. Coordination of the study: Hong S, Suh TS, Choe BY. Case selection, image acquisition and interpretation: Ahn KJ. Radiation treatment planning and analysis: Park JY, Lee JW, Park HJ, Hong S. Manuscript preparation: Park JY, Lee JW. Manuscript revision and editing: Suh TS, Lee JW, Ahn KJ, Choe BY, Hong S, Park HJ. Manuscript approval: all authors.

Appendices

APPENDIX

APPENDIX A

Dose homogeneity and conformity are evaluated with statistical model and conformity number, respectively, using following equations (1) and (2):
(1)
Sindex=iDi-Dp2×vTiVT,jkms-30-1522-e001
(2)
CN=VT,RIVT×VT,RIVRI.jkms-30-1522-e002
Equivalent uniform dose (EUD) for target volumes and organs at risk (OAR) are calculated using equations (3) and (4):
(3)
EUDtarget=12β-α+α2-4βlni=1NCe-αDi-βDi2NCjkms-30-1522-e003
(4)
EUDOAR=iviDia1/a.jkms-30-1522-e004
Tumor control probability (TCP) and EUD-based figure-of-merit (f-EUD) for principal structures are analyzed using equations, (5) and (6):
(5)
TCP=12iviexp2γ501-DiTCD50/ln2,jkms-30-1522-e005
(6)
f-EUD=1/1+k×i=1nωiEUDOARij=1mω′jEUDTargetj.jkms-30-1522-e006
The parameters used in the formula are described in the table below.
jkms-30-1522-a001

APPENDIX B

Radiobiological parameters in the following table are used to estimate the equivalent uniform dose (EUD) and tumor control probability (TCP) for principal structures.

jkms-30-1522-a002
*α/β, linear and quadratic term in dose at linear quadratic model of cell survival curve; TCD50, required dose for 50% control probability of tumor; TD50, radiation dose that results in a 50% severe complication rate of normal tissues; §a, biological model parameter to calculate equivalent uniform dose; γ50, normalized slope at the 50% tumor control probability.

References

1. Stieber VW, Munley MT. Central nervous system tumors overview. In : Mundt AJ, Roeske JC, editors. Intensity modulated radiation therapy: a clinical perspective. New York: BC Decker;2005. p. 231–240.
2. Dai CY, Nakamura JL, Haas-Kogan D, Larson DA. Central nervous system. In : Hansen EK, Roach M, editors. Handbook of evidence-based radiation oncology. New York: Springer;2007. p. 15–54.
3. Scott JN, Brasher PM, Sevick RJ, Rewcastle NB, Forsyth PA. How often are nonenhancing supratentorial gliomas malignant? A population study. Neurology. 2002; 59:947–949.
4. Fan GG, Deng QL, Wu ZH, Guo QY. Usefulness of diffusion/perfusion-weighted MRI in patients with non-enhancing supratentorial brain gliomas: a valuable tool to predict tumour grading? Br J Radiol. 2006; 79:652–658.
5. Xing L, Cotrutz C, Hunjan S, Boyer AL, Adalsteinsson E, Spielman D. Inverse planning for functional image-guided intensity-modulated radiation therapy. Phys Med Biol. 2002; 47:3567–3578.
6. Chang J, Thakur S, Perera G, Kowalski A, Huang W, Karimi S, Hunt M, Koutcher J, Fuks Z, Amols H, et al. Image-fusion of MR spectroscopic images for treatment planning of gliomas. Med Phys. 2006; 33:32–40.
7. Narayana A, Chang J, Thakur S, Huang W, Karimi S, Hou B, Kowalski A, Perera G, Holodny A, Gutin PH. Use of MR spectroscopy and functional imaging in the treatment planning of gliomas. Br J Radiol. 2007; 80:347–354.
8. Fuller CD, Choi M, Forthuber B, Wang SJ, Rajagiriyil N, Salter BJ, Fuss M. Standard fractionation intensity modulated radiation therapy (IMRT) of primary and recurrent glioblastoma multiforme. Radiat Oncol. 2007; 2:26.
9. Suzuki M, Nakamatsu K, Kanamori S, Okumra M, Uchiyama T, Akai F, Nishimura Y. Feasibility study of the simultaneous integrated boost (SIB) method for malignant gliomas using intensity-modulated radiotherapy (IMRT). Jpn J Clin Oncol. 2003; 33:271–277.
10. Chan JL, Lee SW, Fraass BA, Normolle DP, Greenberg HS, Junck LR, Gebarski SS, Sandler HM. Survival and failure patterns of high-grade gliomas after three-dimensional conformal radiotherapy. J Clin Oncol. 2002; 20:1635–1642.
11. Hamstra DA, Rehemtulla A, Ross BD. Diffusion magnetic resonance imaging: a biomarker for treatment response in oncology. J Clin Oncol. 2007; 25:4104–4109.
12. Wen PY, Kesari S. Malignant gliomas in adults. N Engl J Med. 2008; 359:492–507.
13. Sugahara T, Korogi Y, Kochi M, Ikushima I, Shigematu Y, Hirai T, Okuda T, Liang L, Ge Y, Komohara Y, et al. Usefulness of diffusion-weighted MRI with echo-planar technique in the evaluation of cellularity in gliomas. J Magn Reson Imaging. 1999; 9:53–60.
14. Catalaa I, Henry R, Dillon WP, Graves EE, McKnight TR, Lu Y, Vigneron DB, Nelson SJ. Perfusion, diffusion and spectroscopy values in newly diagnosed cerebral gliomas. NMR Biomed. 2006; 19:463–475.
15. Bulakbasi N, Guvenc I, Onguru O, Erdogan E, Tayfun C, Ucoz T. The added value of the apparent diffusion coefficient calculation to magnetic resonance imaging in the differentiation and grading of malignant brain tumors. J Comput Assist Tomogr. 2004; 28:735–746.
16. Stieber VW, McMullen KP, DeGuzman A, Shaw EG. Cancer of the central nervous system. In : Khan FM, editor. Treatment planning in radiation oncology. 2nd ed. Philadelphia: Lippincott Williams & Wilkins;2006. p. 410–428.
17. Brem SS, Bierman PJ, Brem H, Butowski N, Chamberlain MC, Chiocca EA, DeAngelis LM, Fenstermaker RA, Friedman A, Gilbert MR, et al. Central nervous system cancers. J Natl Compr Canc Netw. 2011; 9:352–400.
18. Young GS, Xia S. Advanced MR techniques in clinical brain tumor imaging. In : Newton HB, Jolesz FA, Malkin MG, Bourekas E, Christoforidis G, editors. Handbook of neuro-oncology neuroimaging. New York: Academic Press;2008. p. 136–149.
19. In : Barrett A, Dobbs J, Morris S, Roques T, editors. Chapter18, Central nervous system. Practical radiotherapy planning. 4th ed. London: Hodder Arnold;2009. p. 205–230.
20. Yoon M, Park SY, Shin D, Lee SB, Pyo HR, Kim DY, Cho KH. A new homogeneity index based on statistical analysis of the dose-volume histogram. J Appl Clin Med Phys. 2007; 8:9–17.
21. Feuvret L, Noël G, Mazeron JJ, Bey P. Conformity index: a review. Int J Radiat Oncol Biol Phys. 2006; 64:333–342.
22. Ebert MA. Viability of the EUD and TCP concepts as reliable dose indicators. Phys Med Biol. 2000; 45:441–457.
23. Hobbs RF, Baechler S, Fu DX, Esaias C, Pomper MG, Ambinder RF, Sgouros G. A model of cellular dosimetry for macroscopic tumors in radiopharmaceutical therapy. Med Phys. 2011; 38:2892–2903.
24. Qi XS, Semenenko VA, Li XA. Improved critical structure sparing with biologically based IMRT optimization. Med Phys. 2009; 36:1790–1799.
25. Warkentin B, Stavrev P, Stavreva N, Field C, Fallone BG. A TCP-NTCP estimation module using DVHs and known radiobiological models and parameter sets. J Appl Clin Med Phys. 2004; 5:50–63.
26. Gay HA, Niemierko A. A free program for calculating EUD-based NTCP and TCP in external beam radiotherapy. Phys Med. 2007; 23:115–125.
27. Suit HD, Baumann M, Skates S, Convery K. Clinical interest in determinations of cellular radiation sensitivity. Int J Radiat Biol. 1989; 56:725–737.
28. MacDonald SM, Ahmad S, Kachris S, Vogds BJ, DeRouen M, Gittleman AE, DeWyngaert K, Vlachaki MT. Intensity modulated radiation therapy versus three-dimensional conformal radiation therapy for the treatment of high grade glioma: a dosimetric comparison. J Appl Clin Med Phys. 2007; 8:47–60.
29. Kono K, Inoue Y, Nakayama K, Shakudo M, Morino M, Ohata K, Wakasa K, Yamada R. The role of diffusion-weighted imaging in patients with brain tumors. AJNR Am J Neuroradiol. 2001; 22:1081–1088.
30. Moffat BA, Chenevert TL, Lawrence TS, Meyer CR, Johnson TD, Dong Q, Tsien C, Mukherji S, Quint DJ, Gebarski SS, et al. Functional diffusion map: a noninvasive MRI biomarker for early stratification of clinical brain tumor response. Proc Natl Acad Sci U S A. 2005; 102:5524–5529.
31. Kwee TC, Takahara T, Ochiai R, Nievelstein RA, Luijten PR. Diffusion-weighted whole-body imaging with background body signal suppression (DWIBS): features and potential applications in oncology. Eur Radiol. 2008; 18:1937–1952.
32. Metcalfe P, Liney GP, Holloway L, Walker A, Barton M, Delaney GP, Vinod S, Tome W. The potential for an enhanced role for MRI in radiation-therapy treatment planning. Technol Cancer Res Treat. 2013; 12:429–446.
33. Tsien C, Moughan J, Michalski JM, Gilbert MR, Purdy J, Simpson J, Kresel JJ, Curran WJ, Diaz A, Mehta MP. Phase I three-dimensional conformal radiation dose escalation study in newly diagnosed glioblastoma: Radiation Therapy Oncology Group Trial 98-03. Int J Radiat Oncol Biol Phys. 2009; 73:699–708.
TOOLS
ORCID iDs

Ji-Yeon Park
https://orcid.org/http://orcid.org/0000-0002-5950-2860

Tae Suk Suh
https://orcid.org/http://orcid.org/0000-0002-3057-1627

Jeong-Woo Lee
https://orcid.org/http://orcid.org/0000-0002-2492-9186

Kook-Jin Ahn
https://orcid.org/http://orcid.org/0000-0001-6081-7360

Hae-Jin Park
https://orcid.org/http://orcid.org/0000-0003-0454-1528

Bo-Young Choe
https://orcid.org/http://orcid.org/0000-0001-8770-6708

Semie Hong
https://orcid.org/http://orcid.org/0000-0003-2838-2015

Similar articles