

 PDF
PDF ePub
ePub Citation
 Print
Print


INTRODUCTION
Out-of-hospital cardiac arrest (OHCA) is a global health problem and incidences of OHCA vary greatly across different regions not only within countries but also between countries (1234). Resource allocation to improve OHCA survivals targets communities with either high incidences or low survival rates. To implement effective community interventions, the true incidence rates and survival outcomes of OHCA must be evaluated.
Previous OHCA studies have extensively reported on the definite temporal variability and time-geographic distribution patterns (5678). Epidemiological reports support the circadian variability with a daytime excess and overnight nadir in the occurrence of OHCAs (5679). Furthermore, incidence and mortality are not uniformly distributed geographically; distinct hot spots exist in which these variables are greater than expected (1810111213). Understanding temporal variability and geographic distribution observations provides a framework that may lead to the maximization of the benefits of interventions to increase the probability of a favorable outcome (59121314).
The regional OHCA incidence rates were traditionally calculated with the number of incidence cases in the region as the nominator and the residential population as the denominator (population at risk during a specific period of time) (1238910111213). Based on the regional OHCA incidence rates, interventions to improve OHCA outcomes, including ambulances and autonomic external defibrillators, were strategized and provided in high-risk regions. However, it is possible that certain areas may have more transient persons at risk during the daytime hours, resulting in a higher absolute number of arrests (12). For example, town centers concentrated with a large number of offices, railway stations and international airports were reported as hot spots for OHCA with an unexpected cluster attributing to the influx of daytime transient population and nonresident arrests (815).
The daytime transient population who migrate inter-regions for work or school during the daytime hours should be considered to calculate the incidence rate of acute medical events such as OHCA. The accurate measurement of event incidence may not be informative in determining the prevalence of chronic diseases, but it is a crucial component in effective resource allocation when developing community interventions for acute medical illness. Furthermore, because OHCAs have circadian variability and geographic distribution patterns, the daytime transient population should be considered to calculate the regional incidence rate in order to determine the true high risk population (2567815). To date, there have been few studies that incorporated the daytime transient population in calculations to investigate the OHCA incidence rate.
The goal of this study was to estimate the true regional incidence rate of OHCA in Korea and to investigate the characteristics of the regions with large differences between the previously reported rate and the newly calculated incidence rate that considers nighttime residential population and daytime transient population as population at risk.
MATERIALS AND METHODS
Data source and setting
The cardiovascular disease surveillance (CAVAS) database is a large-scale, nationwide, retrospective observational database of patients in Korea who have experienced confirmed OHCA (16171819). The database is population-based and contains emergency medical service (EMS)-assessed OHCAs among the entire population of the country. The cases were abstracted from the ambulance run sheets in which an OHCA was coded. For this study, data from January 2006 to December 2010 were used.
Ambulance run sheets are electronically stored in each provincial EMS headquarter, which is operated by the respective fire department. Trained medical record reviewers visited the study hospitals and reviewed the medical records to collect information related to risks and outcomes using the Utstein guidelines for reporting cardiac arrest and resuscitation data (20). All reviewers were formally trained and were provided with an operation manual to accurately abstract the data from the medical records and transcribe the data onto case report forms.
The Korean EMS system is single tiered and sponsored by the government. Basic-to-intermediate service level of ambulances are operated by 16 provincial headquarters of the national fire department. There are approximately 1,350 ambulance stations across the nation, which serve 48 million people over an area of approximately 100,000 square kilometers. The annual run volume of the prehospital service was slightly greater than 1.4 million. Two or three crew members usually ride in each ambulance.
Study population
Korea is comprised of 248 counties, the boundaries of which are defined by statute for geographical administrative purposes. The counties are classified as metropolitan (Gu), urban (Si), and rural (Gun) according to their population size. The metropolitan counties (Gu) are segmented administrative districts of a metropolitan city (for example, Seoul) with populations of more than 500,000; the urban counties (Si) are located in urban areas with populations of more than 100,000; the rural counties (Gun) are located in rural areas with populations of less than 100,000. There were 95 metropolitan, 67 urban, and 86 rural counties in 2010, and the median population sizes and population densities of each level were 298,748 residents (range: 47,260 to 640,732) and 8,873.0 people per square kilometer (range: 358.5 to 28,731.2) in metropolitan (Gu) counties, 183,673 residents (range: 41,395 to 565,201) and 531.7 people per square kilometer (range: 60.9 to 9,226.6) in urban (Si) counties, and 41,481 residents (range: 7,737 to 185,811) and 77.0 people per square kilometer (range: 19.4 to 495.7) in rural (Gun) counties (16). Each county has its own health care authorities and administrative authorities that serve the population.
Eligible patients were hospital record-confirmed OHCA patients during the five years of the study period. Each OHCA was assigned to a county according to the location of collapse because neighborhood factors including bystanders' early response, nearest autonomic external defibrillators, and prompt EMS resuscitative efforts are critical to survival outcomes. If a case was missing data on the location of collapse, the address of fire department that had the response ambulance was used. The time and date of the call received at dispatch was used as a surrogate measure for the time of OHCA occurrence (5). The time of day was divided into two 12-hr time intervals (0601-1800, 1801-0600), which were defined as daytime (0601-1800) and nighttime (1801-0600) to maintain comparability with previous reports (5).
Outcome measure
Information about the Korean population was obtained from the Korea Census data (Supplementary Table). The nighttime residential and daytime transient populations were investigated in the 2010 Census. The daytime transient population was calculated based on internal migration statistics as provided by the Korean National Statistical Office (KNSO). The KNSO reports such statistics based on survey results from 10% of the sampled population.
The nighttime population was the same as the registered residential population. The daytime population was defined by adding the daytime influx of population to the nighttime residential population and subtracting the daytime outflow. The D index (Daytime population index) was defined as the ratio of the daytime population to the nighttime population and was calculated by dividing the daytime population by the nighttime population and multiplying the result by 100.
The conventional age-standardized incidence rates (CASRs) for EMS-assessed OHCA per 100,000 person-years by gender were calculated for each county using the total nighttime population in 2010 as the standard population. Daytime corrected age-standardized incidence rates (DASR) of EMS-assessed OHCA per 100,000 person-years were calculated with standardized daytime incidence rates and standardized nighttime incidences. To reflect the actual risk population, the daytime incidences were calculated from the OHCAs that occurred during the daytime and from the daytime population, and the nighttime incidences were calculated from the OHCAs that occurred during the nighttime and from the nighttime population.
Statistical analysis
The distributions of categorical variables are reported as percentages. The continuous variables that were not distributed normally are presented as medians with interquartile ranges. The CASRs and DASRs are presented in quintiles. Bland-Altman plots were used to compare the CASRs and DASRs by gender. The CASR, DASR, D index, the daytime and nighttime population, and the number of OHCAs during the 5 yr were used to evaluate the characteristics of the regions with the greatest and smallest differences between the CASR and the DASR by gender. Geographical maps of the CASRs and DASRs by gender were evaluated in order to identify the differences in the geographical distribution using administrative boundaries.
RESULTS
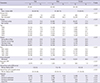
There were 97,291 eligible EMS-assessed OHCA cases during the study period. The characteristics of the patients, community, EMS factors, and survival outcomes for OHCAs are presented by gender in Table 1.
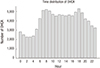
Of the OHCAs, 34.5% and 29.4% occurred during the daytime hours from 6 AM to noon and from noon to 6 PM, respectively, whereas 20.3% and 15.8% occurred during the nighttime hours from 6 PM to midnight and from midnight to 6 AM, respectively (Fig. 1). In Korea, the age-standardized incidence rates of OHCAs per 100,000 person-years by gender and occurrence time were 34.6 (95% CI: 34.3-35.0) during the daytime and 24.8 (95% CI: 24.5-25.1) during the nighttime among males, and 14.9 (95% CI: 14.7-15.1) during the daytime and 10.4 (95% CI: 10.2-10.6) during the nighttime among females.
The mean CASR and DASR per 100,000 person-years of each county by gender were 69.2 (range 14.0-180.7) and 66.8 (range 14.7-154.6) in males and 30.8 (range 7.8-65.2) and 30.6 (range 7.8-64.6) in females, respectively.
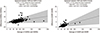
Bland-Altman plots of the CASRs and DASRs by gender are shown in Fig. 2. In both genders, there were positive linear trends between the average CASR and DASR and the difference between the CASR and DASR. The difference between the CASR and DASR increased as the average CASR and DASR increased.
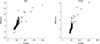
Scatter plots of the D index and the difference between the CASR and DASR by gender are presented in Fig. 3. The difference between the CASR and DASR ranged from 35.4 to -11.6 in males and from 6.1 to -1.0 in females. There were positive linear trends between the D index and the difference between the CASR and DASR in both genders. The difference between the CASR and the DASR increased as the D index increased.
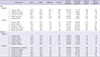
The characteristics of the 5 regions with the greatest and the 5 regions with the smallest differences between the CASR and the DASR are evaluated in Table 2. The 5 regions with the greatest differences between the CASR and the DASR had larger D index, indicating larger daytime population and smaller nighttime population, while the regions with the smallest differences had small D index for both genders. Nine of the 10 regions with the greatest differences and 7 of the 10 regions with the smallest difference between the CASR and the DASR were in metropolitan area (-gu in county name).
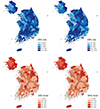
Fig. 4 shows the geographical distribution of the annual CASRs and DASRs of EMS-assessed OHCAs per 100,000 person-years by gender. Several metropolitan counties had large differences between the CASR and DASR.
DISCUSSION
Defining the at-risk population was essential to measure the disease burden based on the incidence rate. The incidence rates varied depending on the denominator of the at-risk population. In this study, the difference between the CASR and DASR per 100,000 person-year ranged from 35.4 to -11.6 in males and from 6.1 to -1.0 in females. Although many studies have explored the incidence of OHCA, only a few equivalent quantitative studies have elucidated the differences between the nighttime population and the daytime transient population as the denominators when measuring OHCA incidence.
There were significant temporal and geographical variations in the OHCA incidence. A daytime excess and an overnight nadir of OHCAs was observed, which is generally consistent with previous studies regardless of the characteristics of the patients and arrest circumstances (5679). In this study, 63.9% of OHCAs occurred during the daytime, comparable to the value of 59.6% reported in the ROC study (5). The greater occurrence of OHCAs during the day may be associated with endogenous rhythms and environmental factors, including temperature (2122). Numerous epidemiological reports support the finding that there is circadian variability with a daytime excess and an overnight nadir in the occurrence of OHCA, as well as a seasonal variation with lower incidence rates in the summer and higher rates in the winter months in both hemispheres (567921). Furthermore, this circadian and seasonal variability affected the survival outcomes with the lowest survival to discharge rate when the OHCA occurred during the 0001-0600 time interval and the highest during the 1201-1800 time interval, while the odds of survival to discharge were statistically lower during the winter and spring (5923). These results may be due to an association between the survival outcomes of OHCA and temporal variability in the capabilities of EMS and hospital resources (2122).
The nationwide OHCA registry includes geographic and temporal information for all OHCAs. The two maps in this study show the regional OHCA incidences by gender with the different population denominators. The differences between the CASR and the DASR of OHCA were greater in counties with a larger daytime transient population. The regions with the greatest difference between the CASR and the DASR had large D index values, indicating larger daytime population and smaller nighttime population, while the regions with the smallest differences between the CASR and the DASR had small D index values in both genders, indicating smaller daytime population and larger nighttime population. Most (16 out of 20) of the regions with the greatest and smallest differences between the CASR and the DASR in both genders were in a metropolitan area (Gu) with a large migrating population. In other words, the CASR in a commercial and industrial area of a metropolitan city with a large daytime population influx and a nighttime outflow was overestimated, whereas the CASR in a residential area of a metropolitan city with a nighttime population influx was underestimated. In addition, the Bland-Altman plots indicated that the differences between the CASRs and the DASRs tended to increase as the incidence of OHCA increased. Many studies have identified high-risk hot spots of OHCA (1112). A previous study reported an unexpected cluster at town centers, railway stations and international airports (815). Although the incidences may have been affected by the daytime transient population and nonresident arrests, the daytime transient population was not considered due to the difficulty in measuring this population. In order to accurately estimate the burden of OHCA that integrates the characteristics of daytime excess and hot spots with daytime transient population, the denominator for calculating the OHCA regional incidences should be the true population at risk (2567815).
These findings have many public health implications such as resource allocation for the chain of survival including cost-effective public access automatic external defibrillator (AED) strategy, planning ambulance deployment, organizing targeted cardiopulmonary resuscitation (CPR) training, raising community awareness, and mobilizing community action (58). Recognition and consideration of temporal and geographical characteristics of OHCA is crucial in developing such public health measures and would greatly increase their effectiveness. Recent studies have demonstrated that the best outcomes are achieved when devices are placed in areas with a high incidence of cardiac arrests and when there is ongoing supervision of emergency plans. However, operational decisions based on conventional incidence rate analysis can be limited. For example, AEDs had been disseminated in public places such as airports, train stations, and public buildings based on incidence rate with conventional methods (8242526). However, the publicly placed AED could not cover the majority of OHCA, because the true incidence rates in residential areas were underestimated and 65% to 80% of OHCAs occur in residential areas (2728). In this study, the conventional incidence rate was found to be overestimated in a commercial and industrial area of a metropolitan city with a large daytime population influx and a nighttime outflow, while the conventional incidence rate was underestimated in a residential area of a metropolitan city with a nighttime population influx. Areas with a greater incidence rate of OHCA based on the true at-risk population should be allocated more resources, such as bystander CPR education programs to reduce CPR initiation time, implementation of public access AED programs to shorten the time to defibrillation, and ambulances for the fastest ambulance response times (11229). Thus, community interventions such as neighborhood access defibrillators and community first responder programs for cardiac arrest should be considered based on the true regional incidence rate.
Our study has limitations. Temporal variability studies of OHCA are limited by their ability to accurately determine the precise time of OHCA occurrence. The daytime transient population was not confirmed of its validity, as the data was based on the internal migration statistics, which were the reported statistics of 10% sampled population provided by the Korean National Statistical Office. We accounted the daytime transient population as circadian variability into two 12-hr time intervals. The present studies are a prelude to further analysis to understand the causes of these variations as well as the implementation of targeted interventions to reduce the variability (34).
In conclusion, this study was conducted in a nationwide setting to demonstrate that the regional incidence rate considering the daytime transient population is different from the conventional incidence rate of OHCA. Conventional incidence rate was found to be overestimated in counties that had many cases of cardiac arrest and in metropolitan cities with a large daytime population influx and a nighttime outflow, while the rate was underestimated in a residential area of a metropolitan city with a nighttime population influx. An accurate estimation of the burden of OHCA is essential for effective resource allocation strategies and appropriate resource planning for community support, which would enhance survival outcomes of cardiac arrest.
 XML Download