

 PDF
PDF ePub
ePub Citation
 Print
Print


INTRODUCTION
Drug-induced parkinsonism (DIP) is the second most common form of parkinsonism (1) after Parkinson's disease (PD) and constitutes 15%-60% of all parkinsonism cases (2) in the elderly. In the past, most cases of DIP were caused by classical antipsychotics, whereas more recently, a wider range of classes of drugs have been reported as responsible for DIP cases. Classes of drugs known to cause DIP include atypical antipsychotics, benzamide derivatives used to control nausea and vomiting, phenothiazine derivatives used to treat vertigo, drugs that interfere with vesicular storage of monoamines, calcium channel blockers, antidepressants and others. Among the drugs known to cause DIP, prokinetics/antiemetics such as levosulpiride, metoclopramide, and clebopride are leading causes of DIP, especially among the elderly in Korea (34).
Most previous studies of cognitive dysfunction in DIP have investigated patients with schizophrenia taking typical or atypical antipsychotics. Studies on cognitive changes in DIP in the setting of a neurology clinic are rare (567). In a previous report on cognitive dysfunction in DIP, the study subjects were a heterogeneous population in terms of their underlying diseases and the drugs responsible for their DIP; because these drugs possessed varying degrees of dopamine-blocking potency, the interpretation of the results of this study is difficult (8). Because the age of onset of DIP is late in life (348), it is difficult to determine whether cognitive change in DIP is due to normal aging or to pathological processes underlying or accompanying DIP. Moreover, some DIP patients are in a prodromal stage of a neurodegenerative disease, which is associated with cognitive dysfunction (9101112).
To investigate whether DIP is associated with cognitive dysfunction and to explore the mechanisms underlying cognitive dysfunction in DIP, we analyzed clinical and neuropsychological test results together with T1-weighted 3D volumetric MR images of patients with prokinetic/antiemetic-induced parkinsonism. The subjects of our study were consecutively enrolled from our retrospective cohorts and showed no evidence of presynaptic dopaminergic deficits in [18F]-fluorinated N-3-fluoropropyl-2-β-carboxymethoxy-3-β-(4-iodophenyl) nortropane positron emission tomography ([18F]-FP-CIT PET) scans.
MATERIALS AND METHODS
Subjects
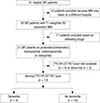
We analyzed magnetic resonance images and neuropsychological test results from a retrospective cohort of 14 DIP patients recruited from the movement disorders clinic at Hallym University Sacred Heart Hospital. A flow diagram illustrating the patient recruitment process is shown in Fig. 1. Briefly, among 385 consecutive parkinsonian patients who were enrolled in our standardized parkinsonism registry and had undergone a standardized protocol of history taking, neurological examination, neuropsychological evaluation and magnetic resonance imaging (MRI) from May 2011 to August 2013, we identified 61 DIP patients who had been diagnosed with parkinsonism according to the criteria used in our previous publication (3). T1-weighted 3D volumetric MR images included in our MR protocol were available for only 38 patients because MRI had been performed at a referred hospital in the other patients (n=23). Among the remaining 38 DIP patients, the drugs responsible for DIP in 21 patients were prokinetics/antiemetics such as levosulpiride, metoclopramide, or clebopride. [18F]-FP-CIT PET scans were normal in 14, abnormal in 3 and not available in 4 patients. Our routine MRI protocol included T1-weighted 3D volumetric MRI. Neuropsychological evaluations were conducted using the Seoul Neuropsychological Screening Battery (SNSB) (13) at least 24 hr after discontinuing the drugs responsible for the patient's DIP. Thirty healthy age- and gender-matched controls with no past or present neurological or psychiatric illnesses were also included in the study. All patients and controls underwent neurologic examinations and were evaluated using the Unified Parkinson disease rating scale (UPDRS) and the Mini Mental State Examination (MMSE). No study subject in the control group had parkinsonian symptoms or signs, and the mean MMSE score was 27.4 (range 25-30).
Magnetic resonance image acquisition and processing
We used a multisequence 3T MRI scanner (Achieva, Philips, Best, The Netherlands) to acquire MR images. T1-weighted 3D MPRAGE image (1×1×1 µL resolution) files in DICOM format were analyzed using FreeSurfer software (v5.0, Athinoula A. Martinos Center for Biomedical Imaging, Charlestown, MA, USA). FreeSurfer is a semi-automated brain morphometry tool. The details of the postprocessing sequence implemented by FreeFurfer used in this study have been described elsewhere (14151617). Briefly, the processing included skull stripping, Talairach transformation, optimization of the grey matter-white matter and grey matter-CSF boundaries, and segmentation (1617). The cortical thickness was individually assessed at each vertex (16). All images were aligned to a common surface template using a high-resolution surface-based averaging technique that aligned cortical folding patterns (14). Finally, before further analysis, the cortical thickness maps were smoothed with a 10 mm full width at half maximum 2-dimensional Gaussian kernel to reduce local variations in the measurements.
[18F]-FP-CIT PET scan
[18F]-FP-CIT PET was performed using a PET/CT scanner (Gemini TF; Phillips-ADAC Medical Systems, Cleveland, OH, USA) that provides an in-plane spatial resolution of 2.0 mm full width at half maximum at the center of the field of view. The drugs that were responsible for patients' DIP were discontinued by all patients at least 24 hr before the scans were obtained. Image acquisition was started 90 min after intravenous injection of [18F]-FP-CIT (185 MBq). Emission PET data were acquired for 10 min in the 3-dimensional mode after brain CT, which was performed in the spiral mode at 120 kVp and 150 mAs. [18F]-FP-CIT PET images were reconstructed from CT data after attenuation correction using the ordered-subset expectation maximization (OSEM) algorithm and an all-pass filter with a 128×128 matrix.
Statistical analysis
Statistical analyses were performed using SPSS Statistics V21. Independent t-tests were used to assess differences between groups for all demographic variables, brain volumetric measurements and subcortical volume measurements. Variations in regional cortical thickness and volume between DIP patients and the control group were estimated using a general linear model (GLM) at each vertex across the cortical surface, with group (DIP, control) as the dependent variable and age as a nuisance variable, using Qdec implemented in FreeSurfer software. The cortical surfaces of the left and right hemispheres were analyzed separately. The maps generated by this analysis show the distribution of P values for pairwise comparisons between DIP patients and healthy controls. Clusters of vertices for which the P values for thickness-group and volume-group regression coefficients exceeded a predetermined threshold were identified, and cluster-wise statistical significances were calculated via 10,000 Monte Carlo simulations implemented in Qdec (P<0.05) (18). Subsequently, region-of-interest (ROI) analyses were performed by creating labels for gyral regions of interest and calculating the mean cortical thicknesses for each labeled ROI. Results of the neuropsychological tests for all individuals were transformed into Z-scores adjusted for age, sex, and education. Correlations between the average subcortical volume and the motor UPDRS score or between cortical thickness and neuropsychological test scores were analyzed using Kendal correlation analysis. In all analyses, the threshold for statistical significance was set at P<0.05.
RESULTS
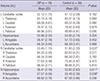
Demographic data for 14 patients with DIP are summarized in Table 1. Motor disability in DIP patients was of mild to moderate severity according to Hoehn and Yahr staging criteria (1.5 to 3) with the exception of one patient who also suffered from dementia and tuberculous spondylitis. Based on extensive neuropsychological evaluations, 4 out of 14 patients (28.6%) were diagnosed with dementia, and the remaining 10 patients had mild cognitive impairment (MCI). Two DIP patients had non-amnestic MCI, and the other patients with MCI had amnestic MCI. A history of rapid eye movement behavior disorder was present in 2 patients.
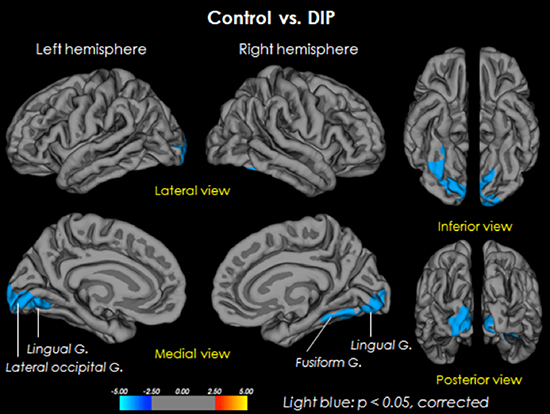
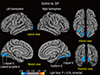
To explore whether cognitive dysfunction in DIP patients was related with underlying structural changes in the brain, we compared 3D volumetric MRI data between patients with DIP and control subjects. In a group comparison, DIP patients exhibited decreased cortical gray matter volumes in both hemispheres (P=0.041). However, cortical white matter and total intracranial volumes were not significantly different between the two groups (Table 2). When subcortical structures were examined, it was found that the volume of the right hippocampus was smaller in DIP patients (P=0.011, uncorrected), whereas the volume of the cerebellum (P=0.022, uncorrected) and the volume of the right amygdala (P=0.038, uncorrected) were larger in DIP patients compared with the control group (Table 3). The volume of the right hippocampus was inversely correlated with the Seoul Verbal learning test (SVLT) recognition score (r=-0.614, P=0.015), and the volume of the right amygdala was correlated with the SVLT immediate recall score (r=0.600, P=0.016) (Table 4). We did not observe a correlation between volumes of subcortical structures and motor UPDRS scores (data not shown). Cortical thickness was significantly decreased in the bilateral lingual gyrus (P=0.002, corrected), the right fusiform gyrus (P=0.032, corrected) and part of the left lateral occipital gyrus (P=0.07, corrected) (Table 5 and Fig. 2) in DIP patients compared with control subjects. Cortical thickness in the left lingual gyrus was correlated with recognition scores on the Rey complex figure test (r=0.674, P<0.007) (Table 4). SVLT immediate recall scores were inversely correlated with cortical thickness in the right fusiform gyrus (r=-0.511, P=0.040).
DISCUSSION
The analysis of our retrospective cohort of patients with DIP caused by prokinetics/antiemetics showed that cognitive dysfunction was present in all patients that were studied. Analysis of 3D MR brain volumetry in DIP with MCI demonstrated that DIP patients have cortical gray matter atrophy and that the cortical thickness is significantly reduced in specific brain regions, including the bilateral lingual, right fusiform and part of the left lateral occipital gyri. To our knowledge, this is the first study to show structural changes in the brain that are associated with cognitive dysfunction in DIP. Although the number of cases in our retrospective cohort of DIP caused by prokinetic/antiemetics is relatively small, we believe that our data is not biased for several reasons. First, we enrolled consecutive parkinsonian patients based strictly on clinical criteria for the diagnosis of DIP, and neuropsychological test results and MRI data were not considered in the diagnosis. Second, we studied only patients with DIP caused by prokinetics/antiemetics, excluding those on classical or atypical antipsychotics to exclude heterogeneous underlying neurological or psychiatric disorders such as dementia, depression or schizophrenia, which may be associated with structural changes in the brain. Third, by studying only parkinsonian patients with normal [18]F-FP-CIT PET scans, we excluded the possibility of enrolling patients with Parkinson's disease or other Parkinson plus syndromes in preclinical stages to avoid including subjects in whom parkinsonian symptoms could be aggravated by dopamine antagonists. In our study, all patients had cognitive dysfunction to varying degrees ranging from MCI in a single domain to dementia. Recently, cognitive dysfunction was reported in DIP patients recruited from a neurology outpatient clinic (8). Because the DIP patients investigated in that study were drawn from a mixed population that had developed DIP as a result of taking drugs with diverse dopamine receptor-blocking capabilities and that also suffered from underlying central nervous system disorders, direct comparison of our results with the results of that study is difficult. Nevertheless, a higher prevalence of cognitive dysfunction in both studies suggests that cognitive dysfunction may be a risk factor for DIP. Kim et al. (8) observed that cognitive dysfunction was reversible in some of their patients and suggested toxic or metabolic effects as a mechanism of DIP. However, given the structural changes observed in the brains of our DIP patients, our results strongly suggest that underlying pathological processes were resulting in anatomical changes in patients with DIP caused by prokinetic drugs, although we do not know the extent to which these processes may be reversible. The possibility that underlying pathological processes may exist in DIP has been raised in a number of previous studies, although we do not know whether such pathological processes represent a distinctive pathology or a prodromal stage of known neurodegenerative disorders (101112). The cause of increased right cerebellar volume is not clear. Increased right cerebellar cortical volume could be related to the compensatory changes of the cortical thickness in the occipital cortex for adapting the lack of sensorial inputs. Our finding of volumetric changes and areas of cortical thinning in subcortical structures in our DIP patients may offer clues to increase our understanding of the pathological processes underlying DIP induced by prokinetics. Although hippocampal volumes were smaller in DIP, the brain regions in which changes in cortical thickness were observed in DIP differ from those observed in Alzheimer's disease (AD) or frontotemporal dementia (19). In AD, cortical thinning predominantly involves the temporal and parietal areas extending into the frontal lobes. In amnestic MCI, which may represent a transitional stage between a healthy, normal state and Alzheimer's disease, cortical thinning involves the left medial temporal lobe, the precuneus, and anterior and inferior basal temporal, insular, and temporal association cortices (20). In dementia with Lewy bodies (DLB), a reduction in cortical thickness was reported in the pericalcarine and lingual gyri, cuneus, precuneus, and superior parietal gyrus bilaterally (21). Interestingly, areas of cortical thinning in PD patients with cognitive dysfunction are similar to those observed in our DIP patients (22). Taken together, these results suggest that the pathology underlying DIP may be heterogeneous.
Our investigation of correlations between volumetric changes or changes in cortical thickness and neuropsychological test results for the corresponding cognitive domains also suggest that anatomical changes underlie cognitive dysfunction in our DIP patients. However, verbal and visual function showed false lateralization in our results of correlation analysis. To rule out a possible coding error, we reviewed our analysis repeatedly and confirmed our results. Currently, we do not have a clear explanation for this observation; it is possible that compensatory changes or brain plasticity may have led to these changes. However, we cannot exclude the possibility that neuropsychological test results may have been confounded by the residual effects of a DIP-causing drug. Beyond these considerations, two additional potential limitations to our study should be recognized. First, we considered only patients with DIP due to prokinetics/antiemetics. Thus, the DIP patients in this study may not truly represent the whole DIP patient population. Finally, the results of this study concerned only the early stages of DIP, without long-term follow up. The examination of SNSB was done within 1 week after the discontinuation of an offending drug. Validation of our observations in a larger cohort and longitudinal studies by other groups would be useful to increase our understanding of DIP.
In conclusion, 3D volumetric MRI finds structural changes in the brains of patients with DIP caused by prokinetics/antiemetics, which may be associated with cognitive dysfunction. Whether cognitive dysfunction is a risk factor for DIP should be be validated in larger studies.


 XML Download