Journal List > J Korean Med Sci > v.30(9) > 1022722

Park, Ahn, and Lee: Self-rated Subjective Health Status Is Strongly Associated with Sociodemographic Factors, Lifestyle, Nutrient Intakes, and Biochemical Indices, but Not Smoking Status: KNHANES 2007-2012

Abstract

Despite advertised health warnings regarding the deadly hazards of smoking, many people have not heeded recommendations to quit smoking. We examined factors that affect self-rated subjective health status (SRH) scores among lifestyle, nutrient intake and biochemical parameters, and the association of SRH scores and smoking status in a large Korean adult population. Adjusted odd ratios for SRH were calculated for smoking status, selected biochemical data, and food and nutrient intake obtained using the 24-hr recall method after covariate adjustment in the 2007-2012 Korean National Health and Nutrition Examination Survey (27,534 men and women aged ≥ 20 yr). Age, sex, income, education, drinking, exercise and stress levels were associated with SRH scores, regardless of smoking status (P < 0.001). Interestingly, people in any smoking status groups considered the well-known indicators for metabolic diseases (HDL cholesterol, glucose, aspartate aminotransferase, and alanine aminotransferase in the circulation), and the intake of fiber, total vitamins A, and vitamin C as indicators of SRH. Especially in current smokers, higher intake of nutritious food groups such as grains (OR = 1.227), vegetables (OR = 1.944), and milk (OR = 2.26) significantly increased the adjusted odds ratio of SRH. However, smoking status was not associated with SRH scores. In conclusion, SRH is affected by the indices related to health but not smoking status in Korean adults. The development of a new indicator of the direct adverse effects of smoking at regular health check-ups might be required to modulate the SRH in smokers and a nutritional education should not include the possible attenuation of adverse effects of smoking by good nutrition.

INTRODUCTION

Smoking remains one of the most preventable causes of morbidity and mortality worldwide (1). Smoking has been documented to induce various harmful diseases including lung cancer, leukemia, coronary heart disease and peptic ulcer disease over the past 50 yr, and successful smoking cessation results in immediate health improvements (234). Educational efforts have focused on increasing public knowledge about the deleterious effect of smoking on health, and various cessation methods have been applied to smokers (56). However, public educational efforts have not succeed to decrease smoking rates in Korea including Asian countries and still the smoking rates (adult males: 48.3% in 2010) rank at the top among Organization for Economic Cooperation and Development (OECD) countries (7). Quit rates among smokers are low, even in smokers who intend to quit (8910). However, some smokers have no intention of quitting, as smoking helps relieve mental stress (1112). In addition, many smokers fear weight gain, even though recent studies reported that the benefits of quitting smoking far exceeded the risks associated with the amount of weight gained (13). For these reasons, it is difficult to convince smokers to quit smoking, as behavior modification is preceded by changes of intention (1314). Furthermore, knowledge about adverse effects of smoking does not help smokers quit smoking (14). Thus, it is important to understand which factors affect the changes of intention, as having the intention to quit smoking plays an important role in a successful smoking cessation program.
The self-rated subjective health status (SRH) assessment is a comprehensive measure of the general health status according to the individual's perception. The SRH reflects both mental and physical health (15) and also incorporates elements of health-related behaviors and social well-being (1617). The SRH may be involved in modulating the intention to quit smoking, as smoking is the most important risk factor for chronic disease. SRH is obtained typically by asking the individuals to describe their health status on a Likert scale (18). Persons who report SRH as poor have increased mortality from cardiovascular disease, cancer and other diseases (1920), and the SRH has been shown to have high reliability, validity and predictive power for various illnesses and conditions in large scale surveys (21). The SRH is a useful predictor of various health outcomes, including mortality (2021). The SRH is affected by a variety of lifestyle, diet and biochemical factors, with smoking as one of the major factors (2223). Smokers with low SRH might be motivated to quit smoking by education about the adverse effects of smoking on health. However, some smokers who have favorable SRH scores will not give the motivation to quit smoking by the education. Therefore, smokers with high SRH scores may not respond to smoking cessation interventions that explain the adverse effects of smoking.
To our knowledge, no study has examined the association of SRH and smokers in a large population-based sample, especially using a Korean population. Thus, in the present study, the factors that affected SRH scores were examined among lifestyle, dietary intake and biochemical parameters and the association of SRH and smoking status was determined in a large Korean population study with a stratified multistage probability sampling design. This study described the factors that modulated SRH and those that increased SRH scores in smokers. This study provided basic information about smokers with high SRH scores, which will be useful for planning future smoking cessation programs and nutrition education.

MATERIALS AND METHODS

Design and data collection

This study was based on data obtained from the Korea National Health and Nutrition Examination Survey (KNHANES) IV (2007-2009) and the KNHANES V (2010-2012) surveys. KNHANES surveys are conducted annually using a rolling sampling design that involves a complex, stratified, multistage probability-cluster survey of a large representative sample of the non-institutionalized civilian population in South Korea. The survey is performed by the Korean Centers for Disease Control and Prevention and Korean Ministry of Health and Welfare.
The present cross-sectional analysis was restricted to adult participants ≥20 yr of age who completed the health examination survey and the nutrition survey (n=27,534). Detailed information on the design of the survey has been reported previously (2425). Briefly, the information on age, residence area, income, occupation, stress, education, exercise, SRH, smoking history and alcohol intake was collected during the health interview. Obesity was categorized into three groups: lean (BMI <18.5), normal (18.5≤BMI<25), and obese (BMI≥25). Income level was categorized into four quartile groups (1st Q-4th Q). Education level was categorized into three groups: below high school, high school, and college or higher. Smoking status was divided into three categories: current smoker, past smoker and never-smoker. Smoking status was defined based on self-reported cigarette use: never-smokers had smoked fewer than 100 cigarettes in their lifetime, and participants who smoked 100 or more cigarettes were classified as past or current smokers, based on current smoking habits. Alcohol consumption was assessed by asking the participants about their drinking behavior during the month prior to the interview. The responses were converted into the amount of pure alcohol (in grams) consumed per day. Alcohol consumption status was categorized into four groups according to average daily alcohol consumption: nondrinkers, and light (1-15 g), moderate (16-30 g), and heavy (>30 g) drinkers. Regular exercise was defined as exercising on a regular basis for ≥30 min at a time at least five times per week in moderate exercise activities, or for ≥20 min at a time at least three times per week in vigorous exercise activities. Regular walk was specified as walking for ≥30 min at a time at least five times per week. The stress level to be recognized was checked with none, mild, moderate and heavy during the routine daily life.

Self-rated subjective health status

The original SRH questionnaire included five-level categorical variables: 1=very good, 2=good, 3=fair, 4=poor and 5=very poor. For this study, we categorized this variable into three levels: 1=very good or good, 2=fair, and 3=poor or very poor.

Laboratory test

Blood samples were obtained in the morning following an overnight fast. The serum concentrations of glucose, low-density lipoprotein cholesterol (LDL), high-density lipoprotein cholesterol (HDL), triglycerides (TG), aspartate transaminase (AST), and alanine transaminase (ALT) were measured using a Hitachi automatic analyzer 7600 (Tokyo, Japan). Low-density lipoprotein cholesterol (LDL) was calculated using the Friedewald equation [LDL=total cholesterol-HDL (TG/5)] if the TG concentration was not above 400 mg/dL. If the TG concentration was above 400 mg/dL, LDL was measured directly using a Hitachi automatic analyzer 7600.

Dietary assessment method and food grouping

Dietary intake information was collected by administering a validated semi-quantitative food-frequency questionnaire to each participant. This questionnaire requested information regarding the participant's consumption of 63 food items until 2011 KNHANES. Food frequency data were used from 2007-2011 KNHANES. The participant's food intake frequency was quantified using nine categories: "never or seldom," "once a month," "two to three times a month," "one to two times a week," "three to four times a week," "five to six times a week," "once a day," "twice a day," and "three times or more every day." Sixty-three food items were further categorized into 10 subgroups: grain 1 (rice, breads and noodles), grain 2 (cereals, rice cakes and potatoes), legume, meat, fish, vegetable, fruit, milk, sugar, and other.

Assessment of nutrient intake

Dietary intake was collected using the 24-hr recall method. Daily intake of energy and nutrients such as protein, carbohydrates, fat, fiber, total vitamin A, vitamin C, Na, Ca, and K was calculated using the Can-Pro 2.0 nutrient intake assessment software developed by the Korean Nutrition Society. Daily energy, carbohydrate, protein and fat intake were calculated as the percentage of the Korean Dietary Reference Intake (DRI) according to sex and age (Committee of Dietary Reference Intake in Korean Nutrition Society, 2010) (26).

Statistical analysis

Statistical analyses were performed using the SAS software (version 9.4; SAS Institute, Cary, NC, USA) and SUDAAN (Release 11.0; Research Triangle Institute, Research Triangle Park, NC, USA), a software package that incorporates sample weights and adjusts analyses for the complex sample design of the survey. Survey sample weights were used in all analyses to produce estimates that were representative of the non-institutionalized civilian Korean population.
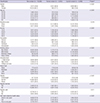
Descriptive statistics of participants according to smoking status were obtained by determining frequency distributions of categorical variables of demographic, lifestyle and stress level, and their statistical significances were analyzed using chi-squared tests.
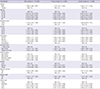
Adjusted odds ratios (ORs) and 95% confidence interval (CI) values for SRH according to smoking status were calculated for demographic, life style variables, and stress level using ordinal logistic regression analysis after covariate adjustment. Covariates were sex, age, residence area, income, occupation, education level, drinking status and physical activities.
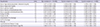
Next, to evaluate the possible association of selected laboratory tests and nutrient intake with SRH, adjusted ORs for SRH were calculated for selected biochemical data and nutrient intake obtained using the 24-hr recall method after covariate adjustment. Furthermore, adjusted means and 95% CI of biochemical data, and food and nutrient intakes according to smoking status were calculated using analysis of covariance (ANCOVA) with the Proc Regress function. The covariates used for adjusted means were gender, age, residence area, income, occupation, drinking status, education, stress level, obesity and physical activity.
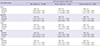
Finally, adjusted ORs for SRH were calculated for selected food intake groups after covariate adjustment. Food intake groups were categorized into three levels: deficient, adequate and excess intake.

Ethnic statement

The study protocol was approved by the institutional review board of the Korean Centers for Disease Control and Prevention (approval nos. 2008-04EXP-01-C, 2009-01CON-03-2C, and 2010-02CON-21-C). Informed consent was exempted by the board.

RESULTS

Significant differences in the frequency distribution were found among most classification variables: Current smokers were associated with lower income and who partake of less exercise, clerical work, more drinking, higher stress levels, and obesity (Table 1). In the subjects with over 60 yr, a greater number of past smokers had better SRH scores than current smokers. However, there were fewer current smokers with poor or very poor SRH scores than non-smokers.
All classification variables were significant predictors of SRH after covariate adjustment, indicating that males with younger age, living in urban areas, higher income, employed in clerical and manual settings, higher education, normal weight, regular physical activity, and low stress levels had higher rates of good or very good SRH scores (Table 2). Surprisingly, no apparent differences in ORs were found in the classification variables according to smoking status. The adjusted OR for SRH was about six fold higher in the no-stress group than the heavy stress group, regardless of smoking status, indicating that stress levels were highly associated with SRH.
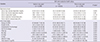
Adjusted ORs and their 95% CI of SRH were calculated after adjusting for covariates according to smoking status (Table 3). In the non-smoker group, with the exception of total energy intake as a recommended percent, all biochemical and nutrient variables were significant predictors for SRH after covariates adjustment. In the past smoker group, only serum glucose levels were significant predictors. On the other hand, in the current smoker group, serum glucose, HDL, AST and ALT levels, fiber intake, and log transformed vitamin C and total vitamin A were significant predictors of SRH.
Of 11 food intake groups, 5 groups (grain 1, vegetable, fruit, milk, and sugar) were significant predictors of SRH according to their food intake level among the three smoking status groups. The non-smoker group had significant ORs regarding adequate intake or adequate/excess intake of vegetables, fruit and sugar (Table 4). The past smoker group had significant ORs in all intake groups, with the exception of grain 1. On the other hand, the current smoker group had significant ORs in the grain 1, vegetable, fruit and milk intake groups (Table 4).
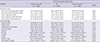
As expected, the mean values of selected biochemical tests differed significantly between the good/very good group and the poor/very poor group. In the non-smoking group, all variables, with the exception of LDL and TG, were significantly different according to SRH (Table 5). In addition, all nutrient intake variables, with the exception of carbohydrate percent intake, had significantly higher values in the good/very good group compared to the poor/very poor group among non-smokers (Table 5). However, in the past-smoker group, the means of only three items (Ca, K, and total vitamin A intake) were significantly different according to SRH (Supplementary 1). In the current smoker group, the means of serum HDL, AST, and ALT levels, daily total energy intake, protein intake as recommended percent, fiber, K, vitamin C and total vitamin A in were significantly different (Table 6).

DISCUSSION

Public health warnings about the adverse effects of smoking have been advocated intensively, but these warnings have been ineffective (612). Such failure may be related to the fact that smokers in Korea have good SRH scores and consider smoking as a compensatory mechanism of relieving stress to maintain good health. Subjects with poor/very poor SRH tend to smoke less than those with very good/good SRH. We investigated the factors that influence current smokers to consider themselves to have good and fair health, and examined which components contributed to their high SRH scores. Our results showed that the proportion of poor SRH scores in current smokers was similar to those in past smokers but lower than those in non-smokers, indicating that current smokers might not believe that smoking endangered their health despite public health warnings. Interestingly, regardless of smoking status, people considered well-known indicators of metabolic diseases (serum HDL, glucose, AST and ALT levels, and intake of food groups of milk, vegetables, grain and total vitamins A and C) as indicators of SRH. Thus, the development of a new indicator that showed the direct adverse effects of smoking might be useful to promote discussion at regular health check-ups.
Previous studies have demonstrated that SRH is affected by several factors, such as gender, education, drinking status, income, exercise, walking and stress levels. These results were mostly consistent with findings reported previously, although previous studies lacked sub-categorization according to smoking status (2728). However, the influence of gender in SRH is inconsistent among the previous studies (17293031). The present study demonstrated that females had lower SRH scores than males. Some studies reported results consistent with ours (29), while others did not (173031). Camelo et al. (30) reported that females had lower SRH scores than males, especially when smoking females were compared with smoking males. The effect of smoking on SRH in various age groups has been also controversial (2832). The present study showed that the number of non-smokers and former smokers with poor SRH was higher than that in smokers, indicating that smoking was not one of the main modulators for determining SRH. The adjusted OR for SRH was highest in participants in their 20s, which decreased significantly in smokers. However, no significant decline was detected until participants reached their 30s and 40s in smokers and former smokers, respectively. Jia et al. (32) reported that smoking did not alter the SRH in Chinese subjects with different ages. No significant associations between smoking status change and SRH were found over time, with the exception of females in their 20s. Quitting smoking was associated with more positive SRH in older age group over time in an Australian longitudinal study (28). These results suggested that the SRH might play an important role in smoking cessation only in the elderly. Accordingly, public health warnings for smoking cessation should be designed differently to target each age category and their SRH relationship to smoking.
SRH in the Korean adult population is affected by biochemical parameters, possibly because people are informed of their biochemical results every 1-2 yr at medical checkups. The present study indicated that the adjusted ORs of SRH were higher in serum HDL and lower in serum glucose, ALT, and AST regardless of smoking status in Korean adults. In the Oslo Health Study, increasing HDL levels were associated with increasing ORs for good SRH; a 1 mM/L increase in HDL elevated the OR for reporting good health by 2.06-2.50 (P<0.001), when adjusting for gender, age group, time since food intake and use of cholesterol-lowering drugs (33). Their SRH result for HDL was considerably higher than that in the present study. We showed that the adjusted OR for good SRH was elevated about 1.07-fold at a 0.26 mM/L increase in HDL regardless of smoking status. Thus, HDL might be a good candidate indicator of SRH. Other biochemical factors have not been investigated as indicators of SRH. However, the present study suggested that not only serum HDL levels but also serum concentrations of glucose, ALT, and AST can be predictors of SRH. Therefore, the biochemical factors, directly and immediately related to smoking status, need to be developed for recognizing smoking as detrimental for their health status.
The SRH is influenced by being underweight or obese (2334). In the present study the adjusted OR was higher in the normal weight than underweight groups regardless of smoking status. Thus, people with a normal BMI had better SRH than did the other BMI groups. As body weight is influenced by energy and nutrient intake, the daily intake may alter SRH. However, few studies have been performed in healthy adults (35). We showed that higher intakes of protein and fat and lower intake of carbohydrates elevated the SRH in non-smokers. Former and current smokers showed a similar relationship as non-smokers, but the differences did not reach significance. Higher intake of fiber, total vitamin A and vitamin C also increased the adjusted OR of SRH in non-smokers and current smokers, but showed no difference among smokers. Consistent with our results, Södergren et al. (35) reported that fruit and vegetable intake was positively associated with self-rated health in Australian older adults. These results suggested that since people considered fruits and vegetables containing total vitamin A and vitamin C as healthy foods, their consumption increased SRH.
To our knowledge, this is the first study to determine the association of SRH with lifestyle, biochemical and nutrient intake parameters according to smoking status in a large representative sample of the Korean population. This study had limitations. First, the results cannot be taken to indicate causality since this was a cross-sectional study. Second, the results may be skewed by under-reporting of negative behaviors and over-reporting of positive behaviors, as all behavior measures were self-reported (36). Third, food intake could be under-reported knowingly or accidentally, despite being determined by trained dieticians.
In conclusions, smoking status did not influence the SRH in a Korean adult population and SRH was affected by serum HDL, glucose, AST and ALT levels, and intake of fiber and total vitamins A and vitamin C. These results indicate that people think good nutrition and good values of biochemical markers can compensate for adverse effects of smoking. Thus, smoking cessation program needs the reasons beyond emphasizing the adverse effects for health. These findings have significant implications for designing tobacco smoking prevention programs for the public. The development of a new direct biochemical parameter would facilitate alteration of the values according to smoking status and sensitivity to SRH. Nutritional education should not empathize that good nutrition attenuates the harmful effect of smoking.

Figures and Tables

Table 1

Distribution of smoking status by classification variables in adult population (n = 27,534) according to 2007-2012 Korea National Health and Nutrition Examination Survey

jkms-30-1279-i001
Classification Non-smoker (n = 16,590) Former smoker (n = 5,454) Current-smoker (n = 5,490) P value*
Gender <0.001
 Male 2,074 (16.8) 4,551 (82.9) 4,608 (86.1)
 Female 14,516 (83.1) 903 (17.1) 882 (13.8)
Age (yr) <0.001
 20-29 1,864 (18.4) 410 (13.0) 789 (21.8)
 30-39 3,321 (20.9) 839 (18.8) 1,358 (27.2)
 40-49 3,312 (23.0) 891 (21.7) 1,175 (23.6)
 50-59 3,135 (17.7) 984 (20.1) 910 (15.3)
 60- 4,958 (19.7) 2,330 (26.2) 1,258 (11.9)
Residence area 0.375
 Urban 12,519 (79.3) 4,113 (80.4) 4,132 (79.4)
 Rural 4,071 (20.6) 1,341 (19.6) 1,358 (20.5)
Income <0.001
 1st Q 3,812 (24.5) 1,195 (22.4) 1,586 (29.8)
 2nd Q 4,041 (24.7) 1,392 (26.7) 1,437 (26.2)
 3rd Q 4,220 (25.8) 1,424 (25.8) 1,217 (23.1)
 4th Q 4,255 (24.9) 1,359 (25.0) 1,158 (20.7)
Occupation <0.001
 Clerical 5,727 (39.4) 1,960 (42.1) 2,296 (45.9)
 Manual 2,809 (13.7) 997 (14.6) 980 (14.1)
 Technical 620 (4.37) 714 (15.8) 949 (19.1)
 Unemployed 7,434 (42.5) 1,783 (27.2) 1,265 (20.6)
Drinking status <0.001
 Non drinker 6,220 (32.9) 1,170 (17.3) 673 (9.62)
 Mild drinker 9,038 (57.5) 2,396 (46.6) 2,138 (40.6)
 Moderate drinker 903 (6.29) 969 (17.5) 1,116 (19.3)
 Heavy drinker 429 (3.16) 919 (18.4) 1,563 (30.4)
Education level <0.001
 <High school 8,849 (46.9) 2,815 (45.5) 2,426 (39.5)
 High school 3,289 (21.4) 1,048 (21.0) 1,335 (25.4)
 College and more 4,452 (31.6) 1,591 (33.4) 1,729 (35.0)
Stress level <0.001
 Heavy 773 (4.57) 179 (3.24) 328 (6.19)
 Moderate 3,682 (22.7) 1,055 (21.0) 1,336 (25.1)
 Little 9,489 (58.4) 3,091 (59.5) 2,997 (56.3)
 None 2,644 (14.2) 1,129 (16.1) 821 (12.3)
Obesity <0.001
 Underweight 817 (5.54) 182 (3.46) 278 (4.48)
 Normal 10,898 (66.0) 3,439 (62.0) 3,450 (60.9)
 Obese 4,875 (28.4) 1,833 (34.5) 1,762 (34.5)
Regular exercise <0.001
 Yes 3,492 (21.2) 1,367 (25.1) 1,262 (23.5)
 No 13,098 (78.7) 4,087 (74.8) 4,228 (76.5)
Regular walk 0.011
 Yes 6,748 (41.1) 2,459 (43.7) 2,335 (42.7)
 No 9,842 (58.8) 2,995 (56.2) 3,155 (57.2)
Self-rated subjective health status <0.001
 Good or very good 6,008 (37.8) 2,176 (40.7) 1,984 (35.9)
 Fair 6,823 (42.4) 2,195 (42.3) 2,447 (47.0)
 Poor or very poor 3,759 (19.7) 1,083 (16.9) 1,059 (16.9)

*P value by Satterwaite chi-square test.

Table 2

Adjusted odds ratio of self-rated subjective health status by demographic and lifestyle variables according to smoking status in the 2007-2012 Korea National Health and Nutrition Examination Survey*

jkms-30-1279-i002
Classification Non-smoker (n = 16,590) Former smoker (n = 5,454) Current-smoker (n = 5,490)
Gender
 Male 1.484 (1.305-1.687) 1.24 (1.011-1.522) 1.422 (1.171-1.726)
 Female Ref (1.0) Ref (1.0) Ref (1.0)
Age (yr)
 20-29 Ref (1.0) Ref (1.0) Ref (1.0)
 30-39 0.824 (0.719-0.944) 0.802 (0.609-1.056) 0.857 (0.707-1.039)
 40-49 0.801 (0.697-0.920) 0.831 (0.625-1.105) 0.798 (0.648-0.981)
 50-59 0.630 (0.539-0.736) 0.684 (0.515-0.910) 0.650 (0.513-0.823)
 60- 0.394 (0.334-0.465) 0.596 (0.445-0.797) 0.506 (0.389-0.657)
Residence area
 Urban 1.123 (1.018-1.238) 1.203 (1.021-1.416) 1.022 (0.878-1.191)
 Rural Ref (1.0) Ref (1.0) Ref (1.0)
Income
 1st Q Ref (1.0) Ref (1.0) Ref (1.0)
 2nd Q 1.167 (1.053-1.292) 1.127 (0.942-1.350) 1.253 (1.065-1.475)
 3rd Q 1.273 (1.148-1.412) 1.158 (0.968-1.386) 1.327 (1.113-1.583)
 4th Q 1.403 (1.259-1.563) 1.544 (1.262-1.890) 1.452 (1.218-1.731)
Occupation
 Clerical 1.209 (1.111-1.315) 1.593 (1.333-1.904) 1.250 (1.036-1.508)
 Manual 1.160 (1.034-1.302) 1.470 (1.179-1.832) 1.316 (1.030-1.683)
 Technical 0.979 (0.805-1.190) 1.879 (1.494-2.362) 1.299 (1.037-1.626)
 Unemployed Ref (1.0) Ref (1.0) Ref (1.0)
Education level
 <High school Ref (1.0) Ref (1.0) Ref (1.0)
 High school 1.232 (1.110-1.367) 1.328 (1.116-1.579) 1.288 (1.099-1.510)
 College and more 1.432 (1.279-1.604) 1.719 (1.426-2.073) 1.315 (1.101-1.570)
Drinking status
 Non drinker Ref (1.0) Ref (1.0) Ref (1.0)
 Mild drinker 1.179 (1.092-1.273) 1.330 (1.108-1.598) 1.306 (1.050-1.624)
 Moderate drinker 1.303 (1.095-1.550) 1.433 (1.168-1.758) 1.318 (1.043-1.666)
 Heavy drinker 1.260 (0.996-1.595) 1.351 (1.093-1.670) 1.193 (0.948-1.500)
Obesity
 Lean Ref (1.0) Ref (1.0) Ref (1.0)
 Normal 1.34 (1.136-1.581) 1.589 (1.074-2.351) 1.379 (1.000-1.901)
 Obese 1.138 (0.950-1.363) 1.461 (0.969-2.203) 1.098 (0.789-1.530)
Regular exercise
 Yes 1.185 (1.076-1.304) 1.24 (1.064-1.445) 1.377 (1.181-1.605)
 No Ref (1.0) Ref (1.0) Ref (1.0)
Regular walk
 Yes 1.234 (1.137-1.340) 1.239 (1.091-1.408) 1.24 (1.091-1.409)
 No Ref (1.0) Ref (1.0) Ref (1.0)
Stress level
 Heavy Ref (1.0) Ref (1.0) Ref (1.0)
 Moderate 1.619 (1.330-1.973) 2.500 (1.645-3.799) 1.750 (1.312-2.333)
 Little 3.451 (2.853-4.174) 3.912 (2.594-5.898) 3.372 (2.593-4.385)
 None 5.908 (4.786-7.293) 6.427 (4.213-9.806) 5.908 (4.331-8.059)

*Adjusted for gender, age, residence area, income, occupation, smoking and drinking status, education, stress level, obesity, and physical activities.

Table 3

Adjusted odds ratio of self-rated subjective health status by selected biochemical data and nutrient intakes in adult subjects according to 2007-2012 Korea National Health and Nutrition Examination Survey*

jkms-30-1279-i003
Classification Units Non-smokers (n = 16,590) Former smokers (n = 5,454) Current smokers (n = 5,490)
Serum high density lipoprotein cholesterol (mg/dL) 10 1.071 (1.039-1.104) 1.050 (0.995-1.108) 1.078 (1.020-1.138)
Serum triglyceride (mg/dL) 10 0.994 (0.989-0.999) 0.996 (0.990-1.002) 0.995 (0.990-1.000)
Serum glucose (mg/dL) 10 0.949 (0.931-0.967) 0.910 (0.883-0.937) 0.930 (0.904-0.956)
Serum alanine aminotransferase (U/L) 10 0.929 (0.888-0.972) 0.978 (0.943-1.015) 0.952 (0.922-0.984)
Serum aspartate aminotransferase (U/L) 10 0.941 (0.903-0.980) 0.978 (0.953-1.004) 0.965 (0.937-0.994)
Energy (% EER) 10 1.015 (0.906-1.138) 0.956 (0.759-1.203) 0.848 (0.699-1.027)
Protein (% RI) 10 1.009 (1.000-1.017) 1.001 (0.983-1.019) 1.006 (0.994-1.018)
Carbohydrate (% of energy) 10 0.945 (0.914-0.977) 0.986 (0.928-1.047) 1.005 (0.956-1.055)
Fat (% of energy) 2 1.017 (1.007-1.026) 1.001 (0.981-1.021) 1.005 (0.988-1.022)
Fiber (g) 2 1.011 (1.003-1.02) 1.003 (0.99-1.016) 1.014 (1.000-1.027)
Log transformed Vitamin C (mg) 1.118 (1.067-1.171) 1.041 (0.952-1.138) 1.157 (1.069-1.253)
Log transformed total Vitamin A (µg RE) 1.062 (1.015-1.110) 1.065 (0.988-1.148) 1.114 (1.036-1.197)

*Adjusted for gender, age, residence area, income, occupation, smoking and drinking status, education, stress level, obesity, and physical activities. EER, energy requirement estimation; RI, recommended intake; RE, retinol equivalent.

Table 4

Adjusted odds ratio of self-rated subjective health status by selected food groups in adult subjects according to 2007-2012 Korea National Health and Nutrition Examination Survey*

jkms-30-1279-i004
Food intake groups Self-rated subjective health status
Non-smokers (n = 16,590) Former smokers (n = 5,454) Current smokers (n = 5,490)
Grain 1
 Deficient Ref (1.0) Ref (1.0) Ref (1.0)
 Adequate 1.065 (0.949-1.195) 1.173 (0.990-1.389) 1.110 (0.950-1.296)
 Excess 1.082 (0.992-1.180) 1.115 (0.969-1.284) 1.227 (1.052-1.431)
Vegetable
 Deficient Ref (1.0) Ref (1.0) Ref (1.0)
 Adequate 1.125 (1.037-1.22) 1.159 (1.011-1.328) 1.266 (1.112-1.443)
 Excess 1.205 (0.974-1.491) 1.205 (0.832-1.745) 1.944 (1.418-2.665)
Fruits
 Deficient Ref (1.0) Ref (1.0) Ref (1.0)
 Adequate 1.153 (1.067-1.246) 1.212 (1.056-1.392) 1.297 (1.129-1.491)
 Excess 1.294 (0.968-1.729) 1.06 (0.572-1.965) 1.419 (0.714-2.820)
Milk
 Deficient Ref (1.0) Ref (1.0) Ref (1.0)
 Adequate 1.057 (0.978-1.142) 1.178 (1.020-1.360) 1.138 (0.993-1.303)
 Excess 0.843 (0.558-1.274) 1.882 (0.739-4.793) 2.26 (1.155-4.424)
Sugar
 Deficient Ref (1.0) Ref (1.0) Ref (1.0)
 Adequate 1.206 (1.112-1.309) 1.169 (1.012-1.350) 0.993 (0.855-1.153)
 Excess 1.305 (1.173-1.452) 1.270 (1.068-1.510) 1.115 (0.956-1.302)

*Adjusted for gender, age, residence area, income, occupation, smoking and drinking status, education, stress level, obesity, and physical activities.

Table 5

Means and 95% confidence intervals of selected biochemical data, blood pressure and selected 24-hr individual food intake by self-rated subjective health status in a non-smoking population after covariate adjustment*

jkms-30-1279-i005
Variables Self-rated subjective health status
Good or very good (n = 6,008) Fair (n = 6,823) Poor or very poor (n = 3,759) P value
Biochemical tests
 Serum high density lipoprotein (mg/dL) 53.97 (53.51-54.42) 53.12 (52.68-53.56) 52.48 (51.88-53.07) 0.003
 Serum low density lipoprotein (mg/dL) 109.7 (108.7-110.7) 112.1 (111.1-113.1) 110.8 (109.3-112.3) 0.08
 Serum triglyceride (mg/dL) 108.1 (105.6-110.6) 112.0 (108.9-115.1) 114.5 (110.9-118.1) 0.119
 Serum aspartate transaminase (U/L) 19.88 (19.59-20.17) 20.59 (20.30-20.88) 20.96 (20.47-21.45) < 0.001
 Serum alanine transaminase (U/L) 17.71 (17.19-18.23) 19.18 (18.74-19.62) 19.78 (18.88-20.68) < 0.001
24 hr food intake
 Energy (% EER) 87.98 (86.77-89.18) 87.61 (86.52-88.71) 86.28 (84.57-87.98) 0.399
 Protein (% RI) 137.2 (134.8-139.7) 135.3 (133.2-137.4) 131.5 (128.5-134.4) 0.008
 Carbohydrate (% of energy) 67.66 (67.26-68.06) 67.94 (67.58-68.31) 68.86 (68.35-69.36) 0.048
 Fat (% of energy) 17.82 (17.54-18.10) 17.74 (17.47-18.01) 16.95 (16.57-17.32) 0.022
 Fiber (g) 7.293 (7.109-7.477) 7.080 (6.901-7.260) 6.802 (6.565-7.038) 0.002
 Na (mg) 4,539.5 (4,440.2-4,638.8) 4,400.1 (4,312.4-4,487.8) 4,297.0 (4,169.5-4,424.6) 0.021
 Ca (mg) 476.4 (465.9-487.0) 476.7 (466.2-487.1) 458.3 (442.4-474.2) 0.045
 K (mg) 2,914.1 (2,864.1-2,964.0) 2,849.3 (2,800.0-2,898.6) 2,765.5 (2,697.1-2,833.8) 0.005
 Vitamin C (mg) 81.36 (79.09-83.69) 78.82 (76.63-81.08) 72.58 (69.76-75.53) 0.002
 Total vitamin A (ug RE) 1,001.2 (970.58-1,032.7) 1,024.4 (992.27-1,057.5) 907.23 (863.67-952.98) 0.032

*Adjusted for gender, age, residence area, income, occupation, smoking and drinking status, education, obesity, and physical activities; P value for Satterwaite chi-square test. EER, energy requirement estimation; RI, recommended intake; RE, retinol equivalent.

Table 6

Means and 95% confidence intervals of selected biochemical data, blood pressure and selected 24-hr individual food intake by self-rated subjective health status in a smoking population after covariate adjustment*

jkms-30-1279-i006
Variables Self-rated subjective health status
Good or very good (n = 1,984) Fair (n = 2,447) Poor or very poor (n = 1,059) P value
Biochemical tests
 Serum high density lipoprotein (mg/dL) 50.23 (49.56-50.90) 48.91 (48.30-49.51) 48.63 (47.69-49.58) 0.002
 Serum low density lipoprotein (mg/dL) 107.1 (105.2-108.9) 107.1 (105.3-109.0) 107.5 (104.8-110.3) 0.967
 Serum triglyceride (mg/dL) 152.3 (145.7-158.9) 161.8 (155.9-167.8) 162.3 (153.6-170.9) 0.067
 Serum aspartate transaminase (U/L) 23.34 (22.69-24.00) 24.71 (23.92-25.50) 24.77 (23.63-25.90) 0.025
 Serum alanine transaminase (U/L) 25.18 (23.90-26.46) 27.19 (26.15-28.22) 27.38 (25.67-29.08) 0.033
24 hr food intake
 Energy (% EER) 100.8 (98.19-103.5) 98.30 (96.15-100.4) 95.18 (91.83-98.54) 0.032
 Protein (% RI) 164.2 (158.7-169.7) 159.7 (154.9-164.5) 150.5 (143.9-157.0) 0.012
 Carbohydrate (% of energy) 60.61 (59.78-61.43) 60.80 (60.13-61.47) 62.03 (60.95-63.12) 0.107
 Fat (% of energy) 18.87 (18.39-19.35) 19.02 (18.62-19.42) 18.05 (17.34-18.76) 0.058
 Fiber (g) 7.965 (7.667-8.262) 7.614 (7.339-7.889) 7.208 (6.788-7.629) 0.017
 Na (mg) 6,064.2 (5,849.1-6,279.3) 5,901.3 (5,727.2-6,075.3) 5,699.0 (5,392.0-6,006.1) 0.151
 Ca (mg) 562.5 (541.4-583.5) 531.8 (514.8-548.7) 524.0 (484.4-563.6) 0.095
 K (mg) 3,434.9 (3,337.4-3,532.4) 3,282.0 (3,196.7-3,367.3) 3,150.0 (3,009.2-3,290.9) 0.003
 Vitamin C (mg) 82.73 (78.83-86.81) 76.20 (73.20-79.33) 72.71 (68.15-77.58) 0.003
 Total vitamin A (µg RE) 1,152.6 (1,094.0-1,214.3) 1,096.0 (1,047.3-1,147.1) 1,013.4 (939.26-1,093.3) 0.025

*Adjusted for gender, age, residence area, income, occupation, smoking and drinking status, education, obesity, and physical activities; P value for Satterwaite chi-square test. EER, energy requirement estimation; RI, recommended intake; RE, retinol equivalent.

Notes

Funding This work was supported by the Soonchunhyang University Research Fund.

DISCLOSURE All the authors declare that there are no conflicts of interest.

AUTHOR CONTRIBUTION Study design: Ahn J, Park S. Data collection and statistical analysis: Lee BK. Writing manuscript: Ahn J, Park S. Final acceptance of manuscript: all authors.

References

1. Centers for Disease Control and Prevention (US). National Center for Chronic Disease Prevention and Health Promotion (US). Office on Smoking and Health (US). Publications and Reports of the Surgeon General. Atlanta (GA): Centers for Disease Control and Prevention (US);2010.
2. Centers for Disease Control and Prevention (CDC). Quitting smoking among adults--United States, 2001-2010. MMWR Morb Mortal Wkly Rep. 2011; 60:1513–1519.
3. Park S, Jee SH, Shin HR, Park EH, Shin A, Jung KW, Hwang SS, Cha ES, Yun YH, Park SK, et al. Attributable fraction of tobacco smoking on cancer using population-based nationwide cancer incidence and mortality data in Korea. BMC Cancer. 2014; 14:406.
4. Shin DW, Cho B, Kim SY, Jung JH, Park JH. Management of cancer survivors in clinical and public health perspectives: current status and future challenges in Korea. J Korean Med Sci. 2013; 28:651–657.
5. Office of the Surgeon General (US). Office on Smoking and Health (US). The health consequences of smoking: a report of the Surgeon General. Atlanta (GA): Centers for Disease Control and Prevention (US);2004.
6. Heydari G, Masjedi M, Ahmady AE, Leischow SJ, Lando HA, Shadmehr MB, Fadaizadeh L. A comparative study on tobacco cessation methods: a quantitative systematic review. Int J Prev Med. 2014; 5:673–678.
7. Ministry of Health and Welfare (KR). Korea Health Promotion Foundation (KR). Health Plan 2020 annual report: the 3rd National Health Promotion Strategy 2011-2020. Seoul: Ministry of Health and Welfare;2013.
8. Smit ES, de Vries H, Hoving C. Determinants of practice nurses' intention to implement a new smoking cessation intervention: the importance of attitude and innovation characteristics. J Adv Nurs. 2013; 69:2665–2674.
9. Paek YJ, Lee S, Kim YH, Lee KS, Yim HW, Kim MS, Kim CH, Jeung O. Effect on smoking quit rate of telling smokers their health risk appraisal in terms of health age: a randomized control trial. Asian Pac J Cancer Prev. 2014; 15:4963–4968.
10. Katanoda K, Jiang Y, Park S, Lim MK, Qiao YL, Inoue M. Tobacco control challenges in East Asia: proposals for change in the world's largest epidemic region. Tob Control. 2014; 23:359–368.
11. Lindström M. Psychosocial work conditions, social capital, and daily smoking: a population based study. Tob Control. 2004; 13:289–295.
12. Kim H, Oh JK, Lim MK, Jeong BY, Yun EH, Park EY. The national "smoking cessation clinics" program in the republic of Korea: socioeconomic status and age matter. Asian Pac J Cancer Prev. 2013; 14:6919–6924.
13. Bush T, Levine MD, Beebe LA, Cerutti B, Deprey M, McAfee T, Boeckman L, Zbikowski S. Addressing weight gain in smoking cessation treatment: a randomized controlled trial. Am J Health Promot. 2012; 27:94–102.
14. Webb TL, Sniehotta FF, Michie S. Using theories of behaviour change to inform interventions for addictive behaviours. Addiction. 2010; 105:1879–1892.
15. Herman KM, Hopman WM, Sabiston CM. Physical activity, screen time and self-rated health and mental health in Canadian adolescents. Prev Med. 2015; 73:112–116.
16. Ryu SY, Park J, Choi SW, Han MA. Associations between socio-demographic characteristics and healthy lifestyles in Korean Adults: the result of the 2010 Community Health Survey. J Prev Med Public Health. 2014; 47:113–123.
17. Schütte S, Chastang JF, Parent-Thirion A, Vermeylen G, Niedhammer I. Social differences in self-reported health among men and women in 31 countries in Europe. Scand J Public Health. 2013; 41:51–57.
18. Giltay EJ, Vollaard AM, Kromhout D. Self-rated health and physician-rated health as independent predictors of mortality in elderly men. Age Ageing. 2012; 41:165–171.
19. Kaplan GA, Camacho T. Perceived health and mortality: a nine-year follow-up of the human population laboratory cohort. Am J Epidemiol. 1983; 117:292–304.
20. Strawbridge WJ, Wallhagen MI. Self-rated health and mortality over three decades results from a time-dependent covariate analysis. Res Aging. 1999; 21:402–416.
21. Miilunpalo S, Vuori I, Oja P, Pasanen M, Urponen H. Self-rated health status as a health measure: the predictive value of self-reported health status on the use of physician services and on mortality in the working-age population. J Clin Epidemiol. 1997; 50:517–528.
22. McClave AK, Dube SR, Strine TW, Mokdad AH. Associations between health-related quality of life and smoking status among a large sample of U.S. adults. Prev Med. 2009; 48:173–179.
23. Yamada C, Moriyama K, Takahashi E. Self-rated health as a comprehensive indicator of lifestyle-related health status. Environ Health Prev Med. 2012; 17:457–462.
24. Kim Y, Lee BK. Iron deficiency increases blood manganese level in the Korean general population according to KNHANES 2008. Neurotoxicology. 2011; 32:247–254.
25. Park S, Lee BK. Body fat percentage and hemoglobin levels are related to blood lead, cadmium, and mercury concentrations in a Korean Adult Population (KNHANES 2008-2010). Biol Trace Elem Res. 2013; 151:315–323.
26. The Korean Nutrition Society. Dietary reference intake for Koreans. Seoul: The Korean Nutrition Society;2010.
27. Hämmig O, Gutzwiller F, Kawachi I. The contribution of lifestyle and work factors to social inequalities in self-rated health among the employed population in Switzerland. Soc Sci Med. 2014; 121:74–84.
28. Sargent-Cox K, Cherbuin N, Morris L, Butterworth P, Anstey KJ. The effect of health behavior change on self-rated health across the adult life course: a longitudinal cohort study. Prev Med. 2014; 58:75–80.
29. Shin HY, Shin MH, Rhee JA. Gender differences in the association between self-rated health and hypertension in a Korean adult population. BMC Public Health. 2012; 12:135.
30. Camelo Ldo V, Giatti L, Barreto SM. Subjective social status, self-rated health and tobacco smoking: Brazilian Longitudinal Study of Adult Health (ELSA-Brasil). J Health Psychol. 2014; 19:1388–1399.
31. Rohlfsen LS, Jacobs Kronenfeld J. Gender differences in trajectories of self-rated health in middle and old age: an examination of differential exposure and differential vulnerability. J Aging Health. 2014; 26:637–662.
32. Jia Y, Gao J, Dai J, Zheng P, Wu X, Li G, Fu H. Difference of the associations between self-rated health and demographic characteristics, lifestyle, and psychosocial work environment between two types of Chinese worksite. BMC Public Health. 2014; 14:851.
33. Tomten SE, Høstmark AT. Self-rated health showed a consistent association with serum HDL-cholesterol in the cross-sectional Oslo Health Study. Int J Med Sci. 2007; 4:278–287.
34. Månsson NO, Merlo J. The relation between self-rated health, socioeconomic status, body mass index and disability pension among middle-aged men. Eur J Epidemiol. 2001; 17:65–69.
35. Södergren M, McNaughton SA, Salmon J, Ball K, Crawford DA. Associations between fruit and vegetable intake, leisure-time physical activity, sitting time and self-rated health among older adults: cross-sectional data from the WELL study. BMC Public Health. 2012; 12:551.
36. van de Mortel TF. Faking it: social desirability response bias in self-report research. Aust J Adv Nurs. 2008; 25:40–48.

Supplementary Material

Supplement Table 1

Means and 95% confidence intervals of selected biochemical data, blood pressure and selected 24-hr individual food intake by self-rated subjective health status in a former-smoking population after covariate adjustment*
TOOLS
ORCID iDs

Sunmin Park
https://orcid.org/http://orcid.org/0000-0002-6092-8340

Jaeouk Ahn
https://orcid.org/http://orcid.org/0000-0002-8870-1527

Byung-Kook Lee
https://orcid.org/http://orcid.org/0000-0001-9162-3390

Similar articles