

 PDF
PDF ePub
ePub Citation
 Print
Print


INTRODUCTION
Epilepsy is a chronic disorder characterized by spontaneous recurrent seizures (SRS). Currently, there is no effective treatment that prevents or restrains the development or progression of this condition. Medial temporal lobe epilepsy (MTLE) is a possible clinical target for stem cell-based therapies that suppress or restrain the progression of chronic epilepsy (1). Self-renewing neural stem cells can differentiate into neurons and glial cells, which can repair damaged neuronal tissue and form functional neuronal circuitry. A recent study reported that human fetal-derived neural stem cells that are transplanted into injured hippocampus can differentiate into gamma-aminobutyric acid (GABA)-synthesizing cells, thereby reducing seizure frequency in a pilocarpine model of MTLE (2). Human umbilical cord blood-derived mesenchymal stem cells (hUCB-MSCs) demonstrate many advantages over embryonic and adult stem cells: they are less ethically controversial (with few legal constraints) and easy to collect using noninvasive procedures. Many studies suggest that hUCB-MSCs can differentiate into neural cells and may demonstrate neurotrophic effects and therapeutic potential against neurological disease (3).
hUCB-MSCs transplantation may be used to treat medically resistant MTLE that cannot be surgically treated. The ability to restore function is highly desirable from a clinical standpoint, but chronically damaged areas of the brain may be a particularly hostile environment for engrafted cells. It remains unknown if stem cell transplantation benefits chronic epilepsy models with established epileptogenic circuitry. Thus, assessment of the practical applications and therapeutic potential of stem cell transplantation in an established model of chronic epilepsy (as opposed to the acute period after status epilepticus [SE]) are needed.
Evaluating longitudinal functional and molecular changes can help understand serial changes in disease pathogenesis and assess treatment efficacy in neurologic conditions, including epilepsy (45678). Unlike postmortem analyses, where observations are limited to specific time points following insult, 18F-fluorodeoxyglucose positron emission tomography (FDG PET) can be used to monitor in vivo glucose metabolism and assess brain processing over time, including those related to epileptogenesis (8). Assessing hippocampal glucose metabolism before and after treatment may help predict the therapeutic efficacy of hUCB-MSCs transplantation (9).
The aim of this study was to evaluate hippocampal glucose metabolism after hUCB-MSCs transplantation using serial FDG PET monitoring in a lithium-pilocarpine model of chronic epilepsy. We also assessed any correlations of hUCB-MSCs transplantation with histopathology and clinical improvement.
MATERIALS AND METHODS
Epilepsy model and experimental design
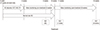
Experimental design is illustrated in Fig. 1. Male Sprague Dawley rats (10 weeks old; approximately 300 g) were housed under standard laboratory conditions (22-24℃; 12-hr light/dark cycle). Lithium-pilocarpine was used to induce SE, as previously described (8). Ten weeks after the induction of SE, rats with SRS were randomly assigned to three groups: the stem cell treatment (SCT) group received hUCB-MSCs transplantation (n=8); the sham control (ShC) group received sham surgery and the same amount of phosphate-buffered saline (PBS) instead of hUCB-MSCs transplantation (n=9); and the positive control (PC) group consisted of treatment-naïve post-SE rats (n=9). In addition, 20-week-old normal rats did not undergo SE but did receive hUCB-MSCs transplantation and acted as the negative control (NC) group (n=7).
The SCT and NC groups received hUCB-MSCs transplantation using a stereotaxic apparatus and syringe pump (Nanomite; Harvard Apparatus, Miami, FL, USA). hUCB-MSCs suspensions (5×10⁵/2 µL) were injected over a period of 5 min using a 5-µL Hamilton syringe (Hamilton company, Reno, NV, USA) that was placed in the right hippocampus (coordinates: AP -4.3 mm; L -3.5 mm; depth -4.0 mm). The same procedure was performed on the ShC group using an equal amount of PBS. The infused volume was 2 µL, and the rate of infusion was 0.5 µL/min. The PC group received neither stem cell transplantation nor surgery. Aseptic techniques were strictly followed during all animal experiments. The rats were maintained under postoperative care for 1 week and did not receive any immunosuppressant.
Extract preparation and hUCB-MSCs transplantation
hUCB samples were obtained from the Seoul City Borame Hospital Cord Blood Bank (Seoul, Korea) and cultured, as previously described (10), with the approval of the Borame Hospital Institutional Board and Seoul National University (Seoul, Korea) (IRB No. 0603/001-002-07C1). To track the injected hUCB-MSCs, the cells were labeled with PKH-26, a lipophilic marker that is taken up by viable cell membranes (11). This marker allowed us to identify transplanted cells in the SCT and NC groups after sacrifice.
PET imaging
Food was withdrawn 20 hr before scanning so the PET data would be acquired under controlled metabolic conditions. Rats were anesthetized with 1.5%-2% isoflurane in air (2 L/min) for 20 min before administering an intravenous injection of 18F-FDG (37 MBq/rat) into the tail vein; 1.5%-2% isoflurane was maintained until the end of PET acquisition. PET scans were performed as described in our previous paper (8). We did not conduct PET on the scheduled imaging day if the rats exhibited definite clinical seizures. In this situation, animals were imaged at least 2-3 days later.
All animals were scanned using FDG PET at three time points (Fig. 1): 1) 8-week post-SE for the SCT, ShC, and PC groups, or 18 weeks for the NC group, for use as baseline; 2) 1-week posttransplantation in the SCT, NC, and ShC groups, or 11 weeks post-SE for the PC group; and 3) 8-week posttransplantation in the SCT, NC, and ShC groups, or 18 weeks post-SE for the PC group.
Region of interest analysis
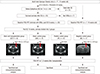
Regions of interest (ROIs) were defined on the reconstructed images in order to estimate regional 18F-FDG uptake. We manually defined ROIs in two specific regions (bilateral hippocampus and pons; Fig. 2) using a rat brain atlas-based MRI template (12) and MRIcro (Neuropsycology Lab, Columbia, SC, USA). Defining ROIs was done as explained in our previous work (8). Three investigators collaborated to define ROIs accurately; all included ROIs were determined by consensus. We laid the ROI template onto each normalized PET image and reconfirmed visually that the PET image corresponded to the anatomical locations on the template. This was performed in a manner so that the investigators were blind to all groups, including the treatment groups. We only evaluated ROIs in the bilateral hippocampi, which is the most important epileptic zone in MTLE. We also performed a subanalysis of the ROI results to ensure comparability between unilateral and bilateral ROI data.
FDG PET images were normalized to the administered radioactive dose. We calculated the concentration of a radioactive tracer in a given region with the percent injected dose per milliliter (%ID/mL). It is a useful semiquantitative measurement using the following equation: %ID/mL=mean tissue concentration (MBq/mL)/injected dose (MBq)×100%. The metabolic rate of glucose in the hippocampus was normalized to the pons glucose and is reported as the mean±standard error of the mean (SEM). Because the metabolic rate of pons is unaffected by lithium-pilocarpine induced seizures, it was chosen for normalization (813141516). We analyzed the metabolic rate in the pons in each the four groups and confirmed no significant differences (data not shown). Due to individual variability in baseline glucose metabolism, changes between the three time points are expressed as the relative percent change compared with hippocampal baseline (100%): (changesx-baseline=[glucose metabolic ratex-glucose metabolic ratebaseline]/glucose metabolic ratebaseline ×100) (x=1- or 8-week posttreatment).
MRI acquisition
MRI acquisition was performed as described in our previous study (8). The MRI and PET studies were performed on the SCT, ShC, and PC groups at the same time.
Hippocampal volume analysis
We performed hippocampal volume analyses of the SCT, ShC, and PC groups at different time points in order to exclude partial volume effects. Volume analysis was performed using ImageJ software (freeware version 1.44, developed by Wayne Rasband, NIH; http://rsb.info.nih.gov/ij). Volumetric analysis was performed on three coronal slices at the level of the cingulate cortex, dorsal hippocampus, and ventral hippocampus (Fig. 2). Volume was estimated using the following formula: hippocampal volume=sum of the hippocampal area of each slice×1.5 mm (slice thickness). Hippocampal volume (µL) is expressed as the mean±SEM.
SRS monitoring
Between 4-week post-SE and 8-week posttransplantation (or 18-week post-SE), the surviving rats were monitored with a video recorder (6 hr/day, 3 days/week) to assess SRS. An illustration of the monitoring period is shown in Fig. 3. Only rats in the SCT, ShC, and PC groups with ≥2 SRS after the latent period or before transplantation were included in this experiment. Since we only evaluate the SRS with video recording, only stage 4 or 5 convulsive seizures according to the Racine's scale were evaluated in our study. We evaluated the frequency of SRS. We compared seizure status in the pretreatment (4-10-week post-SE) and posttreatment periods (0-8-week posttreatment) in the SCT, ShC, and PC groups.
Histopathology
After performing FDG PET at 8-week posttransplantation, the SCT and NC animals were anesthetized with a mixture of ketamine-xylazine and the left heart ventricle was perfused with 4% freshly prepared paraformaldehyde. Rats in the PC groups were also sacrificed at 18-week post-SE using the same method. Brains were removed and postfixed for a day in the same fixative at 4℃, and the tissues were separated for immunohistochemical processing. Brains were cryoprotected in 30% sucrose for another 48 hr in order to assess neuronal differentiation (n=3; SCT and NC groups). Immunohistochemistry was performed using primary antibodies for antimicrotubule-associated protein 2 (MAP2) and antiglial fibrillary acidic protein (GFAP) (Millipore, Billerica, MA, USA) (10). The sections were extensively washed with PBS and incubated for 1 hr with anti-mouse or anti-rabbit secondary antibodies that were conjugated with Alexa Fluor 488 or 594 (Molecular Probes, Eugene, OR, USA), followed by Hoechst 33238 (1 µg/mL; Sigma-Aldrich, St. Louis, MO, USA) or DAPI staining (10 µg/mL; Invitrogen, Carlsbad, CA, USA) in order to visualize cell nuclei. A confocal microscope (Eclipse TE200; Nikon, Tokyo, Japan) was used to capture all images.
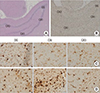
To evaluate inflammatory changes in the hippocampus, tissues were embedded with paraffin, cut into 3-µm-thick sections, and mounted on glass slides (n=4; SCT and PC groups). An automated slide preparation system (Benchmark XT; Ventana Medical systems Inc, Tucson, AZ, USA) was used for immunohistochemistry. Deparaffinization, epitope retrieval, and immunostaining were performed using cell conditioning solution (CC1) and the BMK ultraVIEW diaminobenzidine (DAB) detection system (Ventana Medical Systems) according to the manufacturer's instructions. Microglial cells were stained with rabbit anti-Iba1 (1:200; Wako, Osaka, Japan) and ultra-VIEW copper amplified the positive signals. Sections were counterstained with bluing reagent and hematoxylin. To estimate the number of Iba1-expressing microglial cells, images of the ventral hippocampus were captured using an Olympus BX53 microscope and cell sens standard program (Tokyo, Japan). Iba1-expressing microglial cells were counted in two areas in each of the three ROIs within the hippocampus including dendrite gyrus (DG), CA1, and CA3 (400× magnification). Entirely contained cells within each section were counted to avoid double counting within consecutive sections. Two blind observers quantified the microglial cells.
Statistical analysis
Numerical data are presented as the mean±SEM. The paired t-test, repeated-measures ANOVA, Kruskal-Wallis test, and Wilcoxon signed-rank tests were performed using SPSS (version 18.0; SPSS, Inc., Chicago, IL, USA). The level of statistical significance was set at P<0.05. A linear mixed-effect model (SAS 9.1; SAS Institute Inc., Cary, NC, USA) was used to accommodate within- and between-subject sources of variation.
Ethics statement
All experimental procedures were performed in accordance with the National Institutes of Health (NIH) Guidelines for the care and use of laboratory animals. The study protocol was approved by institute animal care and use committee of Asan Medical Center Research Authority, Seoul, Korea (IACUC; 2009-03-015).
RESULTS
Glucose metabolism
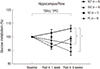
Hippocampal glucose metabolism was normalized to the pons. Comparisons of glucose metabolism are provided in Table 1 and Fig. 4. Hippocampal glucose metabolism was significantly different at 8-week posttreatment between the four groups. Glucose metabolism at 8-week posttreatment was significantly higher in the SCT group (0.990±0.032) than the ShC (0.873± 0.087; P<0.001) and PC groups (0.858±0.093; P<0.001), but hippocampal glucose metabolism in the SCT group was not restored to NC baseline (1.109±0.021), even by 8-week posttreatment (1.094±0.013). The SCT group demonstrated a gradual increase in glucose metabolism compared with baseline, but this finding was not statistically significant. However, the ShC and PC groups demonstrated markedly decreased glucose metabolism at 8-week posttreatment (P=0.04 and 0.01, respectively). Glucose metabolism in the NC group decreased by 1-week posttransplantation, but recovered to baseline by 8-week posttreatment. However, the NC group did not demonstrate increased glucose metabolism at 8-week posttreatment compared with baseline, in contrast to the SCT group (Fig. 4 and Table 1). In addition, unilateral changes in glucose metabolism in the hippocampus were similar to the bilateral results at each time point, and there was no significant difference between the ipsilateral (injected side) and contralateral sides (data not shown).
Hippocampal volume
Hippocampal volume was assessed at each time point (Table 2). There were no significant differences between the groups at any time point.
Survival and distribution of grafted MSC
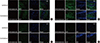
Rats in the SCT and NC groups were assessed using histological examination. The location and appearance of the PKH26-labeled cells were evaluated to determine the viability and differentiation potential of transplanted hUCB-MSCs. PKH26-labeled hUCB-MSCs were observed in the ipsilateral and contralateral hippocampus in the SCT and NC groups, but they did not differentiate into neuronal cells or glial cells in either group (Fig. 5).
Quantification of microglial activation
To evaluate inflammatory effects, Iba1-labeled microglial cells in the SCT and PC groups were counted in bilateral hippocampi (Fig. 6). In total, 204.3±36.95 and 221±40.8 Iba1-labeled microglial cells were counted in the bilateral hippocampi of the SCT and PC groups, respectively, but this difference is not statistically significant. The number of Iba1-labeled microglial cells was not statistically different between the left and right sides in each group.
Behavioral changes and seizure frequency
Sixty-four rats were treated with pilocarpine and developed SE. Of these, 33 survived (51.6%) to 10-week post-SE and SRS developed in 26 of 33 animals (78.8%) within 41±6.3 days (range: 36-49 days). We monitored 26 rats using a video recorder for 14 weeks (4-18-week post-SE or 8-week posttreatment). Seizure frequencies demonstrated no significant differences between pre- and post-treatment across all three groups (P=0.88; Table 3). In addition, our subanalysis of the SCT, ShC, and PC group demonstrated no significant difference between pre- and post-treatment (P=0.67, 0.44, and 0.59, respectively).
DISCUSSION
We here evaluate the therapeutic potential of hUCB-MSCs transplantation in a lithium-pilocarpine rat model of chronic epilepsy and assess in vivo functional efficacy using longitudinal PET imaging. To our knowledge, this is the first study to compare longitudinal metabolic changes following hUCBs-MSCs transplantation in a clinically relevant model of chronic epilepsy. Bilateral hippocampal glucose metabolism increased in the SCT group by 8-week posttransplantation compared with baseline, but this level never recovered to the baseline of the NC group; hippocampal glucose metabolism at 8-week posttreatment decreased in the ShC and PC groups compared with baseline. Histological examination revealed that the transplanted hUCB-MSCs in the SCT group survived in the ipsilateral and contralateral hippocampi but did not differentiate. These findings suggest that transplanted hUCB-MSCs can migrate to the damaged hippocampus and partially restore bilateral hippocampal glucose metabolism, but the engrafted hUCB-MSCs did not restore epileptogenic circuitry or alter the clinical course.
Our current study data show that hUCB-MSCs demonstrate powerful migratory activities, moving from the primary implantation site to the contralateral hippocampus in both the chronic epilepsy model and normal rats, despite the fact that the chronic epilepsy model is supposedly a hostile environment for stem cell survival and proliferation. The therapeutic efficacy of transplantation has been reported in the acute period within days or weeks after SE (17). Acute injury may transiently stimulate the release of tropic factors and chemokines that promote survival, migration, and the integration of transplanted stem cells. In contrast, the low survival rate of these transplanted cells in chronic epilepsy models has generally been attributed to the low concentration of trophic factors and decreased vascularity of damaged tissue. Here, we performed hUCB-MSCs transplantation on chronic epileptic rats at 10-week post-SE, demonstrating that hUCB-MSCs engraftment is feasible.
Hippocampal glucose metabolism in the SCT group remained stable for at least 8-week posttransplantation in comparison with baseline, whereas hippocampal glucose in the ShC and PC groups gradually decreased or remained unchanged in the NC group compared with baseline. These findings suggest that stem cell transplantation plays a critical role in preventing progressive hypometabolism. Although we did not demonstrate complete functional recovery or clinical improvement, preserved glucose uptake in bilateral hippocampi indicates long-term stem cell survival, possibly due to neurotrophic factors that are secreted from these cells and mitigate the effects of progressive hypometabolism. This effect was not due to changes in hippocampal volume, which was not significantly different at any time point. Therefore, differences in hippocampal metabolism cannot be explained by differences in hippocampal volume between groups.
It could be argued that increased glucose metabolism in the SCT group resulted from the inflammatory effects of the hUCB-MSCs or surgical manipulation. It is well known that FDG PET can demonstrate false-positive uptake in the presence of inflammation. A previous study reported that high glucose metabolism at 7-day postischemia on FDG PET is caused by inflammation, including microglial cell activation. However, glucose metabolism decreased in the ShC group, whereas glucose metabolism was maintained or slightly increased at 8-week posttreatment in the SCT group, which suggests that this result cannot be attributed to surgical manipulation. In addition, increased glucose metabolism at 8-week posttransplantation was greater than at 1-week posttransplantation in the SCT group, which cannot be explained by the acute inflammatory effects of SCT or surgical manipulation. Furthermore, immunohistochemical staining in the present study indicates no difference in the number of microglial cells in the hippocampus between the SCT and PC groups. Therefore, the inflammatory effects of surgery and hUCB-MSCs cannot explain increased glucose metabolism compared with baseline in the SCT group.
The most probable explanation of increased glucose metabolism compared with baseline in the SCT group is the positive metabolic effects of hUCB-MSCs. In the PC group, the decrease in glucose metabolism observed at 18-week post-SE (equivalent to 8-week posttreatment) may have been due to the progression of epileptogenesis, even though there were no statistically significant differences in seizure frequency compared with baseline. This is supported by the fact that the decrease in hippocampal glucose metabolism progressively expanded to the entire limbic area during the chronic period (8-week post-SE), which suggests that glucose metabolism decreases in chronic epileptogenesis (8). Hypometabolism may be associated with tissue degeneration and cell loss in those areas, or it may occur independent of hippocampal volume loss (181920). However, it is well known that hippocampal hypometabolism in epilepsy is correlated with epileptic networks, including epileptic foci (21222324), and decreases in hypometabolic areas have been observed in patients with decreased seizure frequency (2526). In the present study, we only evaluated hippocampal glucose metabolism because the hippocampus is the area of the brain that most commonly generates epileptic seizures in MTLE. Thus, in the present study, the maintenance of glucose metabolism in the SCT group in contrast to progressive hypometabolism in ShC and PC groups imply that hUCB-MSCs may affect epileptic networks, even though differences in the seizure frequency were not statistically significant.
Therapeutic stem cell transplantation replaces damaged cells and provides a better microenvironment for endogenous cells by providing paracrine effects (10). Therefore, it is possible to protect against inflammatory damage in order to repair or rebuild host networks and circuits (2728). In our current analyses, hUCB-MSCs migrated to the contralateral hippocampus where they remained undifferentiated. Although transplanted hUCB-MSCs did not differentiate into specific neuronal cell types, they did affect the maintenance of glucose metabolism. However, we could not identify the factors produced by hUCB-MSCs that allow maintenance or increase glucose metabolism, or determine if novel synaptic formation or neuronal circuitry were integrated into the adjacent brain tissue. Further studies are needed to answer these questions.
Some researchers argue that isoflurane affects the cerebral uptake of FDG. However, several studies on PET imaging have been performed using isoflurane anesthesia (82029). Here, we compared the results of PET scanning between the 4 groups, which were taken using the same conditions of isoflurane anesthesia, and used the pons as the standard for normalization in each rat because the metabolic rate of the pons is unaffected by pilocarpine-induced seizures (13141516). Thus, we believe our comparisons are reasonable, even though isoflurane anesthesia may have hampered FDG uptake.
This study has several limitations. First, the intravenous induction of SE results in widespread brain damage, which creates a poor microenvironment for hUCB-MSCs. In future studies, it may be more efficient to use a focal epilepsy model to assess improvements following hUCB-MSCs transplantation. Second, we did not perform electroencephalography (EEG) monitoring with implanted electrodes to evaluate seizure frequency because implanted electrodes make it impossible to perform MRI and may affect PET metabolism. Seizure frequency and severity were evaluated by video recording thus the mild electrographic or clinical seizures could be overlooked in the present study. Third, although we performed follow-up examinations at 8-week posttransplantation, we still need to assess the long-term effects of hUCB-MSCs transplantation. Finally, we could not identify the exact reason or factors that preserved or increased glucose metabolism after stem cell transplantation. The secretion of neurotrophic factors by hUCB-MSCs was not confirmed in this in vivo study. We think that revealing these issues are another important subject for further study.
In conclusion, this study demonstrated that hUCB-MSCs that were injected into the hippocampus of rats with chronic epilepsy would engraft, survive, and appeared to maintain hippocampal glucose metabolism. These results suggest the possible promising effects of hUCB-MSCs on epileptic networks, even though they did not restore epileptogenic circuitry or alter the clinical course in the present experiments.


 XML Download