

 PDF
PDF ePub
ePub Citation
 Print
Print


INTRODUCTION
Neuropathic pain is defined as pain resulting from damage or dysfunction of peripheral nerves and as a result of injury or disease of the somatosensory system. Many drugs such as opioids, anticonvulsants, and antidepressants offer relatively effective relief from neuropathic pain (12345).
Nefopam has been used to control postoperative pain since 1976, and several animal and human clinical studies demonstrate its analgesic activity. It has also been demonstrated to induce a rapid and strong depression of the nociceptive flexion reflex in humans (6). In a study conducted using a rat model, Nefopam showed a pre-emptive analgesic effect on chronic constriction injury (CCI) of the sciatic nerve, which involves the activation of N-methyl-D-aspartate (NMDA) receptors (7). Recently, nefopam is suspected to induce analgesia using a mechanism similar to those of triple-receptor (serotonin, norepinephrine, and dopamine) reuptake inhibitors (8). Thus, it may prove beneficial in treating neuropathic pain, in addition to its effect on nociceptive pain. However, few studies investigate the efficacy of nefopam in alleviating neuropathic pain.
Unilateral ligation of the fifth and sixth lumbar spinal nerves in rats produces signs that are representative of neuropathic pain, including mechanical allodynia, hyperalgesia, and spontaneous pain (9). The procedure causes a significant increase in transcription factors' mitogen-activated protein (MAP) kinase such as extracellular signal-regulated kinase 1/2 (ERK 1/2), and cyclic AMP response element binding (CREB) and activation of spinal glial cells, which are molecular indicators of allodynia (101112).
Therefore, the present study evaluates the efficacy of intrathecal nefopam in attenuating mechanical allodynia and characterizes its mechanism of action in a spinal nerve ligation (SNL) rat model. We conducted immunohistochemistry targeting cluster of differentiation molecule 11b (CD11b) and glial fibrillary acidic protein (GFAP) which are molecular indicators of microglial and astrocytic activation and assessed by western blot analysis using ERK 1/2 and CREB in a SNL rat model.
MATERIALS AND METHODS
Animals
Twenty-eight male Sprague-Dawley rats, initially weighing 150-250 g, were used. Two rats per cage were housed under standard laboratory conditions under controlled room temperature (23±2℃), humidity (55%±5%), and a 12-h light/dark cycle. Rats had free access to food and water. Body weight was recorded on each experimental day. Rats were divided randomly into 4 experimental groups: sham surgery group (S group, n=7), intrathecal normal saline group (C group, n=7), intrathecal nefopam (10 µg/kg) group (N10 group, n=7), and intrathecal nefopam (100 µg/kg) group (N100 group, n=7).
Fifth lumbar (L5) spinal nerve ligation and intrathecal catheter implantation
All surgical procedures were performed under inhalational anesthesia with isoflurane in 100% oxygen, induced at 2 vol% and maintained at 1.5 vol%. Rats were anesthetized and placed on a surgical apparatus in a prone position. A dorsal midline incision was performed, the left paraspinal muscles were separated from the spinous processes at L4-S1, and the left L5 transverse process was removed. The left L5 spinal nerves were identified and tightly ligated with a 6-0 silk suture, except in the S group rats, which did not have. Then, the incision was closed. After a 7-day postoperative period, rats in the C, N10, and N100 groups were implanted under anesthesia with a sterilized 32-gauge polyethylene intrathecal catheter (CR3212 Cth RSR 32G, RecathCo, LLC, Allison Park, PA, USA) connected to an 8.5 cm Tygon external tubing (Saint-Gobain Performance Plastics, Akron, OH, USA). The catheter was inserted at the cisterna magna, pushed caudally to the spinal cord lumbar enlargement, and finally externalized through the skin. Proper location of the catheter was confirmed by inducing a temporary motor block of both hind-limbs after injection of 2% lidocaine 5 µL, followed by saline. Only rats that showed no evidence of neurologic deficit or paralysis after surgery and lidocaine injection were studied. All rats of 4 experimental groups were showed no evidence of neurologic deficit or paralysis.
Drug administration
Nefopam and normal saline were both injected intrathecally every day for 14 days after intrathecal catheter implantation. In group N10 or N100, nefopam was dissolved in normal saline to a concentration of either 10 or 100 µg/kg, and 5 µL was injected, followed by a 10 µL normal saline injection to flush the catheter. In group C, 5 µL of normal saline injected and followed 10 µL normal saline injection to flush the catheter.
Behavioral assessments
All rats were allowed about 10 min of adaptation time in the transparent acrylic box under the wire mesh bench. Withdrawal threshold to hind-paw pressure was measured using a dynamic plantar aesthesiometer (Ugo Basile, Comerio, Italy) and expressed in grams. A metal filament (0.5-mm diameter) was pushed against the hind paw with increasing force, from 0 to 50 g over a 10 s period. When the rat withdrew its hind paw, the mechanical stimulus stopped automatically, and the force was recorded to the nearest 0.1 g. A maximal cut-off value of 50 g was set to prevent tissue injury. Withdrawal responses were averaged from four non-consecutive trials at 10-s intervals, and each paw withdrawal threshold was averaged from four measurements. Each animal was trained for this test for 3 days prior to spinal nerve ligation. On day 1 after intrathecal catheter implantation, the time course of withdrawal threshold after first intrathecal injection of nefopam was recorded at 30-min intervals until reaching 180 min. Before intrathecal injection of nefopam, the change in withdrawal threshold was recorded before SNL (Initial), on day 3 after SNL (Post-SNL), on day 1 after surgical intrathecal catheter implantation (Post-ICI), and on days 7 and 14 after intrathecal injection of nefopam every day (Day-7 and Day-14) (Fig. 1).
Immunohistochemistry
After behavioral assessments were finished, all rats of the four experimental groups were sacrificed for immunohistochemistry.
In the present study, monoclonal antibodies targeting CD11b (ab52478, Abcam plc., Cambridge, MA, USA) and GFAP (ab7260, Abcam plc., Cambridge, MA, USA) were used as primary antibodies. These were used at a dilution ratio of 1:2,000 and 1:5,000, respectively. Biotinylated anti-mouse and anti-rabbit immunoglobulin were used as secondary antibodies.
The rats were deeply anesthetized with sodium pentobarbital (50 mg/kg, intraperitoneal) and intracardially administered 20 mL of potassium-free phosphate-buffered saline (K+-free PBS; pH 7.4), followed by 50 mL of 4% paraformaldehyde solution. The L5 spinal cord region was harvested, sectioned, fixed for 3 hr in paraformaldehyde, and cryo-protected overnight in 25% sucrose dissolved in 0.01 M phosphate-buffered saline (pH 7.4). The tissues were fast-frozen in cryo-embedding compound on a mixture of ethanol and dry ice and stored at -80℃.
The preserved tissues were cut transversely at 10-µm thick on a freezing microtome, thaw-mounted onto silane-coated glass slides, and air-dried overnight at room temperature. Slides were incubated overnight at 4℃ in PBS-diluted primary antibodies against CD11b and GFAP. Then, the slides were incubated in PBS-diluted secondary antibodies (biotinylated anti-mouse IgG, goat anti-rabbit IgG, 1:100) for 2 hr at room temperature and washed with PBS. The slides were exposed to avidin-biotin peroxidase complex for 1 hr at room temperature, washed with PBS, and stained with 0.05% 3, 3-diaminobenzidine tetrahydrochloride (Sigma Chemical Co., St. Louis, OK, USA). The tissue sections were posted on gelatin coated slides, and dried for 2 hr at room temperature. The slides were then washed with distilled water for 10 min, dehydrated with alcohol, and rinsed with xylene.
Glial responses were assessed in three randomly chosen L5 spinal cord segments. The specimens were examined with an optical microscope, and the appearance and fluorescence intensities of glial cells in the spinal dorsal horn (lamina I-III) were assessed. The same spinal area was also photographed with a digital camera attached to the microscope set at 40× magnification. The images were calibrated using Adobe Photoshop 5.0 (Adobe Systems Incorporated, USA), and the relative mean optical density was measured in the spinal cord dorsal horn. The data were expressed as the relative mean optical density (MOD) and calculated by the following method (13):
Relative mean optical density ratio=corrected MOD of left gray horn/corrected MOD of right gray horn (corrected MOD =MOD of area of interest-MOD of background).
Western blot analysis
All rats of the four experimental groups were sacrificed for western blot analysis. The ipsilateral L5 spinal cord segment was removed and immediately frozen on dry ice. Spinal cord tissue was homogenized in buffer (250 mM sucrose, 20 mMTris-HCL [pH 7.4], 1.5 mM Na-EDTA, 1.5 mM Na-EGTA, 1 mM MgCl2, 1 mM DTT [Sigma-Aldrich, St. Louis, OK, USA]), 20 mM KCl, and centrifuged. The L5 spinal cord segment proteins were applied to a 10% SDS-polyacrylamide gel. The phospho-extracellular signal-regulated kinase 1/2 (ERK1/2, CEL-4376S, Cell signaling Technology, Inc., Danvers, MA, USA), total-ERK1/2 (CEL-9102S), phospho-cyclic adenosine monophosphate response element binding protein (CREB, CEL-9198S), and total-CREB (CEL-9197S) were used as primary antibodies. The membrane was blocked with 2% BSA in Tris-buffered saline containing 0.1% Tween (TBST) at room temperature for 1 hr and then incubated overnight at 4℃ with antibody against β-actin and cytochrome c. After washing with TBST, peroxidase affinipure goat anti-rabbit IgG (JA-111-035-003, Jackson Immuno Research Laboratories Inc., West Grove, PA, USA) was used as a secondary antibody (1:2,000 dilution in 2% BSA in TBST, 1 hr 30 min incubation), and the antigen-antibody complexes were visualized using an enhanced chemiluminescence detection reagent. Bands were scanned using a densitometer (GS-700; Bio-Rad Laboratories), and quantified with Multi-Analyst 1.0.2 software (Bio-Rad Laboratories, Hercules, CA, USA). The data were expressed as immunoblot reactive band intensities (%). Immunoblot reactive band intensities were measured and compared to the densities of the corresponding loading control (β-actin).
Statistical analysis
The mean±standard error was calculated and the data analyzed using the SPSS Statistics 16.0 for Windows (SPSS Inc, Chicago, IL, USA). Comparisons of behavioral assessments between the groups at identical time points were performed using one-way analysis of variance (ANOVA), followed by Tukey test for multiple post hoc analysis. Intragroup comparisons of post-treatment and baseline values were made using repeated measure ANOVA, followed by Tukey test for multiple post hoc analysis. Comparisons of immunohistochemical study and western blot analysis between the groups were performed using Kruskal-Wallis test. Values of P<0.05 were considered significant. Specific calculated significance levels are indicated in the figures.
RESULTS
All the rats maintained good health and continued to gain weight through the experimental period. No motor dysfunction was observed in rats that were injected nefopam and normal saline. No significant side effects, such as ascites, weight loss, or alopecia were observed during the study.
Nefopam reduced mechanical antiallodynic threshold in the SNL rat model
The withdrawal threshold decreased significantly relative to baseline withdrawal on day 3 after SNL, confirming the development of mechanical allodynia. On day 1 after intrathecal catheter implantation, intrathecal injection of nefopam (10-100 µg/kg) produced antiallodynic effects in a dose dependent manner (P<0.05), and the peak effect was observed at 30 min after injection. Following intrathecal catheter implantation, the withdrawal thresholds in the N10 and N100 groups were higher than in group C at 7 and 14 days after intrathecal injection of nefopam, and a significant mechanical antiallodynic effect occurred (P<0.05) (Fig. 1).
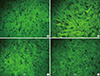
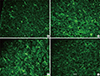
Nefopam suppressed microglial and astrocytic activation in the SNL rat model
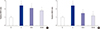
Fourteen days after intrathecal injection of nefopam, the CD11b and GFAP immunofluorescence intensities decreased on the ipsilateral L5 spinal cord region in groups N10 and N100 (Fig. 2 and 3). No group showed significant change in the contralateral spinal cord region (Figs not shown). The relative MOD ratio of CD11b and GFAP in the ipsilateral dorsal horn showed markedly intense CD11b and GFAP immunoreactivity, indicating that microglia and astrocytes had been activated. Intrathecal nefopam dose-dependently attenuated the microglial and astrocytic activation in the left L5 dorsal horn, indicated by the decreased relative MOD ratio of CD11b and GFAP (Fig. 4).
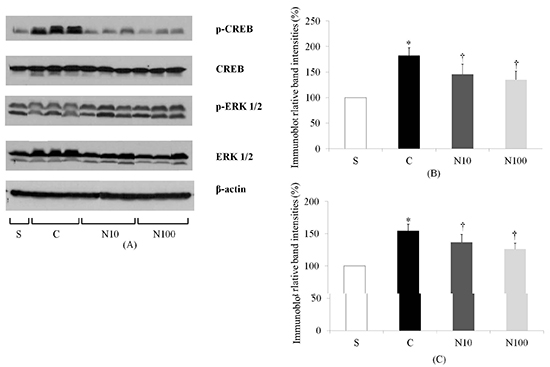
Nefopam suppressed the transcription factors' MAP kinases, such as ERK 1/2, and CREB, induced by spinal nerve ligation
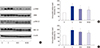
Fourteen days after surgery, the ipsilateral L5 spinal cord segment was removed, and the amount of ERK 1/2 and CREB were quantified by western blot analysis. Analysis revealed a significantly increased ERK 1/2 and CREB on the ipsilateral side of the L5 SNL when compared to the S group. However, the amount of ERK 1/2 and CREB induced to the L5 SNL were attenuated by administration of intrathecal nefopam (Fig. 5).
DISCUSSION
The purpose of the present study was to evaluate the antiallodynic effect of intrathecal nefopam in a rat neuropathic pain model. In this study, intrathecal nefopam in a SNL rat model blocked mechanical allodynia, suppressed microglial and astrocytic activation, and attenuated the transcription factors' MAP kinases.
Nefopam has a unique profile distinct from opioids or other anti-inflammatory drugs. Several animal studies demonstrate the analgesic activity of nefopam. Daily administration of intraperitoneal nefopam attenuated pain behavior in a dose-dependent manner in a chronic constriction injury (CCI) model of neuropathic pain in rats (14). It also induced a rapid and strong depression of the nociceptive reflex in humans (6). Reuptake inhibition of monoamines, such as serotonin, norepinephrine and dopamine, which mediate descending inhibitory pain modulation, has been suggested as a mechanism for nefopam-induced antinociception (1516). In addition, nefopam acts as a voltage-gated sodium channel blocker, which may mediate its antinociceptive effects partially or completely (17). Most nefopam studies were performed to gauge its antinociceptive effect; its efficacy in treating neuropathic pain and its underlying pharmacological actions remain unclear. Furthermore, few studies examine the molecular biological change occurring in the chronic neuropathic pain pathway.
In the present study, nefopam at 10 or 100 µg/kg and normal saline were injected intrathecally every day for 14 days after surgical implantation of an intrathecal catheter in rats. A significant, dose-dependent mechanical antiallodynic effect was caused by intrathecal nefopam and observed on days 7 and 14. Nefopam is administered by the intramuscular or intravenous route in clinical settings at present; the pharmacologic effects of intrathecally administered nefopam need to be evaluated due to the important role of spinal cord in the pain pathway. After peripheral nerve injury, glial activation and cell signaling pathways are induced within the spinal cord. This region also serves as a site of action for monoamines that mediate descending inhibitory pain modulation (1819). There have been few studies on the effect of nefopam at this level. Some studies suggest that antinociceptive effects of nefopam have both spinal and supraspinal targets (2021).
In another study, intrathecal nefopam produced an antinociceptive effect in formalin-induced pain behavior during both phases of the formalin test while interacting with intrathecal morphine synergistically in phase 1 and additively in phase 2 (22). The current study was demonstrated that intrathecal nefopam alone also has an antiallodynic effect, and its mechanism was proven through immunohistochemical study and western blot analysis.
Peripheral nerve injury induces profound changes in microglia and astrocytes. After peripheral nerve injury, the central terminals of primary sensory neurons may release neurotransmitters, such as glutamate and substance P, that may activate spinal microglia and astrocytes, and result in the production and release of pronociceptive mediators, such as interleukin-1β, tumor necrosis factor-α, prostaglandin E2, and adenosine triphosphate (23). Thereafter, microglia and astrocytes form a positive feedback loop and release pronociceptive mediators continuously (24). These mediators may facilitate pain processing by enhancing either presynaptic release of neurotransmitters or postsynaptic excitability (23). In the process, glial activation maintains a chronic pathological state experienced as persistent pain. Microglia respond early in the process, while astrocytes may continue to respond chronically beyond 7 days (2526). Blocking microglial and astrocytic activity and inhibiting proliferation are both effective in preventing or delaying neuropathic pain (27). In the present study, intrathecal nefopam suppressed the microglial and astrocytic activation induced by L5 spinal-nerve ligation, indicated by the decreased in CD11b and GFAP, respectively.
There are a few studies on the cell-signaling pathway (CNP) of neuropathic pain in rats. The activation of ERK pathways contributes to neuropathic pain in CCI rats, and the function of phospho-ERK may be accomplished in part through CREB dependent gene expression (11). Increased CREB phosphorylation, induced by SNL, may be one of the key molecular events leading to synaptic alterations and persistent pain in the SNL model of neuropathic pain (12). In the CNP of injured rats, activated kinase, such as phospho-ERK 1/2, is upregulated, which does not occur in injured rats that fail to develop a CNP. Activated CREB is also upregulated following spinal cord injury (28). In the present study, the amounts of ERK 1/2 and CREB protein induced by L5 SNL were attenuated by treatment with intrathecal nefopam.
In conclusion, intrathecal nefopam reduced mechanical allodynia in a rat neuropathic pain model. Its mechanical antiallodynic effect may be associated with the inhibition of microglial and astrocytic activation and suppression of the transcription factors' MAP kinases in the spinal cord. Therefore, intrathecal administration of nefopam may be a promising therapeutic intervention to treat peripheral nerve injury-induced neuropathy. Nevertheless, further studies are required to determine the efficacy of intrathecal nefopam for treatment of other forms of neuropathic pain, such as thermal allodynia and hyperalgesia, as well as its safety in a clinical setting.
 XML Download