Journal List > J Korean Med Sci > v.30(8) > 1022694

Park, Lee, Suh, Cho, Chang, Paick, and Lee: Establishment of Reference Ranges for Prostate Volume and Annual Prostate Volume Change Rate in Korean Adult Men: Analyses of a Nationwide Screening Population

Abstract

We aimed to determine normal reference ranges for prostate volume (PV) and annual PV change rate in a Korean nationwide screening population. Data from men who underwent a routine health check-up were collected from 13 university hospitals. The cohort comprised men aged ≥40 yr who had undergone 2 or more serial transrectal ultrasonographies. Men with initial PV>100 mL; serum PSA level>10 ng/mL; PV reduction>20% compared with initial PV, or who had history of prostate cancer or prostate surgery, were excluded. Linear regression and mixed effects regression analyses were used to predict mean PV and longitudinal change in PV over time. A total of 2,967 men formed the study cohort. Age, body mass index (BMI), and serum prostate-specific antigen (PSA) level were found to be significant predictors of PV. A predicted PV table, with a 95% confidence interval (CIs), was developed after adjusting for these 3 variables. Annual PV change rate was 0.51 mL/year (95% CI, 0.47-0.55). Annual PV change rate according to age was 0.68 mL/year, 0.84 mL/year, 1.09 mL/year, and 0.50 mL/year for subjects in their 40s, 50s, 60s, and ≥70 yr, respectively. Predicted annual PV change rate differed depending on age, BMI, serum PSA level and baseline PV. From a nationwide screening database, we established age-, PSA-, and BMI-specific reference ranges for PV and annual PV change rate in Korean men. Our newly established reference ranges for PV and annual PV change rate will be valuable in interpreting PV data in Korean men.

Graphical Abstract

jkms-30-1136-ab001

INTRODUCTION

Benign prostatic hyperplasia (BPH) is a major cause of lower urinary tract symptoms (LUTS) in aging men (1). It is hypothesized that the LUTS observed in men with symptomatic BPH are caused by a combination of increased sympathetic tone in the bladder neck and prostatic urethra (dynamic component) (2), and the increasing size of the prostatic adenoma (static component) (3). BPH is a progressive disease, and prostatic enlargement is associated with a risk of clinical events, including acute urinary retention, and the need for BPH-related surgery (456). In particular, while an increase in prostatic volume (PV) in aging men contributes to BPH/LUTS, it is not only a cause of LUTS, but results in highly variable symptoms among individuals (78). From community-based studies (91011) and data from the placebo arm of several clinical trials (456), the natural history of BPH and risk factors for BPH progression, have previously been evaluated.
Studies have shown that PV and PV change rate is associated with several clinical parameters, including age (810121314), serum prostate-specific antigen (PSA) level (569), and body mass index (BMI) (14151617). Meanwhile, increasing evidence has suggested that PV, and the prevalence of BPH/LUTS, may differ among ethnic groups (11181920). As such, several studies have shown that the PV of Asian men is lower than that in Caucasian men (20212223). However, because most of these studies (212223) were based on populations with BPH/LUTS, there are few data on reference ranges for PV and annual PV change rates in Asian men without BPH/LUTS. In the present study, we analyzed nationwide screening population data to determine normal reference ranges for PV and annual PV change rates in Korean men.

MATERIALS AND METHODS

This was a multicenter, retrospective observational study. Thirteen South Korean University Hospitals from 8 districts (Seoul, Daejeon, Cheongju, Daegu, Yangsan, Busan, Hwasun, and Kwangju) of 6 provinces were selected. Data were acquired as a part of the BPH awareness campaign (Blue Apple Campaign) by the Korean Urological Association. Data were collected from men who underwent a routine health check-up at health promotion centers of the participating hospitals between January 2004 and December 2012.
Men included in the study were aged≥40 yr and had undergone 2 or more serial transrectal ultrasonographies (TRUSs) with a minimum 3-month interval during the study period. To calculate annual PV change rate, only subjects with data from 2 or more TRUSs were included in this study. PV was automatically calculated by elliptical volume measurement (π/6× transverse diameter×anteroposterior diameter×cephalocaudal diameter) (24). Men with initial PV>100 mL; serum PSA level>10 ng/mL; and a history of prostate cancer or BPH-related surgery were excluded. In addition, men with a PV reduction>20% compared with initial PV were excluded because of the high possibility of measurement error or 5-alpha-reductase inhibitor (5ARI) treatment during follow-up (425). After exclusion, 2,967 men who had undergone 2 or more serial TRUSs with a median time interval of 15.9 months (interquartile range [IQR], 12.0-25.9 months) formed the study cohort. Among them, 426 (14.4%) and 106 (3.6%) subjects had undergone 3 TRUSs and≥4 serial TRUSs, respectively. Transitional zone volume (TZV) data were available in 2,392 subjects (80.6%).
All medical records, including clinical, laboratory and TRUS findings, were reviewed. Serum PSA level, self-reported information on co-morbidities, and anthropometric measurements, including height and weight, were collected. Primary outcomes were predicted PV and TZV; secondary outcomes were annual PV and TZV change rates. Subjects were categorized by age into the following groups: 40-49 yr; 50-59 yr; 60-69 yr; and≥70 yr. Subjects were classified by BMI according to the 2000 World Health Organization Asian Pacific Guideline (<23.0 kg/m2; 23.0-24.9 kg/m2;≥25 kg/m2) (26). Subjects were classified by serum PSA level into 4 groups:<1.0 ng/mL; 1.0-1.9 ng/mL; 2.0-2.9 ng/mL; and≥3.0 ng/mL.
For statistical analyses, descriptive statistics were used to examine the demographics and PV distribution of the study cohort. Linear regression analysis was used to determine the predicted mean PV and TZV according to age, BMI, and serum PSA level. Linear mixed effects regression analysis was used to estimate longitudinal change in PV (1027). This estimated average longitudinal change per group (fixed effects), while taking into account individual longitudinal change deviating from the group average curve (random effects). Mean values are reported with their standard deviation (SD) and median values are reported with their 25th and 75th percentiles (IQRs). All tests were two-tailed, with P<0.05 considered significant. Statistical analysis was performed using Stata/SE software, version 12.1 (Stata Corporation, College Station, TX, USA).

Ethics statement

This study was approved by the institutional review board of the Eulji University Hospital at Daejeon (IRB No. EULJI 2013-04-003) and Kyung Hee University Hospital at Seoul, Korea (IRB No. KHNMC 2013-026). Informed consent was waived by the board.

RESULTS

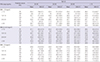
The mean age, BMI, serum PSA level, PV and TZV (median with IQRs) for the entire study population was 54.8 (53.0, 48-61) yr, 24.5 (24.4, 22.7-26.2) kg/m2, 1.5 (1.0, 0.7-1.7) ng/mL, 26.7 (24.4, 20.0-30.6) mL, and 11.2 (9.0, 6.0-13.0) mL, respectively. PV according to age, BMI, and serum PSA level is shown in Table 1. PV generally increased with increasing age, BMI, and serum PSA level; the corresponding SD also increased, suggesting high inter-individual variation. The distribution of TZV according to age, BMI, and serum PSA level showed a similar pattern to that of PV.
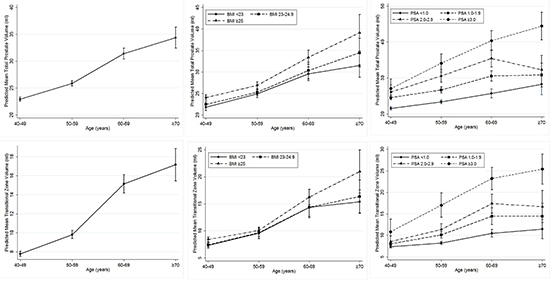
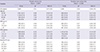
On multivariate linear regression analysis, age, BMI, and serum PSA level were significant predictive factors for both PV and TZV (Table 2, all P<0.001). After adjusting for these 3 variables, a predicted PV and TZV table, with 95% confidence intervals (CIs), was generated (Table 3). For example, using the table, the mean PV and TMZ for a 62-yr-old man with a BMI of 24.2 kg/m2 and a serum PSA level of 2.5 ng/mL could be predicted as 34 mL (95% CI, 30.5-37.5 mL) and 15.2 mL (95% CI, 12.7-17.7 mL), respectively. Fig. 1 shows the predicted mean PV and TZV with 95% CIs, according to age group, and further stratified according to BMI and serum PSA level. This shows that PV and TZV increased significantly with increasing age, BMI, and serum PSA level.
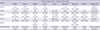
Annual PV and TZV change rates were 0.51 mL/year (95% CI, 0.47-0.55) and 0.32 mL/year (95% CI, 0.29-0.35), respectively. Annual predicted PV and TZV change rates according to age, BMI, serum PSA level, and baseline PV, after considering variation over time, are shown in Table 4. Annual PV change rate according to age was 0.68 mL/year, 0.84 mL/year, 1.09 mL/year, and 0.50 mL/year for men in their 40s, 50s, 60s, and≥70 yr, respectively. Prostate growth rate progressively increased with increasing age until 70 yr, with the most rapid increase between the age of 60 yr and 70 yr. Subjects aged≥70 yr had a reduced growth rate compared with those aged<70 yr.
The annual PV change rate of subjects with a BMI≥25 kg/m2 was greater than that of subjects with a BMI<25 kg/m2. Similarly, there was a tendency for greater PV change rates in subjects with higher serum PSA levels and higher baseline PV. While the 95% CIs according to BMI group were relatively constant, the corresponding 95% CIs increased with increasing age, serum PSA level, and baseline PV; this indicates high inter-individual variation in the subgroups. The general trend in annual TZV change rate for each group (age, BMI, serum PSA level, and baseline PV) were similar to the annual PV change rate.

DISCUSSION

This is the first study to investigate the normal reference ranges for PV and annual PV change rate in Korean men using a nationwide screening population. Our study included data from nearly 3,000 subjects who had undergone 2 or more serial TRUSs to allow analysis of longitudinal PV change and to minimize possible bias due to measurement error associated with a single PV measurement.
Age-specific PV in our study population was slightly higher than that reported in Japanese studies (2022), but lower than that reported in studies of Caucasians (1019), African Americans (1928), or the Dutch (13) (Table 5). Differences in study designs, which range from unselected community samples to clinical cohorts with BPH/LUTS, limit comparisons of our data with those of other studies. The present study reveals that the age-specific PV of a Korean screening population is lower than that of Western community-dwelling men (101328). Similar findings were reported by other clinical studies of Korean (21), Japanese (22), and Taiwanese (23) men.
We found that age, BMI, and serum PSA level were significant predictors of PV and TZV. Therefore, we developed a table for predicting PV and TZV using the 3 variables (Table 2). We believe that our table should be more accurate than simple PV prediction based on a single parameter (age, BMI, or serum PSA level) because the 3 major determinants of PV are adjusted together. Although PV is a determinant of BPH/LUTS, and a risk factor for BPH progression (45678), TRUS-based PV measurement is not feasible in all patients because of lack of availability, inconvenience, and the cost of the examination, particularly in the primary care setting. In this context, our PV table is a useful assessment tool to predict PV in Korean men, using easily obtainable parameters such as age, BMI, and serum PSA level.
Prediction of PV and TZV change rates is another important clinical issue. In our screening population, the estimated annual PV and TZV change rates were 0.51 mL/year and 0.32 mL/year, respectively. Other longitudinal follow-up studies of community-dwelling men report mean annual PV change rates ranging from 0.3 mL/year to 0.6 mL/year (91013). Meanwhile, studies of clinically diagnosed BPH/LUTS patients have reported annual PV change rates of 1.4-2.4 mL/year (629), which is significantly higher than those reported by community-based studies. Of note, the annual PV change rate in our study was comparable to rates reported by community-based studies, which indicates that our study population may represent community-dwelling men. Similar to PV, prior community-based studies have shown ethnic differences in PV change rate (9101320). For example, in an analysis of cross-sectional data, Masumori et al. (20) reported that Japanese men had a lower estimated annual PV change rate than American men (0.3 mL/year vs. 0.6 mL/year). Taken together, Korean men seem to have annual PV change rate that ranges between that of Japanese men and Caucasian men.
We observed that the annual PV and TZV change rates differed depending on age, BMI, serum PSA level, and baseline PV (Table 3). Similarly, prior studies reported that PV change rates differed depending on age (132029), BMI (1617), serum PSA level (69), and baseline PV (1013). Interestingly, annual PV growth rate progressively increased until the age of 70 yr, after which it declined. Although the reason for this finding is unclear, several studies have shown that PV is stable or decreases with age in some men, compared with the general pattern of PV growth (8930). For example, Vesely et al. (8) reported that an increase in PV with advancing age is not continuous, and that PV decreases in those aged 75-79 yr. These findings suggest that a decrease in PV in a proportion of subjects in the older age group may be responsible for the reduced annual prostate growth rate in our subjects aged≥70 yr. Consistent with findings from other studies, we found a tendency for a higher PV growth rate in subjects with a higher BMI, serum PSA level, and baseline PV (691617).
Our study has several limitations. Besides its retrospective nature, the time interval between TRUSs differed among individuals, and the annual PV growth rate was calculated over a relatively short follow-up period (IQR 12.0-25.9 months). Because our PV and TZV estimation was based on TRUS at multiple institutes, inter-observer variation should be considered. In addition, because data regarding 5ARI medication use during the follow-up period were not available, 5ARI medication use in some subjects could have been biased results. Countering these limitations, our PV data were based on a large nationwide population, and were analyzed with appropriate statistical methods. In addition, our PV change rates were based on longitudinal follow-up data in the same men, and are thus more accurate than those derived from cross-sectional data. Subjects in our study were healthy men who underwent a routine health check-up, and most had a PV<30 mL (72.6%) or<40 mL (90.9%). Given that this is a common indication for 5ARI treatment (2129), the proportion of subjects starting 5ARI medication might be expected to be minimal. Given that our data are not restricted to a specific geographical area, but represented a nationwide screening population, we believe that our results are generalizable to the entire adult male Korean population.
We established age, BMI, and serum PSA level-specific reference ranges and annual change rates for PV and TZV in Korean adult men comprising a nationwide screening population. Our results show that age-specific reference ranges for PV in Korean men are lower than those for Caucasian men. Our newly established reference ranges for PV and annual PV change rates in Korean men can be used as a valuable clinical tool for counseling patients with BPH.

Figures and Tables

Fig. 1

Predicted mean prostate volume (PV) and 95% confidence intervals (CI) according to age and predicted mean PV, further stratified by body mass index (BMI) and serum prostate specific antigen (PSA) level (upper column). Predicted mean transitional zone volume (TZV) and 95% CIs according to age and predicted mean TZV, further stratified by BMI and serum PSA level (lower column).

jkms-30-1136-g001
Table 1

Baseline prostate and transitional zone volume according to age, BMI and PSA

jkms-30-1136-i001
Variables Prostate volume (mL), n = 2,967 Transition zone volume (mL), n = 2,392
No. (%) Mean (SD) Median (IQR) No. (%) Mean (SD) Median (IQR)
Age (yr)
 40-49 1,001 (33.7) 23.0 (6.3) 22.0 (18.6, 26.1) 680 (28.4) 7.8 (3.6) 7.2 (5.4, 9.7)
 50-59 1,109 (37.4) 25.9 (8.3) 24.2 (20.4, 30.0) 907 (37.9) 9.8 (6.6) 8.9 (6.0, 12.0)
 60-69 605 (20.4) 31.4 (12.8) 28.0 (22.9, 37.7) 563 (23.5) 15.2 (11.7) 12.0 (7.8, 18.4)
 ≥ 70 252 (8.5) 34.4 (15.8) 30.9 (23.0, 41.0) 242 (10.1) 17.2 (13.5) 13.4 (7.9, 21.6)
BMI (kg/m2)
 < 23 835 (28.1) 25.8 (10.0) 24.0 (19.0, 29.9) 695 (29.1) 11.0 (9.6) 8.3 (6.0, 13.0)
 23-24.9 931 (31.4) 26.0 (9.8) 24.0 (20.0, 29.2) 730 (30.5) 10.7 (8.5) 9.0 (6.0, 12.2)
 ≥ 25 1,201 (40.5) 27.9 (11.0) 25.3 (21.0, 32.2) 967 (40.4) 11.8 (9.0) 9.6 (6.8, 13.7)
PSA (ng/mL)
 < 1.0 1,469 (49.5) 23.3 (7.4) 22.0 (18.2, 27.0) 1,143 (47.8) 8.6 (5.2) 7.6 (5.4, 10.4)
 1.0-1.9 908 (30.6) 26.9 (8.3) 25.1 (21.3, 30.8) 736 (30.8) 10.6 (8.0) 9.0 (6.6, 12.7)
 2.0-2.9 260 (8.8) 31.4 (10.5) 30.0 (24.0, 36.0) 219 (9.1) 13.9 (9.2) 11.8 (7.9, 17.3)
 ≥ 3.0 330 (11.1) 38.2 (15.7) 34.2 (26.3, 47.2) 294 (12.3) 21.1 (14.5) 16.6 (11.0, 28.5)

SD, standard deviation; IQR, interquartile range; BMI, body mass index; PSA, prostate specific antigen.

Table 2

Multivariable linear regression analysis for prostate volume and transitional zone volume

jkms-30-1136-i002
Variables* Prostate volume (mL) Transitional zone volume (mL)
β 95% CI P value β 95% CI P value
Age (yr) 0.31 0.28-0.35 < 0.001 0.26 0.23-0.30 < 0.001
BMI (kg/m2) 0.57 0.46-0.69 < 0.001 0.30 0.19-0.41 < 0.001
PSA (ng/mL) 2.49 2.27-2.71 < 0.001 2.04 1.84-2.25 < 0.001
Age (yr)
 40-49 1 1 - 1 1 -
 50-59 2.17 1.42-2.93 < 0.001 1.41 0.63-2.18 < 0.001
 60-69 5.91 4.99-6.83 < 0.001 5.31 4.41-6.21 < 0.001
 ≥ 70 8.18 6.92-9.45 < 0.001 6.64 5.45-7.84 < 0.001
BMI (kg/m2)
 < 23 1 1 - 1 1 -
 23-24.9 1.06 0.23-1.88 0.012 0.38 -0.44-1.19 0.366
 ≥ 25 3.18 2.40-3.97 < 0.001 1.74 0.97-2.50 < 0.001
PSA (ng/mL)
 < 1.0 1 1 - 1 1 -
 1.0-1.9 3.46 2.73-4.19 < 0.001 2.00 1.27-2.72 < 0.001
 2.0-2.9 6.63 5.46-7.81 < 0.001 3.94 2.80-5.09 < 0.001
 ≥ 3.0 12.57 11.47-13.67 < 0.001 10.51 9.47-11.55 < 0.001

*Analysis performed separately: one with variables left as continuous (above), another with variables categorized into respective dummy variables (below). BMI, body mass index; PSA, prostate specific antigen.

Table 3

Predicted prostate volume (PV) and transitional zone volume (TZV) in Korean men according to age, BMI and PSA

jkms-30-1136-i003
PSA range (ng/mL) Predicted volume (mL) Age (yr)
40-49 50-59 60-69 ≥ 70
Mean 95% CI Mean 95% CI Mean 95% CI Mean 95% CI
BMI < 23 (kg/m2)
 <; 1.0 PV 20.4 19.6-21.1 22.4 21.4-23.4 23.2 21.4-25.0 26.3 21.8-30.7
TZV 6.6 6.1-7.2 7.6 6.9-8.3 9.2 7.9-10.4 10.3 7.7-12.9
 1.0-1.9 PV 22.7 21.4-24.0 25.6 24.3-26.8 30.0 27.2-32.7 25.9 21.6-30.2
TZV 7.3 6.5-8.1 9.4 8.5-10.4 16.0 10.6-21.4 12.2 8.1-16.3
 2.0-2.9 PV 25.6 21.4-29.8 29.5 26.2-32.9 32.7 28.5-36.9 29.1 25.1-33.1
TZV 7.5 5.8-9.2 11.3 8.8-13.7 15.3 10.7-20.0 13.7 10.3-17.1
 ≥ 3.0 PV 29.7 23.8-35.5 33.0 27.1-38.8 36.6 33.1-40.0 42.1 36.3-47.8
TZV 15.4 9.3-21.5 20.0 11.0-29.1 19.4 16.7-22.1 23.8 19.0-28.5
BMI 23-24.9 (kg/m2)
 < 1.0 PV 21.1 20.3-21.9 23.2 22.4-24.0 24.2 22.2-26.2 28.5 25.5-31.4
TZV 7.2 6.7-7.8 8.2 7.5-8.8 9.9 8.3-11.6 11.0 8.3-13.7
 1.0-1.9 PV 24.1 23.1-25.1 25.7 24.5-27.0 29.7 27.1-32.2 30.2 25.0-35.5
TZV 7.4 6.7-8.0 10.5 8.8-12.1 13.0 11.3-14.8 10.8 7.7-13.9
 2.0-2.9 PV 25.8 23.8-27.7 29.4 26.4-32.3 34.0 30.5-37.5 31.9 22.5-41.4
TZV 9.7 7.6-11.8 10.4 8.8-12.0 15.2 12.7-17.7 16.8 7.9-25.7
 ≥ 3.0 PV 24.4 19.5-29.2 32.6 29.4-35.7 39.4 33.2-45.7 47.7 40.5-54.9
TZV 6.7 3.8-9.5 14.2 11.4-16.9 22.6 16.6-28.7 28.9 22.1-35.6
BMI ≥ 25 (kg/m2)
 < 1.0 PV 22.6 21.8-23.3 24.0 23.2-24.8 27.9 25.8-30.1 31.5 23.2-39.8
TZV 8.1 7.5-8.6 8.5 7.9-9.1 11.5 10.1-12.9 14.3 7.0-21.6
 1.0-1.9 PV 25.8 24.7-26.8 28.3 26.8-29.9 31.8 29.7-33.9 38.6 32.2-45.0
TZV 8.8 8.1-9.5 10.3 9.4-11.3 14.3 12.7-15.9 21.3 14.6-28.0
 2.0-2.9 PV 27.6 23.8-31.3 31.6 28.8-34.4 38.0 33.9-42.1 39.9 29.4-50.3
TZV 9.1 5.7-12.6 11.8 9.6-14.0 19.9 16.1-23.8 23.3 13.1-33.6
 ≥ 3.0 PV 26.8 23.3-30.2 36.5 32.0-41.0 44.3 39.7-48.8 45.4 37.8-53.0
TZV 8.6 7.1-10.2 18.0 14.2-21.8 26.9 22.7-31.1 24.9 17.4-32.3

BMI, body mass index; PSA, prostate specific antigen.

Table 4

Longitudinal predicted increase in prostate and transitional zone volume per year according to age, BMI, PSA and baseline prostate volume

jkms-30-1136-i004
Variables Prostate volume (mL)
Total (n = 2,967)
Transition zone volume (mL)
Total (n = 2,392)
N (%) β* 95% CI N (%) β* 95% CI
All subjects 2,967 0.51 0.47-0.55 2,392 0.32 0.29-0.35
Age (yr)
 40-49 1,001 (33.7) 0.68 0.59-0.78 680 (28.4) 0.28 0.21-0.35
 5 0- 59 1,109 (37.4) 0.84 0.73-0.95 907 (37.9) 0.41 0.30-0.52
 60-69 605 (20.4) 1.09 0.90-1.29 563 (23.6) 0.57 0.39-0.75
 ≥ 70 252 (8.5) 0.50 0.24-0.77 242 (10.1) 0.18 -0.05-0.42
BMI (kg/m2)
 < 23 835 (28.1) 0.48 0.41-0.54 695 (29.1) 0.31 0.26-0.36
 23-24.9 931 (31.4) 0.49 0.43-0.56 730 (30.5) 0.30 0.26-0.35
 ≥ 25 1,201 (40.5) 0.55 0.49-0.62 967 (40.4) 0.34 0.29-0.38
PSA (ng/mL)
 < 1.0 1,469 (49.5) 0.33 0.28-0.37 1,143 (47.8) 0.17 0.14-0.20
 1.0-1.9 908 (30.6) 0.43 0.37-0.49 736 (30.8) 0.27 0.22-0.31
 2.0-2.9 260 (8.8) 0.48 0.35-0.60 219 (9.1) 0.42 0.33-0.52
 ≥ 3.0 330 (11.1) 0.77 0.61-0.93 294 (12.3) 0.57 0.44-0.70
Baseline PV (mL)
 < 20 684 (23.0) 0.08 0.05-0.11 485 (20.3) 0.05 0.03-0.08
 20-24.9 834 (28.1) 0.07 0.05-0.10 641 (26.8) 0.08 0.06-0.11
 25-29.9 637 (21.5) 0.05 0.02-0.08 529 (22.1) 0.12 0.08-0.16
 30-39.9 542 (18.3) 0.12 0.08-0.16 485 (20.3) 0.24 0.19-0.28
 ≥ 40 270 (9.1) 0.54 0.40-0.69 252 (10.5) 0.56 0.39-0.73

*Determined by multilevel linear mixed effects regression analysis. PSA, prostate specific antigen; BMI, body mass index; PV, prostate volume.

Table 5

Comparison of age-specific prostate volume among different ethnicities

jkms-30-1136-i005
Age (yr) Median prostate volume, mL (Interquartile range)
White10 Black28 White19 Black19 Dutch13 Japanese20 Japanese22 Korean21 Present study
40-49 21.4
(18.7-25.9)
22.4
(17.8-27.6)
22
(19-33)
23
(19-29)
- 17.4*
[15.4-17.9]
17.7*
[12.7-22.6]
- 22/23.0*
(18.6-26.1)
50-59 27.3
(22.0-33.1)
24.8
(20.3-32.2)
30
(23-41)
28
(22-39)
27.3-29.1
(23.2-34.5)
19.4*
[17.1-18.8]
25.3*
[23.1-27.5]
31.5*
[30.9-32.1]
24.2/25.9*
(20.4-30.0)
60-69 31.7
(26.0-38.5)
29
(22.2-39.9)
33
(24-52)
41
(29-56)
31.8-32.0
(24.4-40)
20.7*
[18.6-20.2]
29.9*
[27.8-31.9]
37.4*
[36.7-38.1]
28/31.4*
(22.9-37.7)
70-79 34
(26.0-48.6)
30
(22.7-40.0)
42
(23-64)
51
(33-72)
38.0-40.1
(28.7-58.5)
22.3*
[19.7-22.4]
33.3*
[30.7-36]
41.7*
[40.5-42.9]
28/34.4*†
(22.9-37.7)
80-89 - - 51
(43-61)
43
(27-77)
- 30.8*
[21.1-40.4]
-
Study population Community-based Community-based Clinical cohort Clinical cohort Community-based Community-based Clinical cohort Clinical cohort Clinical screening population

*Mean value [95% confidence intervals]; prostate volume for men ≥70 yr of age; including men with clinically diagnosed benign prostatic hyperplasia/lower urinary tract symptoms.

ACKNOWLEDGMENTS

We thank the following investigators who participated in data acquisition for the present study: Jae Young Park, M.D. (Department of Urology, Korea University Hospital, Korea University College of Medicine, Seoul, Korea), Jae-Heon Kim, M.D. (Department of Urology, Soonchunhyang University Hospital, Soonchunhyang University College of Medicine, Seoul, Korea), Tae Gyun Kwon, M.D. (Department of Urology, School of Medicine, Kyungpook National University, Daegu, Korea), Jong Kil Nam, M.D. (Department of Urology, Pusan National University Yangsan Hospital, Yangsan, Korea), Hong Koo Ha, M.D. (Department of Urology, Pusan National University Hospital, Pusan National University School of Medicine, Busan, Korea), Dong Deuk Kwon, M.D. (Department of Urology, Chonnam National University Hwasun Hospital, Chonnam National University Medical School, Hwasun, Korea), Taek Won Kang, M.D. (Department of Urology, Chonnam National University Medical School, Gwangju, Korea), and Seok Joong Yun, M.D. (Department of Urology, College of Medicine, Chungbuk National University, Cheongju, Korea).

Notes

DISCLOSURE The authors have no conflicts of interest to disclose.

AUTHOR CONTRIBUTION Study design: Park J, Lee HL. Data collection and analysis: Park J, Lee DG, Cho SY, Chang IH, Paick SH. Statistical analysis: Park J, Suh B. Writing manuscript: Park J. Manuscript approval: all authors.

References

1. Walsh PC. Treatment of benign prostatic hyperplasia. N Engl J Med. 1996; 335:586–587.
2. Lepor H. Alpha blockade for the treatment of benign prostatic hyperplasia. Urol Clin North Am. 1995; 22:375–386.
3. McConnell JD. Benign prostatic hyperplasia. Hormonal treatment. Urol Clin North Am. 1995; 22:387–400.
4. McConnell JD, Bruskewitz R, Walsh P, Andriole G, Lieber M, Holtgrewe HL, Albertsen P, Roehrborn CG, Nickel JC, Wang DZ, et al. The effect of finasteride on the risk of acute urinary retention and the need for surgical treatment among men with benign prostatic hyperplasia. Finasteride Long-Term Efficacy and Safety Study Group. N Engl J Med. 1998; 338:557–563.
5. Marberger MJ, Andersen JT, Nickel JC, Malice MP, Gabriel M, Pappas F, Meehan A, Stoner E, Waldstreicher J. Prostate volume and serum prostate-specific antigen as predictors of acute urinary retention. Combined experience from three large multinational placebo-controlled trials. Eur Urol. 2000; 38:563–568.
6. Roehrborn CG, McConnell J, Bonilla J, Rosenblatt S, Hudson PB, Malek GH, Schellhammer PF, Bruskewitz R, Matsumoto AM, Harrison LH, et al. Serum prostate specific antigen is a strong predictor of future prostate growth in men with benign prostatic hyperplasia. PROSCAR long-term efficacy and safety study. J Urol. 2000; 163:13–20.
7. Lepor H. Pathophysiology of lower urinary tract symptoms in the aging male population. Rev Urol. 2005; 7:S3–S11.
8. Vesely S, Knutson T, Damber JE, Dicuio M, Dahlstrand C. Relationship between age, prostate volume, prostate-specific antigen, symptom score and uroflowmetry in men with lower urinary tract symptoms. Scand J Urol Nephrol. 2003; 37:322–328.
9. Loeb S, Kettermann A, Carter HB, Ferrucci L, Metter EJ, Walsh PC. Prostate volume changes over time: results from the Baltimore Longitudinal Study of Aging. J Urol. 2009; 182:1458–1462.
10. Rhodes T, Girman CJ, Jacobsen SJ, Roberts RO, Guess HA, Lieber MM. Longitudinal prostate growth rates during 5 years in randomly selected community men 40 to 79 years old. J Urol. 1999; 161:1174–1179.
11. Sarma AV, Wei JT, Jacobson DJ, Dunn RL, Roberts RO, Girman CJ, Lieber MM, Cooney KA, Schottenfeld D, Montie JE, et al. Olmsted County Study of Urinary Symptoms and Health Status. Flint Men's Health Study. Comparison of lower urinary tract symptom severity and associated bother between community-dwelling black and white men: the Olmsted County Study of Urinary Symptoms and Health Status and the Flint Men's Health Study. Urology. 2003; 61:1086–1091.
12. Ochiai A, Fritsche HA, Babaian RJ. Influence of anthropometric measurements, age, and prostate volume on prostate-specific antigen levels in men with a low risk of prostate cancer. Urology. 2005; 66:819–823.
13. Bosch JL, Tilling K, Bohnen AM, Bangma CH, Donovan JL. Establishing normal reference ranges for prostate volume change with age in the population-based Krimpen-study: prediction of future prostate volume in individual men. Prostate. 2007; 67:1816–1824.
14. Joseph MA, Wei JT, Harlow SD, Cooney KA, Dunn RL, Jaffe CA, Montie JE, Schottenfeld D. Relationship of serum sex-steroid hormones and prostate volume in African American men. Prostate. 2002; 53:322–329.
15. Bhindi B, Margel D, Trottier G, Hamilton RJ, Kulkarni GS, Hersey KM, Finelli A, Trachtenberg J, Zlotta A, Toi A, et al. Obesity is associated with larger prostate volume but not with worse urinary symptoms: analysis of a large multiethnic cohort. Urology. 2014; 83:81–87.
16. Wallner LP, Morgenstern H, McGree ME, Jacobson DJ, St Sauver JL, Jacobsen SJ, Sarma AV. The effects of body mass index on changes in prostate-specific antigen levels and prostate volume over 15 years of follow-up: implications for prostate cancer detection. Cancer Epidemiol Biomarkers Prev. 2011; 20:501–508.
17. Muller RL, Gerber L, Moreira DM, Andriole G Jr, Hamilton RJ, Fleshner N, Parsons JK, Freedland SJ. Obesity is associated with increased prostate growth and attenuated prostate volume reduction by dutasteride. Eur Urol. 2013; 63:1115–1121.
18. Hoke G, Baker W, Barnswell C, Bennett J, Davis R, Mason T, Rayford W. Racial differences in pathogenetic mechanisms, prevalence, and progression of benign prostatic hyperplasia. Urology. 2006; 68:924–930.
19. Fowler JE Jr, Bigler SA, Kilambi NK, Land SA. Relationships between prostate-specific antigen and prostate volume in black and white men with benign prostate biopsies. Urology. 1999; 53:1175–1178.
20. Masumori N, Tsukamoto T, Kumamoto Y, Miyake H, Rhodes T, Girman CJ, Guess HA, Jacobsen SJ, Lieber MM. Japanese men have smaller prostate volumes but comparable urinary flow rates relative to American men: results of community based studies in 2 countries. J Urol. 1996; 155:1324–1327.
21. Chung BH, Hong SJ, Cho JS, Seong DH. Relationship between serum prostate-specific antigen and prostate volume in Korean men with benign prostatic hyperplasia: a multicentre study. BJU Int. 2006; 97:742–746.
22. Gupta A, Aragaki C, Gotoh M, Masumori N, Ohshima S, Tsukamoto T, Roehrborn CG. Relationship between prostate specific antigen and indexes of prostate volume in Japanese men. J Urol. 2005; 173:503–506.
23. Chang YL, Lin AT, Chen KK, Chang YH, Wu HH, Kuo JY, Huang WJ, Lu SH, Hsu YS, Chung HJ, et al. Correlation between serum prostate specific antigen and prostate volume in Taiwanese men with biopsy proven benign prostatic hyperplasia. J Urol. 2006; 176:196–199.
24. Terris MK, Stamey TA. Determination of prostate volume by transrectal ultrasound. J Urol. 1991; 145:984–987.
25. Roehrborn CG, Siami P, Barkin J, Damião R, Major-Walker K, Nandy I, Morrill BB, Gagnier RP, Montorsi F. CombAT Study Group. The effects of combination therapy with dutasteride and tamsulosin on clinical outcomes in men with symptomatic benign prostatic hyperplasia: 4-year results from the CombAT study. Eur Urol. 2010; 57:123–131.
26. Kanazawa M, Yoshiike N, Osaka T, Numba Y, Zimmet P, Inoue S. Criteria and classification of obesity in Japan and Asia-Oceania. World Rev Nutr Diet. 2005; 94:1–12.
27. Laird NM, Ware JH. Random-effects models for longitudinal data. Biometrics. 1982; 38:963–974.
28. Sarma AV, Jaffe CA, Schottenfeld D, Dunn R, Montie JE, Cooney KA, Wei JT. Insulin-like growth factor-1, insulin-like growth factor binding protein-3, and body mass index: clinical correlates of prostate volume among Black men. Urology. 2002; 59:362–367.
29. McConnell JD, Roehrborn CG, Bautista OM, Andriole GL Jr, Dixon CM, Kusek JW, Lepor H, McVary KT, Nyberg LM Jr, Clarke HS, et al. Medical Therapy of Prostatic Symptoms (MTOPS) Research Group. The long-term effect of doxazosin, finasteride, and combination therapy on the clinical progression of benign prostatic hyperplasia. N Engl J Med. 2003; 349:2387–2398.
30. Tsukamoto T, Masumori N, Rahman M, Crane MM. Change in International Prostate Symptom Score, prostrate-specific antigen and prostate volume in patients with benign prostatic hyperplasia followed longitudinally. Int J Urol. 2007; 14:321–324. discussion 5
TOOLS
ORCID iDs

Jinsung Park
https://orcid.org/http://orcid.org/0000-0001-6158-3359

Dong-Gi Lee
https://orcid.org/http://orcid.org/0000-0001-7369-9252

Hyung-Lae Lee
https://orcid.org/http://orcid.org/0000-0002-4338-7423

Similar articles