

 PDF
PDF Citation
 Print
Print


INTRODUCTION
Bilirubin is an end product of heme metabolism; heme oxygenase cleaves the heme ring, producing carbon monoxide, iron, and biliverdin, which is converted by biliverdin reductase into bilirubin (1). Recent studies have indicated that bilirubin, at mildly elevated levels, acts as a cytoprotectant in diabetes, diabetic complications, and in diseases of the cardiovascular and renal systems, mainly through its antioxidative and anti-inflammatory properties (2). By inhibiting oxidative stress and down-regulating NADPH oxidase, bilirubin attenuates pancreatic damage (3) and renal injury (4) in hyperbilirubinemic Gunn rats compared to genetic controls with streptozotocin (STZ)-induced type I diabetes. The beneficial effects of bilirubin are also reported in human diseases including metabolic syndrome (5,6,7), diabetes (8,9), diabetic nephropathy (9,10), hypertension (11), IgA nephropathy (12), and cardiovascular disease (13). Bilirubin is inversely related with insulin resistance, as estimated by the homeostasis model assessment of insulin resistance (HOMA-IR) (5,6,7) and the concentration of triglycerides (TGs) in human sera (5,6,7,8,9). Studies have also reported a relationship between serum bilirubin and the concentration of total cholesterol (5), low-density lipoprotein cholesterol (LDL-C) (5), remnant lipoprotein cholesterol (14), and high-density lipoprotein cholesterol (HDL-C) (7,8), although the significances of these relationships varied depending on the experimental conditions. Bilirubin is evidently closely related to lipid metabolism and insulin resistance; however, few studies have evaluated the mechanisms by which bilirubin regulates dyslipidemia. In 1979, Shepherd et al. (15) reported that a high concentration of bilirubin (0.45 mM) inhibited lipolysis and stimulated glucose oxidation in rat fat cells in the presence of an equimolar concentration of bovine serum albumin. To the best of our knowledge, this is the only study in which the influence of bilirubin on lipid metabolism was examined. Insulin resistance is a potentially important mechanism leading to the development of dyslipidemia, especially in increasing TG and decreasing HDL-C levels (8,9,10,11,12). However, the inverse relationship between serum TG concentration and bilirubin was evident in Korean women after adjusting for HOMA-IR, body mass index, C-reactive protein, and menopausal status (7). Therefore, we postulate that bilirubin regulates TGs through a direct pathway. We examined the effects of bilirubin on renal function and serum lipid levels, and investigated possible mechanisms by which bilirubin regulates lipogenesis in rats with STZ-induced type I diabetes.
MATERIALS AND METHODS
Animals
Eighteen male Sprague-Dawley (SD) rats (Orient Bio Inc., Seongnam, Korea) weighing 200-250 g were housed in a temperature-controlled animal facility at Seoul National University Bundang Hospital. Animals were exposed to a daily 12-hr light/dark cycle. The animals were provided with standard rat chow and sufficient water and were adapted to the environment for 1 week. The rats were assigned to the experiment groups as follows: control (n=5), diabetes control (DM; n=8), and DM rats treated with bilirubin (Bil; n=5). Twenty-four-hour urine volumes were measured before and 5 weeks after inducing diabetes by injecting STZ intraperitoneally. After 8 hr of fasting, STZ (Sigma, MO, USA) at a dose of 65 mg/kg body weight was injected into the peritoneums of rats belonging to the DM and Bil groups. Bilirubin (Sigma, #B4125), dissolved in dimethyl sulfoxide (DMSO) to a final concentration of 20 mg/mL, was administered to the Bil group by intraperitoneal (IP) injection 3 times per week (60 mg/kg) after the diabetic status of these rats had been confirmed. DMSO was injected into the control and DM groups as vehicle. Five weeks after diabetes induction, rats were anesthetized using zolazepam and xylanzine, blood was sampled, and then kidney and liver tissues were collected and fixed in 10% formalin for 24 hr for morphological analyses. This study was approved by and conducted in accordance with the guidelines of the Seoul National University Bundang Hospital Committee of Animal Experiments.
Physiologic measurements
Glucose levels in sera collected from rat tail veins 6 hr after fasting were measured using a HemoCue B-glucose kit (HemoCue AB, Angelholm, Sweden) before and 3 days after STZ injection. Fasting glucose levels greater than 300 mg/dL confirmed the induction of diabetes. Thereafter, serum glucose levels were measured three times a week. Long-acting insulin (Lantus, Aventis, Paris, France) was administered subcutaneously (2-4 IU/injection/2 days) into the diabetic rats, maintaining their non-fasting glucose level at approximately 400 mg/dL (3). Glycated hemoglobin (HbA1c) levels were measured at baseline and at the time of sacrifice by using the DCA 2000+ HbA1c kit (Bayer, IN, USA). The 24-hr urine volume was measured and the urine albumin concentration was determined using an enzyme-linked immunosorbent assay (ELISA) kit (Exocell, Philadelphia, PA, USA). Creatinine levels in sera (Bioassay Systems, Hayward, CA, USA) and urine (Exocell) were also measured using ELISA kits. We measured serum TG, HDL-C, free fatty acid, and total cholesterol by using an automatic analyzer (ADIVA 2400, Siemens, USA).
Detection of ROS generation
Oxidation-sensitive 2',7'-dicholorofluorescein diacetate (H2DCF-DA; Sigma, MO, USA) was used to measure the intracellular production of ROS. Kidney lysates were incubated with 10 µM H2DCF-DA at 37℃ for 30 min. The fluorescence intensity was measured using a fluorescence spectrophotometer at excitation and emission wavelengths of 490 nm and 526 nm, respectively.
Liver tissue TG measurement
One hundred milligrams of liver tissue per animal was collected and the amount of TG per gram of tissue was measured using a TG quantification kit (ab65336; Abcam, CA, USA) according to the manufacturer's instructions.
Histologic analyses
Kidney sections, 3 µm in thickness, were stained with periodic acid-Schiff (PAS). A computer-assisted image analysis system was used to quantify the mesangial expansion in glomeruli. The ratios of mesangial area to glomerulus area were determined for 30 glomeruli from each rat. Terminal deoxynucleotidyl transferase-mediated dUTP-biotin nick end labeling (TUNEL) was performed on kidney paraffin sections by using the In Situ Cell Death Detection Kit (Fluorescein, Roche Diagnostics, Mannheim, Germany) to detect apoptotic cells in glomeruli. The positive rate of TUNEL staining was examined in 30 glomeruli per kidney section and the mean value for each group was compared.
Hepatoma and mesangial cell culture
Hepatoma cells (ATCC CRL-1830) were cultured in Dulbecco's modified Eagle's medium (Gibco, Life Technologies, USA) in the presence of normal glucose (NG; 100 mg/dL D-glucose) or high glucose (HG; 450 mg/dL D-Glucose) and supplemented with 10% heat-inactivated fetal calf serum and 1% antibiotics (10 mg/mL streptomycin and 10,000 IU/mL penicillin G) in a humidified environment with 5% CO2 at 37℃. NG, HG, and Bil cells were initially grown in NG medium. The HG and Bil groups were transferred to HG once they had reached 70%-80% cell confluence in NG medium. The Bil group was treated with 0.3 mg/dL bilirubin (Sigma #B4125, MO, USA) dissolved in DMSO prior to being transferred to HG medium. The cells were harvested for protein extraction after 8 hr of culturing in HG medium. The same experimental procedure was repeated using mesangial cells obtained from C57B6 mice (3).
Transfection of small interfering RNA (siRNA)
A 6-well tissue culture plate was seeded with 2×10⁵ hepatoma cells/well in HG medium (450 mg/dL D-glucose). Cells were incubated at 37℃ in a CO2 incubator overnight until they reached 60%-80% confluence and cells were then treated with bilirubin (0.3 mg/dL) or vehicle (DMSO). Transfection of LXRα siRNA (Labome TF711433, NJ, USA) was performed 8 hr after bilirubin treatment. The cells were divided into the following groups: untreated HC control cells (no bilirubin or siRNA treatment), HL cells transfected with LXRα siRNA, and BilC cells treated with bilirubin but not transfected with siRNA.
Protein extraction and Western blotting
Tissues and cells were homogenized in 10 mM Tris-buffered saline (20 mM Tris-HCl pH 7.4, 0.25 M sucrose, and 1 mM EDTA) in the presence of a protease inhibitor cocktail and were then centrifuged. Proteins were extracted and were then quantified using a bicinchoninic acid protein assay kit (Thermo Fisher Scientific, IL, USA). Aliquots of 80 µg were loaded onto a SDS-polyacrylamide gel and transferred to nitrocellulose paper after electrophoresis. The membrane was incubated overnight in 5% non-fat milk with the following primary antibodies: anti-collagen IV (sc-11360), anti-actin (sc-1616), anti-NOX 4 (sc-20141), anti-p22phox (sc-20781), anti-SREBP-1 (sc-367), anti-LXRα (sc-1202), anti-SCD-1 (sc-14720), and anti-FAS antibody (sc-1023) (Santa Cruz Biotechnology, Santa Cruz, CA, USA). Blots were incubated with horseradish peroxidase-conjugated secondary antibodies (Santa Cruz) and bands were visualized using an enhanced chemiluminescence substrate (Thermo Fisher Scientific). The densities of the bands were quantified using the GS-700 Imaging Densitometer (Bio-Rad, CA, USA) and their values were normalized to that of actin in the control.
Statistical analysis
The results were calculated as the mean±standard deviation. The statistical analyses were performed using SPSS software (version 21.0, IBM, NY, USA). The difference of continuous variables between the groups was analyzed using analysis of variance or Student's t-test, according to the number of groups. P values <0.05 were considered statistically significant.
RESULTS
Physiologic data
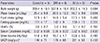
Prior to diabetes induction, body weights, food and water intake, and the levels of serum fasting glucose, HbA1c, and creatinine, as well as urine volumes and urine albumin to creatinine ratios of SD rats did not significantly differ between the groups (Table 1). Three days after STZ injection, the rats in the DM and Bil groups were confirmed to have induced diabetes, as defined by a fasting glucose level of 300 mg/dL or greater (DM: Bil group = 416±55:397±35 mg/dL, P = 0.724). The serum creatinine was increased to 0.71±0.22 mg/dL in the DM group during the 5 weeks following diabetes induction, a higher level compared to that of the Bil group (0.45±0.02 mg/dL, P = 0.025). The levels of fasting glucose and HbA1c, on the other hand, were not different between the DM and Bil groups (Table 2). The amount of 24-hr urine albumin tended to be higher in the DM group than in the Bil group; however, no statistical difference was observed in rats once they were sacrificed. The levels of 24-hr urine albumin and serum creatinine did not differ significantly between the control and Bil groups (ANOVA and post-hoc Tukey test, P = 0.613 and P = 0.810, respectively).
Renal pathology and ROS
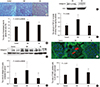
We measured the ratio of mesangial matrix area to glomerular area in each rat to estimate the severity of diabetic change (Fig. 1A). The area ratios were the highest in the DM group, followed by the Bil and control groups, respectively (16.5±0.78:15.2±0.68:14.3±0.98%, P = 0.002) (Fig. 1B). These data correlated with the protein expression of collagen IV in kidney tissue (Fig. 1C and D). The relative levels of collagen IV protein normalized to actin were increased 2.33±1.12-fold in the kidneys of the DM group compared to control group. This effect was attenuated by bilirubin treatment (0.98±0.53 folds). Bilirubin treatment (0.3 mg/dL of medium) of mesangial cells under HG conditions also reduced the levels of collagen IV protein (Fig. 1E). The level of the profibrotic protein TGFβ1, which was increased in the kidneys of DM rats, were attenuated by bilirubin (control:DM: Bil group=2.27±0.34:3.66±1.12:2.20±0.16 pg/ 100 mg protein, P = 0.006) (Fig. 1F). The proportion of apoptotic cells present in glomeruli was increased in DM rats, but bilirubin treatment mitigated this increase (control:DM:Bil group=12.8±0.3: 22.3±1.4:16.3±1.3%, P < 0.001) (Fig. 1G and H).
The renoprotective effect of bilirubin was accompanied by a reduction in the level of ROS such as hydrogen peroxide (Fig. 2A). The protein levels of NADPH oxidase subunits NOX4 and p22phox were also reduced in renal tissues (Fig. 2B). Bilirubin decreased the expression of NOX4 and p22phox to 23.9%±11.9% (Fig. 2C) and 61.9%±26.9% (Fig. 2D) in diabetic rats, respectively.
The effect of bilirubin on dyslipidemia in diabetic rats.
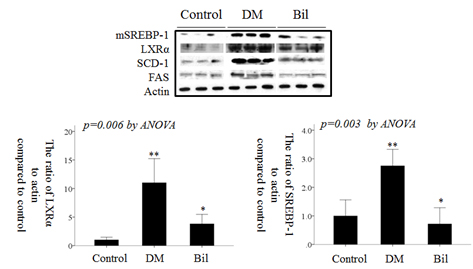
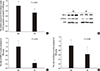
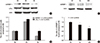
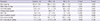
Serum lipid levels were elevated in DM rats (Table 3). Total cholesterol, HDL-C, free fatty acid, and TG levels were increased in the DM group. However, bilirubin treatment effectively attenuated the severity of dyslipidema. Of the lipids evaluated in sera, TGs were increased to the greatest extent in the DM group, 14.7±5.0-fold compared to the control group (P < 0.001, ANOVA and post-hoc Tukey test). TG levels in the Bil group were not markedly different from that of the control group (P = 0.410, ANOVA and post-hoc Tukey test). TGs, which are synthesized in liver, were increased by 1.19±0.02-fold compared to control group (P = 0.005, ANOVA and post-hoc Tukey test) in liver tissues. Levels of the mature form of SREBP-1 (mSREBP-1, 68 kDa, detected by anti-SREBP1 antibody sc-367), which is cleaved from precursor SREBP-1 (125 kDa, detected by anti-SREBP1 antibody sc-367), and its downstream proteins, SCD-1 and FAS, were enhanced under diabetic conditions. The upstream factors mSREBP-1 and LXRα were also increased in the kidneys (Fig. 3A) and livers of DM rats (Fig. 3B). The protein levels of LXRα and mSREBP-1 in the DM group were increased by 11.0±4.23-fold (Fig. 3C) and 2.75±0.58-fold (Fig. 3D), respectively, in kidney tissues and by 1.42±0.26-fold (Fig. 3E) and 4.41±1.68-fold (Fig. 3F) in liver tissues compared to control group. These increases in mSREBP-1 and LXRα protein levels were significantly attenuated by bilirubin injection. The levels of SCD-1 and FAS showed a similar trend as mSREBP-1 in DM rats before and after bilirubin injection (Fig. 3A and B).
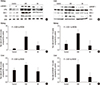
In mesagnial cells, bilirubin treatment did not change the protein levels of mSREBP-1 and LXRα (data not shown). However, in hepatoma cell lines, the protein levels of mSREBP-1 and LXRα were increased when they were cultured in HG medium, but this effect was attenuated by bilirubin treatment (Fig. 4A). The fold-changes of mSREBP-1 and LXRα expression are shown in Fig. 4C. Transfection of LXRα siRNA suppressed the expression of mSREBP-1; however, the LXRα siRNA was not as effective as bilirubin in suppressing mSREBP-1 expression (Fig. 4B and D). These data suggest that the suppressive effect of bilirubin on mSREBP-1 protein levels depended not only on the suppression of LXRα, but also on another pathway, such as direct suppression of mSREBP-1 expression.
DISCUSSION
In this study, bilirubin attenuated renal dysfunction, decreased mesangial matrix, TGF-β1 production, and apoptosis in the glomeruli of diabetic kidneys, and reduced TGF-β1 production in mesangial cells cultured in HG medium. The renoprotective effect of bilirubin was attributed to not only the suppression of NADPH oxidase levels and ROS production in the kidneys, but also to attenuation of dyslipidemic genes in the sera, kidneys, and livers of diabetic rats. Bilirubin suppressed lipogenic genes, LXRα, mSREBP-1, FAS, and SCD-1 in kidney and liver tissues.
In this experiment, the serum creatinine level in DM rat increased at 5 weeks after streptozotocin injection, which was manifested earlier compared to the other report (16). Streptozotocin induces DNA damage in the kidney lasted for 20 days after treatment (17) and provoked acute nephrotoxic effect with a single of 65 mg/kg injection into rats (18). Nevertheless, the toxic effect could not explain all the changes in the kidney because the kidneys are known to recover from acute mild nephrotoxic effects within 3 weeks after STZ injection (17) and we sacrificed the rats at 5 weeks after injection. Also, the pathologic change in the kidney of DM rat showed typical diabetic changes, such as increase of mesangial extracellular matrix. In other reports, serum creatinine was increased at 42-56 days after injection streptozotocin into rats with typical diabetic changes in the kidney (19,20,21). Therefore, the changes of renal function and albuminuria in this study would be mainly from diabetic nephropathy and, from toxic effect by streptozotocin in minor aspect.
The serum TG level was decreased to a greater extent by bilirubin treatment than were the levels of cholesterol, HDL-C, and free fatty acids in this study. Recently, Blumer et al. (22) evaluated the lipid status in Gilbert's syndrome and the association between serum bilirubin and lipids in clinical studies. Lower concentrations of total cholesterol and TG and a higher concentration of HDL-C were found in individuals with higher bilirubin concentration (22). Decreasing HDL-C concentration with increasing bilirubin has been reported in only one study (6). In studies using the hyperbilirubinemic Gunn rat, total cholesterol and TG were also decreased (3, 23, 24). In contrast to the results in humans and similar to the results of our study, HDL-C in Gunn rats is lower than in genetic control (23). Notably, in every study examining the relationship between bilirubin and lipid status in healthy subjects, reduced TG and elevated bilirubin levels were reported (22). That relationship was confirmed in this animal-based study. In mammals, biosynthesis of cholesterol, fatty acids, and TGs is regulated by SREBPs (25). Two SREBP encoding genes, SREBP-1 and SREBP-2, exist. SREBP-1 generates two proteins, SREBP-1a and SREBP-1c. SREBP-1 regulates free fatty acid and TG metabolism and promotes acetyl-CoA carboxylase, FAS (26), SCD (27), and LDL receptor (28). The transcription of SREBP-1c is primarily induced by insulin and mediated by a phosphatidylinositol 3'-kinase (PI3K) dependent pathway (29) and by the activation of LXRα (30). LXRα induces the expression of genes involved in cholesterol efflux and clearance (31) and induction of SREBP-1c by binding retinoid X receptor/LXR DNA-binding sites in the SREBP-1c promoter (32).
Increased renal expression of SREBP-1c has been implicated in diabetic and hyperlipidemia-associated nephropathies through activation of ROS, NADPH oxidase, and TGF-β (33). The absence of SREBP-1c completely abolishes the increase of albuminuria induced by diabetes in STZ-treated mice (34). In diabetic db/db mice, n-3 polyunsaturated fatty acid-mediated SREBP-1 attenuation in the kidney improved albuminuria and renal dysfunction (35). Even in the absence of hyperglycemia or hyperlipidemia, increased renal expression of SREBP-1a resulted in renal accumulation of lipid and increased TGF-β, plasminogen activator inhibitor 1, and vascular endothelial growth factor, leading to renal hypertrophy, accumulation of extracellular matrix proteins, and mesangial expansion (36). SREBP-1 directly binds to the TGF-β promoter in cultured mesangial cells in HG medium (37).
Consistent with the findings of previous studies, we confirmed that bilirubin injection into STZ-induced type I diabetic animals improved renal functional derangement and morphologic changes, as well as decreased ROS production by suppressing the levels of NADPH subunits. Fujii et al. (4) used Gunn rats and biliverdin-treated db/db mice to verify the renoprotective effects of bilirubin and biliverdin on diabetic nephropathy (4). Both rodent models had less albuminuria and they were protected against progression of mesangial expansion. Moreover, levels of TGF-β, fibronectin, ROS, and NADPH oxidase subunits were normalized in the kidney (4). Our study showed bilirubin decreased serum cholesterol and both serum and hepatic TG. This effect was accompanied by suppression of SREBP-1, its upstream regulator LXRα, and downstream factors FAS and SCD-1 in the kidney and liver. Knockdown of LXRα by siRNA decreased SREBP-1 expression, but did so to a lesser degree than bilirubin treatment in hepatoma cells, implying that bilirubin directly suppressed SREBP-1 expression or other LXRα-independent pathways. Therefore, the renoprotective effect of bilirubin in diabetic rats resulted not only from scavenging ROS and suppressing NADPH oxidase subunits, but also by attenuating diabetes-induced renal dyslipidemia. Notably, HDL-C levels were altered by bilirubin in this study. As previously mentioned, Gunn rats have a lower level of HDL-C than genetic controls, which is similar to rats injected with bilirubin. One mechanism by which HDL-C is decreased by bilirubin might involve decreased expression of ATP-binding cassette transporter A1 (ABCA1). HDL-C is assembled from apolipoprotein A1, cholesterol, and phospholipids by a reaction mediated by ABCA1 (38). Overexpression of hepatic ABCA1 raises HDL-C levels (39). Exon 1 of the ABCA1 gene contains an LXR response element, through which LXR regulates ABCA1 in peripheral tissue (38). However, the liver-specific ABCA1 gene lacks exon 1 and possesses a functional SREBP response site in the upstream region of exon 2 (38). Therefore, suppressed expression of LXR and SREBP-1 by bilirubin would decrease expression of ABCA1, decreasing HDL assembly in the livers and in peripheral tissues of rats, such as fatty tissues or kidneys.
In conclusion, bilirubin attenuated renal dysfunction and dyslipidemia in diabetes by suppressing levels of LXRα and SREBP-1 and oxidative stress.

 XML Download