

 PDF
PDF Citation
 Print
Print


INTRODUCTION
Increased consumption of renal oxygen and/or decreased renal oxygen supply (also called renal hypoxia) with increased oxidative stress is believed to be an important contributor in renal disease progression (1). In experimental animal models with kidney disease, the oxygen content is reduced throughout the kidney. Microelectrode measurement revealed that the oxygen tension (pO2) in whole renal parenchyme, especially in the renal medulla, was lower in the type I diabetic animal model induced by streptozotocin than in the non-diabetic control (2). In a remnant kidney model, tubular hypoxia, a representative model of chronic progressive renal disease, was developed in the early phase of the disease without any histological interstitial change (3). Experiments with acute kidney injury models induced by cyclosporin (4), gentamicin (5), ischemia-reperfusion injury (6), or other stimuli, as well as with chronic renal injury models, including chronic tubulointerstitial disease (7), showed that hypoxia has an important pathophysiological role in the progression of renal diseases. In addition, hypertensive rats had lower pO2 in the lumens of proximal and distal tubules than normotensive Wistar Kyoto rats (8). Renal tubulointerstitial hypoxia stimulates fibrogenesis with the production of collagen I and α-smooth muscle actin, induces epithelial-mesenchymal trans-differentiation (1), and stimulates infiltration and maturation of immune cells to generate inflammation (9). The kidney has the lowest physiological pO2 compared with other organs despite receiving the largest fraction of the cardiac output (10). This can be attributed to diffusional shunting of oxygen between descending arterial vasa rectia and ascending venules in the renal medulla (11), and the oxygen content between 10 and 20 mmHg in the renal outer medulla and less than 10 mmHg in the renal inner medulla (10, 12).
Hypoxia-inducible factor (HIF) is a master gene involved in the regulation of hypoxia; it induces the expression of genes controlling oxygen delivery, vascularization, and glucose metabolism (13). The primary mechanism of HIF activity regulation is through oxygen-dependent proteasomal degradation of the HIF-α subunit (10, 14). Non-hypoxic stimuli have been reported to induce and activate HIF-α (15). Phosphoinositide 3-kinase (PI3K) pathway and its downstream effectors, mTOR and P70S6 kinase, mediate increase in HIF-1α translation (15). P70S6K regulates the translation of a group of messenger RNAs (mRNAs) possessing a 5'-terminal oligopyrimidine tract, such as HIF-1α mRNA (15), which is the main effector mechanism responsible for HIF-1α induction by angiotensin II (16) and lipopolysaccaride in macrophages (17). Moreover, activation of p42/p44 MAPK is sufficient to promote the transcriptional activity of HIF-1 (18). Reactive oxygen species (ROS) have been reported to be involved in the oxygen-sensing mechanism (19). Superoxide inhibited hypoxia-dependent increase in the HIF-1α levels in the renal interstitial cells (19) and hydrogen peroxide (H2O2) blunted the increase in HIF-1α under hypoxia (20). Several experiments have reported that the subunits of NADPH oxidase, which are one of the major sources to generate ROS, were related to HIF-1α expression in response to hypoxia in the renal interstitial cells (19) or the A549 cells (21).
Bilirubin has been reported to be an effective antioxidant, and its level is directly proportional to the total serum antioxidant capacity in humans (22). Recently, there have been increasing evidences about the beneficial effects of the physiological level of bilirubin on diabetes, diabetic complication, and renal diseases. Higher serum bilirubin is associated with reduced risk of diabetes mellitus (23, 24, 25) and diabetic nephropathy (23, 26, 27); it is correlated with lower incidence of hypertension in normotensive men (28) and lower incidence of end-stage renal disease in IgA nephropathy (29). Bilirubin attenuates renal injury in cyclosporine-induced nephropathy (30) and ischemia-reperfusion injury (31, 32), reduces the streptozotocin-induced pancreatic damage in the Gunn rat (12), and protects rodents against diabetic nephropathy by inhibiting oxidative stress and the downregulation of NADPH oxidase (27).
In this study, we investigated the effect of bilirubin on HIF-1 expression under physiological oxygen concentration (approximately 5%) in the proximal tubular cells and the possible mechanism of HIF-1 regulation by bilirubin in human proximal tubular cells in vitro.
MATERIALS AND METHODS
Cell culture
The proximal tubular epithelial cells derived from the human kidney (HK2) cells (ATCC CRL-2190) were cultured in Renal Epithelial Basal Medium (Lonza Walkersville, MD, USA) with recommended supplements. We used HK2 cells passaged 10-25 times for the experiments. The cells were cultured in room air with 5% CO2 condition or in 5% O2 condition with 95% CO2 condition. We used 5% O2 condition (O2 pressure approximately 38 mmHg) as similar O2 tension as in the proximal tubules of a normal kidney. With 70%-80% cell confluence under 21% O2 condition, the cells were cultured for 1-5 hr under 5% O2 condition with or without H2O2, or bilirubin (Sigma #B4125, MO, USA) by dissolving the cells in dimethyl sulfoxide. The cells were treated with the chemicals wortmannin (100 nM; Merck 681675, NJ, USA), Ly294002 (20 µM; Merck 440202, NJ, USA), rapamycin (10 nM; Merck 440202, NJ, USA), miltefosine (5 µM; Merck 440202, NJ, USA), catalase (1,000 U/mL; Sigma #C9447, MO, USA), diphenylene iodonium (DPI, 10 µM; Calbiochem #3003260, CA, USA), and actinomycin D (0.15 µg/mL; Sigma #856258, MO, USA) for 15 min before culturing in 5% O2 condition. Transfection of small interfering RNA (siRNA) for NOX4 gene (Santa Cruz sc-41586, CA, USA) or p22phox gene (Santa Cruz sc-36149, CA, USA) into 2×10⁶ HK2 cells in 10-cm-diameter culture dishes was performed as per the manufacturer's recommendation 24 hr prior to culturing under 5% O2 condition.
Detection of ROS generation
Oxidation-sensitive 2',7'-dicholorofluorescein diacetate (H2DCF-DA; Sigma, MO, USA) was used to measure the intracellular production of ROS. Cells were incubated with 10 µM H2DCF-DA at 37℃ for 30 min, washed, collected by scraping, and resuspended in phosphate-buffered saline (PBS). The fluorescence intensity was measured using a fluorescence spectrophotometer at excitation and emission wavelengths of 490 nm and 526 nm, respectively.
Western blotting
Western blotting was conducted as described in a previous study (30). The cells were harvested and lysated. The protein concentration was measured using a bicinchoninic acid assay kit (Thermo Fisher Scientific, IL, USA). The protein samples were run on sodium dodecyl sulphate (SDS)-polyacrylamide mini-gels (Bio-rad Mini Protean III) and then transferred onto nitrocellulose membranes by electroelution. Antibodies used in this study included anti-HIF 1α (#610958), anti-caspase 9 (#551246) (BD Bioscience, NJ, USA), anti-ERK 1/2 (#4696), anti-phospho-ERK 1/2 (#9101), anti-AKT (#9272), anti-phospho-AKT (Ser473) (#9271), anti-phospho-mTOR (#5536) (Cell Signaling Technology, MA, USA), anti-mTOR (Thermo Scientific Pierce, PA1-518, IL, USA), anti-RAPTOR (Abcam ab5454, CA, USA), anti-actin (sc-1616), anti-NOX 4 (sc-20141), anti-p22phox (sc-20781), anti-p47phox (sc-14015), and anti-p67phox antibody (sc-15342) (Santa Cruz, CA, USA). Incubation with horseradish peroxidase-conjugated secondary antibodies (Santa Cruz, CA, USA) was followed by band visualization using an enhanced chemiluminescence substrate (Thermo Fisher Scientific, IL, USA). The density of the bands was quantified by the GS-700 Imaging Densitometry (Bio-rad, CA, USA), and their values were normalized to that of the actin protein in the control.
RNA extraction and reverse transcription-polymerase chain reaction (RT-PCR)
Total RNA from the cells was isolated using the Trizol-Reagent (GIBCO, CA, USA). The RNA was dried, re-dissolved, and quantified by spectrophotometry. cDNA was generated from 200 ng of total RNA by the SuperScript® III First-Strand Synthesis System (Invitrogen 18080-051, CA, USA), according to the manufacturer's instructions. The mRNA expressions of HIF-1α, actin, GLUT-1, p22phox, p67phox, and NOX4 were determined by RT-PCR using the following primers: HIF-1α (forward 5'-CAGTTTCTGTGTCGTTGCTGC-3' (reverse) 5'-ACTTTCCTCAGTCGACACAGC-3', GLUT-1 (forward) 5'-ACAAACAGCGACACGACAGTG-3' (reverse) 5'-TCATCATCGGTGTGTACTGCG-3', p22phox (forward) 5'-CTGCTTGATGGTGCCTCCGAT-3' (reverse) 5'-ACTTTGGTGCCTACTCCATTG-3', p67phox (forward) 5'-CCACTGTGTTCTCACACCACA-3' (reverse) 5'-GCTTGTTCCCTGCAACTACCT-3', NOX4 (forward) 5'-TACAGGCACAAAGGTCCAGAA-3' (reverse) 5'-CAAGATACCGAGATGAGGATC-3', and actin (forward) 5'-CGGGGTCACCCACACTGTGCC-3' (reverse) 5'-GTACTTGCGCTCAGGAGGAGC-3'. PCR was performed using the TaKaRa Ex Taq (Magnesium-free) buffer (Takara'Bio Inc., RR01AM, Shiga, Japan). The density of the bands was quantified by densitometry, and the values obtained were normalized to that of the gene of the control sample and compared between the samples.
Statistical analysis
The results were calculated as mean±standard deviation. The statistical analyses were performed using SPSS (version 21.0, IBM, NY, USA). The difference of continuous variables between the groups was analyzed by using a method of analysis of variance or Student t-test, according to the number of groups. The level of statistical significance was defined as a P value of <0.05.
RESULTS
Bilirubin effect on HIF-1α protein expression
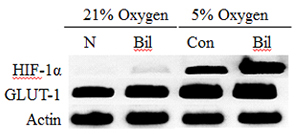
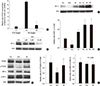
In HK2 cell cultured under 5% O2 condition, the HIF-1α protein expression was increased by bilirubin treatment at 0.01-0.2 mg/dL concentration (Fig. 1A). Addition of a small amount (0.01 mg/dL) of bilirubin to the HK2 cell culture media was sufficient for successful induction. We used 0.1 mg/dL of bilirubin because, with ≥0.1 mg/dL bilirubin, the inhibitory effect of NADPH subunits of bilirubin was detectable (Fig. 1B). Bilirubin steadily increased HIF-1α expression in HK2 cells after 1-hr treatment (Fig. 1C), until 5 hr (Fig. 1D).
Bilirubin increased HIF-1α protein transcription
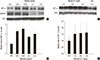
Actinomycin D restrains gene transcription by inhibiting RNA chain elongation by RNA polymerase. It inhibited the increase in HIF-1α protein concentration by bilirubin treatment in HK2 cells cultured under 5% O2 condition. The expression of HIF-1α protein in cells with 0.1 mg/dL bilirubin was increased by 1.57±0.21 folds (Fig. 2A), which was otherwise decreased by 0.66±0.09 folds by actinomycin D (Fig. 2B), as compared to that in the control cells.
The mRNA expression of HIF-1α was increased by 1.69±0.05 folds in the cells with 0.1 mg/dL bilirubin under 5% O2 condition, as compared to that in the control cells (Fig. 2C and D). The mRNA of GLUT-1, a downstream gene of HIF-1α, was also increased by bilirubin treatment. Under 21% O2 condition, bilirubin slightly increased the mRNA expression of HIF-1α and GLUT-1.
Mechanism of increase in HIF-1α transcription by bilirubin
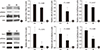
We added inhibitors of PI3K (wortmannin and Ly294002), mTOR complex-1 (rapamycin), and PI3K/AKT pathway (miltefosine) 15 min prior to bilirubin treatment. None of the inhibitors effectively suppressed the increase in HIF-1α protein expression by bilirubin in the HK2 cells cultured under 5% O2 condition (Fig. 3). Therefore, we investigated an alternate mechanism such as the one involving anti-oxidative effect of bilirubin on HIF-1α expression.
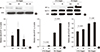
The endogenous H2O2 concentration was more in 5% O2 condition than in 21% O2 condition; the concentration decreased with bilirubin treatment of the HK2 cells (Fig. 4A). The expression of HIF-1α protein was decreased by exogenous H2O2 (10 µM) in HK2 cells cultured under 5% O2 condition (Fig. 4B). Cells to which both bilirubin and scavenger of superoxide or H2O2 were added increased the HIF-1α concentration more as compared to the cells treated with bilirubin only (Fig. 4C and D).
Exogenous H2O2 concentration decreased the phosphorylation of P70S6 kinase in HK2 cells under 5% O2 condition; this effect was completely reversed by bilirubin treatment (Fig. 4E and F). However, addition of bilirubin was not related to increased mTOR protein phosphorylation (Supplement Fig. 1). ERK1/2 phosphorylation was not influenced by H2O2 or bilirubin (Fig. 4E and F). The expressions of NADPH oxidase, an important source of ROS, effectively decreased the protein level and mRNA level by bilirubin treatment (Fig. 5). We therefore analyzed whether the inhibition of NOX4 and p22phox by siRNA transfection would increase HIF-1α mRNA expression. Transfection of siRNA for NOX4 gene significantly increased HIF-1α mRNA expression as compared to that in the control cells. However, the extent of increase in HIF-1α mRNA expression by siRNA was lower than that after bilirubin treatment (Fig. 6). The siRNA of p22phox did not increase HIF-1α protein expression of HK2 cells (data not shown).
Effect of bilirubin on apoptotic signals
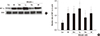
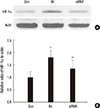
Bilirubin treatment increased the phophorylation of AKT and decreased the cleavage of caspase 9 protein (Fig. 7).
DISCUSSION
Bilirubin treatment increased the HIF-1α expression in HK2 cells cultured under 5% oxygen content, similar to the oxygen condition of proximal tubular cells in kidney, that is, approximately 38 mmHg. Bilirubin increased HIF-1α transcription, which was otherwise attenuated by actinomycin D treatment. The enhancement of HIF-1α protein expression by bilirubin was partly because of attenuation of decreased phosphorylation at P70S6 kinase by ROS and partly because of inhibition of NOX4 expression, and resulted in decreased cleavage of caspase 9 protein. Induction of HIF-1α protein by bilirubin may not be related to the activation of PI3K/mTOR, PI3K/AKT, or ERK 1/2 pathways.
In animal experiments, re-oxygenation was necessarily performed for a few minutes during sacrification and tissue manipulation; this step may have resulted in HIF degradation in the kidney (6). As a result, HIF was not detected in the kidney tissue of animals raised under hypoxia (6). The HIF protein concentration in animal experiments could only be verified with exaggerated stimuli such as anemia, cobaltous chloride, or monoxide (6). Accordingly, we performed an in vitro experiment with human proximal tubular cells cultured in 5% oxygen contents (around 38 mmHg pO2), to verify the effect of bilirubin and ROS on the expression of HIF in physiologic oxygen content around renal proximal tubule as in the kidney tissue. Previous studies have shown that the pO2 values averaged 40-42 mmHg in the proximal and distal tubules, 30 mmHg in the outer medulla, and 48 mmHg in the efferent arteriole in vivo (11). HIF, a mediator of transcriptional response to hypoxia, is expressed in different renal cell populations (6). HIF-1α was mainly induced in tubular cells, distal tubules, and collecting ducts with stimuli of anemia, cobaltous chloride, and/or carbon monoxide (6). HIF-2α was expressed in the endothelial and interstitial cells as well as in a small set of glomeruli (6).
Bilirubin induced HIF-1α protein transcription and H2O2 suppressed HIF-1α protein transcription. Addition of even a small amount (0.01 mg/dL) of bilirubin to the HK2 cell culture media was sufficient for successful induction. We used 0.1 mg/dL of bilirubin because, with ≥0.1 mg/dL bilirubin, the inhibitory effect of NADPH subunits of bilirubin was detectable. ROS may be involved in the response to hypoxia because the formation of ROS requires molecular oxygen (34). Treatment of purified HIF-1 with oxidative agent and H2O2 diminished HIF-1 DNA binding capacity, which suggests that reducing conditions may promote HIF-1α activity under hypoxia (34, 35, 36). Addition of H2O2 to cells resulted in destabilization of the HIF-1α protein in Hep3B cells (37) and decreased target gene expression of HIF-1α in immortalized rat proximal tubular cells (20). Increased superoxide anion by xanthine/xanthine oxidase decreased HIF-1α protein in renal medullary intercalated cells (RMIC) (19). The possible mechanism of ROS on HIF-1α expression suggest that it may primarily occur at post-transcriptional level because increased superoxide levels did not affect hypoxia-induced up-regulation of HIF-1α mRNA in RMIC (19) and abolished the increase of HIF-1α protein induced by CBZ-LLL (N-carbobenzoxyl-L-leucinyl-Lleucinyl-L-norvalinal), which is a selective ubiquitin-proteasome inhibitor (19). However, the effects of ROS or activation of NADPH oxidase could increase the HIF-1 expression in other conditions, such as human lung A549 cell lines cultured in 1% oxygen content (38). This difference would be from different setting of experiment, although the exact mechanism is not verified. In this study, P70S6K phosphorylation mediating increased HIF-1α protein translation, a downstream effector of PI3K (16, 17), was attenuated by exogenous H2O2. Exogenous H2O2 decreased phosphorylation of mTOR complex-1 in HK2 cells cultured under 5% oxygen concentration. Therefore, ROS may have affected post-transcriptional regulation of HIF-1α protein through modulation of PI3K/mTOR/P70S6K pathway. The NADPH oxidase activity significantly contributed to this post-transcriptional regulation of HIF-1α in intercalated cells under physiological conditions (34). Deletion of p22phox protein by antisense oligodeoxynucleotide increased HIF-1α protein concentration in RMIC (19), whereas, in adenocarcinomic human alveolar basal epithelial (A549) cells, NOX1 overexpression enhanced HIF-1α protein to hypoxic stimuli (21). The results of this study revealed that antisense oligodeoxynucleotide for NOX4 increased HIF-1α mRNA expression in HK2 cells. The different subunits of NADPH oxidase have different effect on HIF-1α expressions in different cell lines; this aspects need further studies for understanding the possible mechanisms involved. Bilirubin concentration of 0.1 mg/dL effectively decreased H2O2 level and suppressed mRNA and protein level of NADPH oxidase subunits, NOX4, p22phox, and p67phox in HK2 cells cultured under 5% oxygen condition. The possible mechanism of increased HIF-1α expression by biliribuin may include increase in the transcription of HIF-1α by suppression of NAPDH oxidase subunits, especially of NOX4, and modification of post-transcriptional regulation of HIF-1α protein by reverse P70S6 kinase activity decreased by ROS under 5% oxygen concentration. However, in this study, bilirubin was not found to enhance phosphorylation of P70S6 kinase through the activation of PI3K/mTOR pathway. Furthermore, the inhibitors of PI3K/mTOR, PI3K/AKT, and ERK 1/2 pathways did not attenuate increased HIF-1α protein by bilirubin treatment in HK2 cells. Therefore, the effect of bilirubin on HIF-1α may not be directly associated with PI3K/mTOR, PI3K/AKT, and ERK 1/2 pathways, although bilirubin increased the phosphorylation of AKT. The effect of bilirubin on HIF-1α protein activation was assessed by measuring the expression of anti-apoptotic protein, phopho-AKT, and pro-apoptotic protein, cleavaged caspase 9; we found that HIF-1α activation was related to decrease in pro-apoptotic signal. There were debatable results of HIF-1α activation on fibrosis and progression of kidney injury. In a remnant kidney injury model, HIF activation by DMOG attenuated the progression of proteinuria and structural damage in podocyte, accompanied with reduction in inflammation and fibrosis (5). However, the negative aspect of HIF activation included genetic ablation of epithelial HIF-1α, which inhibited the development of tubulointerstitial fibrosis in unilateral ureteral obstruction animal model (39). HIF-1-induced Twist expression, an important factor of promoting epithelial-to-mesenchymal transition (EMT) in cancer and in hypoxic tubular cells; it also played a role in EMT during renal fibrogenesis (40).
In conclusion, bilirubin enhances HIF-1α mRNA transcription by attenuating ROS and subunits of NADPH oxidase in HK2 cells cultured under physiological oxygen concentration. Bilirubin would influence on the post-transcriptional modification of HIF-1α protein expression through attenuation of the effect of ROS on the suppression of P70S6K pathway, which needs further studies.

 XML Download