

 PDF
PDF Citation
 Print
Print


INTRODUCTION
Inflammation is an inevitable phenomenon in all forms of acute and chronic kidney diseases, regardless of the underlying cause. Renal proximal tubular epithelial cells are an important source of cytokines/chemokines and play a central role in the regulation of the local inflammatory response (1). Tumor necrosis factor-α (TNF-α) is a pleiotropic cytokine that has been implicated in the inflammatory cascade leading to renal injury. TNF-α is not typically detected in normal kidneys. However, renal tubular epithelial cells express TNF-α after noxious stimulation (2). TNF-α increases vascular permeability, the expression of adhesion molecules on endothelial cells, cytokine and chemokine release, and the production of reactive oxygen species (ROS) (3, 4, 5). TNF-α has been shown to increase ROS production through the NADPH oxidase-like system or the cytosolic phospholipase A2-linked cascade in various cells (6, 7). The inflammatory response to TNF-α is mediated through the nuclear factor-kappa B (NF-κB) pathway, and NF-κB activation leads to cytokine and chemokine production in renal tubular epithelial cells, including monocyte chemoattractant protein-1 (MCP-1) and regulated on activation normal T cell expressed and secreted (RANTES) (2, 8).
The effect of cobalt chloride (CoCl2) on inflammation has rarely been reported. CoCl2 has been used to induce inflammation in in vitro experiments (9, 10). CoCl22 was the first metal ion identified with a hemeoxygenase-1 (HO-1)-inducing property (11). HO-1 is the rate-limiting enzyme in the degradation of heme, and its products, including biliverdin and carbon monoxide (CO), have anti-oxidant and anti-inflammatory effects (12, 13). The administration of heme protein to HO-1-/- mice has been shown to result in severe renal interstitial inflammation accompanying a drastic upregulation of MCP-1 and NF-κB expression (12). The constitutive expression of HO-1 has been shown to reduce MCP-1 production induced by albumin in renal proximal tubular epithelial cells (14). Collectively, CoCl2 has shown mixed results, with both pro-inflammatory and anti-inflammatory effects. Therefore, we investigated the role of CoCl2 in an experiment of TNF-α- and interferon gamma (IFN-γ)-induced NF-κB activation, cytokine production, and ROS production in renal tubular epithelial cells. We also attempted to determine the role of HO-1 in the generation of inflammatory cytokine production induced by TNF-α and IFN-γ.
MATERIALS AND METHODS
Cell culture
HK-2 cells (ATCC CRL-2190), which are proximal tubular epithelial cells derived from normal human kidney tissue, were cultured using Renal Epithelial Basal Medium (Lonza Walkersville Inc., Walkersville, MD, USA) with the recommended supplements included in the EGM® SingleQuot Bullet Kit. Cells were fed two to three times weekly and subcultivated via trypsinization when near confluence. HK-2 cells between passages 10 and 25 were used for these experiments.
Cell treatment
Cells were grown to 80% confluence before treatment for all experiments. TNF-α (R&D Systems Inc., Minneapolis, MN, USA) and IFN-γ (PeproTech Inc., Rocky Hill, NJ, USA) were dissolved in phosphate-buffered saline (PBS) containing 0.1% bovine serum albumin. CoCl2 (Sigma, St. Louis, MO, USA) was dissolved in PBS.
The cells were divided into four groups: 1) control cells (C), 2) TNF-α/IFN-γ-treated cells (TI), 3) TNF-α/IFN-γ-treated cells with CoCl2 pre-treatment (TIC), and 4) CoCl2-pre-treated cells (Co). For the inhibition of HO-1, two additional groups were added: 5) TNF-α/IFN-γ-treated cells with CoCl2 pre-treatment and negative control small interfering RNA (siRNA) transfection (TICN) and (6) TNF-α/IFN-γ-treated cells with CoCl2 pre-treatment and HO-1 siRNA transfection (TIC-HO-1). Before the experiments, the cells were incubated in basal medium in the absence of supplements for 24 hr. On the day of the experiment, the cells were pre-treated with 150 µM CoCl2 for 24 hr to activate HO-1. The cells were then treated with 5 ng/mL TNF-α and 50 ng/mL IFN-γ for an additional 24 hr. To evaluate the relationship between NF-κB activation and TNF-α/IFN-γ-induced RANTES or MCP-1 production, HK-2 cells were pre-treated in the absence or presence of the NF-κB inhibitor pyrrolidinedithiocarbamate (PDTC, 10, 15, 20, or 25 µM) (Sigma, St. Louis, MO, USA) for two hr before exposure to TNF-α/IFN-γ.
Western blotting analysis
Western blotting was performed as previously described (15). Nuclear extracts were prepared from the HK-2 cell lysates using a nuclear extraction kit (Sigma, St Louis, MO, USA). Protein concentrations were measured using a bicinchoninic acid protein assay kit (Thermo Fisher Scientific, Rockford, IL, USA). The samples were run on SDS-polyacrylamide mini-gels (Bio-Rad Mini-Protean III), and the proteins were transferred to nitrocellulose membranes by electroelution. Antibodies to phosphorylated NF-κB p65 (p-NF-κB p65) (Ser276) (Cell Signaling Technology, Danvers, MA), NF-κB p65 (Santa Cruz Biotech, Santa Cruz, CA, USA), inhibitor of kappa B-α (IκBα) (Santa Cruz Biotech, Santa Cruz, CA, USA), HO-1 (Assay Designs, Inc., Ann Arbor, MI, USA), β-actin (Santa Cruz Biotech, Santa Cruz, CA), and GAPDH (Santa Cruz Biotech, Santa Cruz, CA) were used for this study. Incubation with horseradish peroxidase-conjugated secondary antibodies (Santa Cruz Biotech, Santa Cruz, CA, USA) was followed by band visualization using an enhanced chemiluminescence substrate (Thermo Fisher Scientific, Rockford, IL, USA). The band densities were quantified by densitometry (GS-700 Imaging Densitometry, Bio-Rad, Hercules, CA, USA). To facilitate comparisons, the densitometry values were normalized to a control, thereby defining the mean for the control group as one.
ELISA for RANTES and MCP-1
HK-2 cells were reseeded in 24-well plates and treated as described above. Supernatants were collected, and ELISAs for RANTES (R&D Systems Inc., Minneapolis, MN, USA) and MCP-1 (R&D Systems Inc., Minneapolis, MN, USA) were performed using Quantikine kits following the manufacturer's instructions. The samples and known standard RANTES and MCP-1 protein preparations were incubated in 96-well plates pre-coated with monoclonal anti-RANTES and anti-MCP-1 antibodies, respectively. The reaction was read in a microplate reader (Bio-Rad Laboratories, Inc., CA, USA) and measured at 450 nm with a correction wavelength set at 560 nm. The mean values of the measurements for three independent wells were used for statistical analysis.
NF-κB binding assay
NF-κB p50 DNA binding was detected by ELISA using a Trans-Factor p50 Colorimetric Kit (Clontech Laboratories, Palo Alto, CA). A total of 30 µg of nuclear extracts from HK-2 cell lysates was bound to wells coated with their consensus DNA-binding sequence. Anti-p50 was then added to the wells and incubated, followed by anti-rabbit HRP-conjugated IgG and detection by measuring the color development of tetramethylbenzidine at 655 nm using a microplate reader (Bio-Rad Laboratories, Inc., CA, USA).
Detection of intracellular reactive oxygen species (ROS)
Oxidation-sensitive 2',7'-dichlorofluorescein diacetate (DCFH-DA) (Sigma, St. Louis, MO, USA) was used to evaluate the intracellular production of ROS. The cells were loaded with DCFH-DA at a final concentration of 10 µM and incubated at 37℃ for 30 min. Next, the cells were washed with PBS, removed from the dishes by scraping, and measured for fluorescence intensity. Fluorescence was measured with a fluorescence spectrometer at 490 nm excitation and 526 nm emission.
Transfection and luciferase assay
The day before transfection, HK-2 cells were seeded at 90%-95% confluence in 24-well plates. NF-κB luciferase reporter plasmids (luc2P/NF-κB-RE/Hygro) and the internal control reporter plasmid (pRL-TK) were purchased (Promega Corp., Madison, WI, USA). For the analysis of reporter gene expression, 0.76 µg of NF-κB Photinus luciferase reporter plasmid was transfected into cells in each well using Lipofectamine 2000 (Invitrogen Corp., Carlsbad, CA, USA). Each construct was transfected with 0.04 µg of pRL-TK, where the thymidine kinase promoter drove Renilla luciferase expression. After transfection, the cells were maintained in serum-free medium for 4 hr and then switched to fresh serum-free medium for an additional 20 hr. Photinus and Renilla luciferase activities in extracts of the transfected cells were determined using the commercial Dual-Luciferase Reporter Assay System kit (Promega Corp., Madison, WI, USA). For each sample, the Photinus luciferase activity was divided by the Renilla luciferase activity to correct for transfection efficiency.
RNA interference
In experiments using HO-1 siRNA (25 nM, 5'-AUGCUGAGUUCAUGAGGAA-3', 5'-ACACUCAGCUUUCUGGUGG-3', 5'-CAGUUGCUGUAGGGCUUUA-3', 5'-AGAUUGAGCGCAACAAGGA-3') (ON-TARGETplus SMARTpool Human HMOX1, Dharmacon Inc.), the transfection of HK-2 cells was performed using DharmaFECT Transfection Reagent (Thermo Fisher Scientific) according to the manufacturer's recommendations 24 hr before other experimental procedures. A nonspecific siRNA (ON-TARGETplus Non-Targeting siRNA #1, Dharmacon Inc.) was used as a negative control.
Statistical analysis
All of the data are presented as the mean±standard deviation of the mean. The statistical analyses were performed using SPSS (version 18.0. for Windows; SPSS Inc., Chicago, IL, USA). Comparisons between groups were performed using analysis of variance followed by Tukey's test. The level of statistical significance was set at P<0.05.
RESULTS
CoCl2 ameliorated TNF-α/IFN-γ-induced oxidative stress
We examined the effect of CoCl2 on the generation of ROS (Fig. 1). Treatment with TNF-α and IFN-γ significantly increased the generation of intracellular ROS in HK-2 cells. CoCl2 pre-treatment significantly reduced the generation of ROS induced by TNF-α and IFN-γ. Cell treatment with CoCl2 alone did not affect the generation of intracellular ROS.
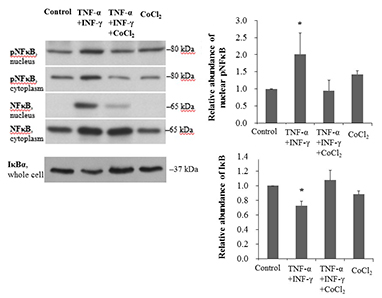
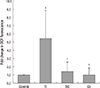
CoCl2 restored the activation of NF-κB induced by TNF-α and IFN-γ
NF-κB p65 protein phosphorylation was significantly increased in TNF-α/IFN-γ-treated cells (P=0.049). This phosphorylation was significantly decreased by CoCl2 pre-treatment (P=0.039). The abundance of IκBα protein, which inactivates NF-κB by masking its nuclear localization signal, was significantly decreased in TNF-α/IFN-γ-treated HK-2 cells (P=0.001). However, this change was restored by CoCl2 (P<0.001) (Fig. 2A). Next, we investigated the DNA-binding activity of NF-κB p50. Treatment with TNF-α and IFN-γ significantly increased the DNA-binding activity of NF-κB p50, but pre-treatment with CoCl2 restored its activity to the level of control cells (Fig. 2B). NF-κB-driven transcriptional activity was also evaluated. NF-κB-driven luciferase expression increased approximately six-fold in response to TNF-α and IFN-γ treatment (P<0.001). As expected, pre-treatment with CoCl2 significantly decreased luciferase expression (P=0.007) (Fig. 2C). Collectively, CoCl2 restored TNF-α/IFN-γ-induced NF-κB activation.
CoCl2 increased the expression of HO-1
We investigated whether CoCl2 induced HO-1 protein expression (Fig. 3A). The amount of HO-1 protein did not differ between control cells and TNF-α/IFN-γ-treated cells. However, CoCl2-pre-treated cells showed markedly increased HO-1 expression, and treatment with CoCl2 alone also increased its expression. HO-1 protein expression was markedly decreased after transfection with a siRNA specific for human HO-1 in CoCl2-pre-treated cells, demonstrating very efficient siRNA-mediated knockdown in HK-2 cells (Fig. 3B).
CoCl2 reduced TNF-α/IFN-γ induced cytokine production in an HO-1-independent manner
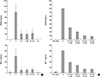
Treatment with TNF-α and IFN-γ remarkably increased RANTES production by 239-fold (981.0±253.6 vs. 4.1±1.7 pg/mL, TI vs. C, P<0.001). Pre-treatment with CoCl2 significantly decreased its production (226.4±70.2 pg/mL, P<0.001). However, RANTES production was not affected by HO-1 inhibition (TICN, 216.7±43.1 pg/mL; TIC-HO-1, 255.0±76.7 pg/mL, P>0.05). Similarly, MCP-1 production was markedly increased in TNF-α/IFN-γ-treated HK-2 cells (308.6±86.7 vs. 11.2±6.7 pg/mL, TI vs. C, P=0.001). CoCl2 pre-treatment significantly reduced MCP-1 production (45.6±8.3 pg/mL, P<0.005). However, MCP-1 production was not affected by HO-1 siRNA treatment (TIC-HO1; 52.2±13.0 pg/mL, P>0.05) (Fig. 4A). Collectively, the results indicated that CoCl2 reduced TNF-α/IFN-γ-induced RANTES and MCP-1 production in an HO-1-independent manner.
Dose-dependent inhibition of TNF-α- and IFN-γ-induced cytokine production by an NF-κB inhibitor
To investigate whether NF-κB is involved in the TNF-α and IFN-γ-induced production of RANTES and MCP-1, we pre-treated HK-2 cells with an NF-κB inhibitor before exposure to TNF-α and IFN-γ. Pre-treatment with PDTC for 2 hr reduced RANTES and MCP-1 production in a dose-dependent manner (Fig. 4B).
DISCUSSION
In this study, we evaluated the effect of CoCl2 on TNF-α/IFN-γ-induced inflammation and oxidative stress in renal tubular epithelial cells. We found that CoCl2 effectively reduced the production of inflammatory mediators and the generation of ROS by inhibiting the NF-κB pathway in renal tubular injury. However, this beneficial effect of CoCl2 was not related to HO-1 activity.
NF-κB is a transcription factor that regulates many genes related to immunity, apoptosis, cell proliferation, differentiation, and inflammation (16, 17, 18). NF-κB induces or represses numerous genes by binding to specific DNA sequences in the enhancer elements and promoters of target genes (8). NF-κB has a Rel-homology domain that permits DNA binding and dimerization and includes a nuclear localization signal. Inducers of TNF-α activate NF-κB through the classical/canonical pathway (19). The activated IKK complex triggers the phosphorylation and proteasomal degradation of IκBα, allowing p65/p50 complexes to migrate to the nucleus and bind DNA (20). Classical NF-κB activation by TNF-α influences the transcription of a variety of genes. TNF-α activates the transcription of either early genes, including inflammatory cytokines (MCP-1/CCL-2, IL-6, IL-8, and IP-10 [interferon-γ introducing protein-10]), and negative regulators of NF-κB activity (IκB-α, IκB-ε, and A20) or late genes that are transcribed when NF-κB activation lasts for at least 1 hr including some chemokines (RANTES/CCL5) (8). We noted intense increases in MCP-1 and RANTES in TNF-α/IFN-γ-treated renal tubular epithelial cells. We stimulated renal tubular epithelial cells with TNF-α and INF-γ in combination because MCP-1 and RANTES production has been shown to significantly increase after their combined application but not after stimulation with only TNF-α (data not shown) (1). This increased production of MCP-1 and RANTES was mediated through NF-κB signaling because an NF-κB inhibitor significantly reduced their production. Additionally, we confirmed that TNF-α/IFN-γ-treated renal tubular epithelial cells exhibited increased nuclear translocation of phosphorylated NF-κB p65 protein, NF-κB p50 DNA-binding activity, and NF-κB transcriptional activity, as well as reduced IκBα protein expression.
NF-κB activation has been reported in renal cells such as tubular and mesangial cells after exposure to inflammatory stimuli (8, 21, 22). In human renal disease, histologic studies have shown that NF-κB signaling is activated in glomerulonephritis (23, 24). NF-κB is primarily detected in the renal tubular epithelium in patients with proteinuric glomerulonephritis and the expression of NF-κB, MCP-1, and RANTES has been correlated with disease severity (23). In crescentic glomerulonephritis, NF-κB-positive cells are also primarily detected in crescentic lesions, the interstitium, and tubular epithelial cells (24). These data suggest that NF-κB activation is important in the promotion of inflammation in human renal disease. Therefore, the inhibition of NF-κB activity can be used to reduce renal inflammation. Repression of IκBα ameliorates proteinuria-induced tubulointerstitial injury (25). The inhibition of NF-κB p50 attenuates renal inflammation in sepsis-induced acute kidney injury (AKI) (26). In our in vitro study, CoCl2 reduced inflammation through NF-κB inhibition. Therefore, CoCl2 might be useful as an anti-inflammatory agent in the treatment of renal disease.
HO exists in two isoforms. In a healthy state, HO-1 is weakly expressed in the outer medulla and the cortex of the kidney. When the kidneys are injured, HO-1 is primarily induced in tubular epithelial cells (27). HO-1 expression in proximal tubular epithelial cells has been correlated with proteinuria, hematuria, and tubulointerstitial disease (28). However, preconditioning with HO-1 can prevent AKI induced by repeated exposure to endotoxin (29). The beneficial effects of HO-1 have been documented in toxic, ischemic, and diabetic nephropathy and include vasorelaxant, anti-apoptotic, and anti-inflammatory effects (30). Based on the beneficial effect of HO-1 and the potential of CoCl2 to induce HO-1, we hypothesized that HO-1 overexpression induced by CoCl2 could attenuate TNF-α/IFN-γ-induced inflammation and oxidative stress in renal tubular epithelial cells. We showed that CoCl2 effectively reduced the production of RANTES and MCP-1 and that CoCl2 led to IκBα degradation and the subsequent restoration of NF-κB activity in renal inflammation. These observations might have resulted from the reduction of oxidative stress. Although CoCl2 induced HO-1 overexpression as expected, knockdown of HO-1 by RNA interference did not affect cytokine production in activated HK-2 cells. Therefore, it does not appear that the anti-inflammatory effect of CoCl2 is related to HO-1 expression.
Our study has some limitations. First, although CoCl2 is known to be a potent inducer of HO-1, chemical effects other than HO-1 activation by CoCl2 may bring about these results. Further evaluation of the CoCl2 anti-inflammatory signaling pathway in renal tubular epithelial cells should be performed in future studies. Second, an electrophoretic mobility shift assay (EMSA) of NF-κB could provide more direct evidence indicating CoCl2 is involved in the NF-κB pathway.
In summary, this study demonstrated that CoCl2 effectively inhibited the production of ROS and cytokines in activated HK-2 cells via an NF-κB-mediated mechanism. CoCl2 might therefore have potential therapeutic value in renal inflammation, and further investigations are needed to clarify the mechanism.
 XML Download