Journal List > J Korean Med Sci > v.29(2) > 1022456

You, Kim, Kim, Lee, Kim, Seo, and Hong: Relationship between Dietary Mercury Intake and Blood Mercury Level in Korea

Abstract

This study was performed to evaluate the effect of dietary factors for mercury exposure by comparing with blood mercury concentration. Study population consisted of 1,866 adults (839 men and 1,027 women) in randomly-selected 30 districts in southeast Korea. Dietary mercury intake was calculated from food frequency questionnaire (FFQ) on seafood items and 24 hr recall record. Blood mercury concentration was measured with atomic absorption spectrometry. Mean age of the subjects was 43.5 ± 14.6 yr. The FFQ showed that mercury-laden fish (tuna, shark) and frequently-eating fish (squid, belt fish, mackerel) were important in mercury intake from fish species. The recall record suggested that fish and shellfish was a highest group (63.1%) of mercury intake and had a wide distribution in the food groups. In comparison with the blood mercury concentration, age group, sex, household income, education, drinking status and coastal area were statistically significant (P < 0.001). In multiple regression analysis, coefficient from the FFQ (β = 0.003) had greater effect on the blood mercury than the recall record (β = 0.002), but the effect was restricted (adjusted R2 = 0.234). Further studies with more precise estimation of dietary mercury intake were required to evaluate the risk for mercury exposure by foods and assure risk communication with heavily-exposed group.

Graphical Abstract

jkms-29-176-ab001

INTRODUCTION

Mercury is an important environmental and health issue to take priority in the harmful material list published by The US Agency for toxic substances and disease registry (ATSDR) (1). Currently, people were easily exposed to this harmful material by eating the mercury-contaminated food (2). Particularly, the mercury was converted to methyl-mercury (Me-Hg) in aqueous condition and the Me-Hg was well-absorbed in human alimentary tract (3, 4). Eating mercury-contaminated fish and shellfish was the main source of mercury exposure for human (5, 6).
For evaluating the risk for mercury exposure by ingesting foods, Korea Food and Drug Agency (KFDA) performed total diet study (TDS) by using data from Korean National Health and Nutrition Examination Survey (KNHNES). However, the study population in the TDS report was focused on the general population (7-10), and therefore it was not sufficient for risky group by frequently-eating the fish and shellfish to be safe. Southeast Korea have largest seafood markets including Jagalchi market and local residents in these areas traditionally consumed the shark which were mercury-laden fish species (11). It was needed to evaluate the risk of dietary mercury exposure for the residents in these areas, but bio-monitoring studies were just performed (12-14).
This study was planned to evaluate level of dietary mercury intake for the residents in southeast Korea and to identify the effect of the dietary mercury exposure on the blood mercury concentration as a biomarker. For this purpose, the residents in Busan, Ulsan and Gyeongsangnam-do were investigated with two kinds of dietary examinations (Food frequency questionnaire, 24 hr recall record) and blood sampling. Additionally, the significant demographic variables, which affected the blood mercury concentration in this study, were adjusted in comparison between blood mercury concentration and dietary mercury intake.

MATERIALS AND METHODS

Study population

The study population was adult over 20-yr-old residing in Busan, Ulsan and Gyeongsangnam-do in southeast Korea. To recruit the representative subjects in the area, 30 of total 41 administrative districts were randomly selected and convenient sampling was performed by distributing age group (The 20s, 30s, 40s, 50s, and 60s) and sex proportionally. The survey was investigated from June to September in 2010 and collected the data of household income, education, smoking status, drinking status, residential district (coastal or in-land area) and amalgam treatment. Coastal region was determined by the map of coastal zone boundary map prepared by The Korean National Geographic Information Institute. This study consisted of 1,866 subjects with available data on the dietary intake among total 2,019 subjects.

Questionnaire for dietary mercury intake assessment

Two different dietary examinations were performed to estimate the dietary mercury intakes in the study population. In semi-quantitative food frequency questionnaire (semi-FFQ), it was focused on the seafood known as main source of mercury intake. Specifically, two kinds of seaweed and seventeen kinds of fish species, which were selected from our pilot study on the preference of fish species for the local residents, were included. Shark and whale meats were added because of the high risk for mercury exposure as local foods. Dietary mercury intake from the semi-FFQ was calculated by multiplying consumption frequency (such as below once a month, once a month, 2-3 times a month, 1-2 times a week, 3-4 times a week, 5-6 times a week, once a day, twice a day and three times a day), standard intake amount (below-standard, standard and over-standard) and mercury contents by the individual items. Calculation of the mercury intake was used in the Korean Nutritional Society and the mercury content by seafood items were provided by KFDA (15) and Kim et al. (16).
In 24 hr recall record, kinds and amount of foods by the subjects were examined in the day before this survey as meals and snacks. The total 115 food items were investigated and the mercury contents in each food were obtained from KFDA (15). The dietary mercury intake from the recall record was sum of individual mercury intakes from items consumed by subjects, and individual mercury intake was determined by multiplying weight and mercury content of the item. Calorie was calculated from the recall record with Canpro Program (ver 3.0, Korea Nutrient Study Society) and was utilized in multivariate analysis as an adjustment variable for extremely eater's dietary intake.

Measurement of blood mercury concentration

Blood samples of the subjects were collected in the tube treated with EDTA (BD Vacutainer, Becton and Dickinson Company, Franklin Lakes, NJ, USA), stored in dry ice and transported though express bus on that day. In our laboratory, they were stored at -70℃ before the analysis. Blood mercury concentration was analyzed by gold amalgamation method with Mercury Automatic Analyzer (DMA-80, Milestone, Shelton, CT, USA). The internal quality assurance for mercury measurement was performed by checking every 40 samples with the standard material (Whole blood metal control, Sero, Billingstad, Norway) and the external quality assurance was commissioned by German Environmental Quality Assessment scheme (G-EQUAS, Institute and Out-patient clinic for Occupational, Social and Environmental Medicine of Erlangen-Nuremberg, Erlangen, Germany), biannually.

Statistical analysis

The general characteristics of the study population and the mercury intake from the dietary questionnaires were presented with descriptive epidemiology. As the blood mercury concentration of the subjects had a right-skewed distribution, log transformation was applied and that was described as geometric mean. The comparison of blood mercury concentration was analyzed with analysis of variance (ANOVA). The dietary effect on the blood mercury concentration was investigated with multiple linear regression analysis. The significance level of all statistical analysis was set as 0.05; and it was analyzed using SPSS program (ver. 19.0, SPSS Inc., Chicago, IL, USA).

Ethics statement

All the participants gave informed consent of the utilization on private information and blood extraction. The collected personal data were used for the statistical analysis and sending the results. All of the procedures were performed after approval of the institutional review board of the National Institute of Environmental Research (IRB No. EHRD-220-2010.8.11).

RESULTS

General characteristics of the study population

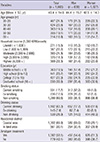
Mean age of the study population was 43.4±14.6 yr and males (44.4±15.2 yr) were older than females (42.5±14.0 yr). Males had a high proportion of current drinker (77.7%) and current smoker (37.2%). Residents in coastal areas (69.9%) were more than those in in-land areas (30.1%). Household income and education were not different by sex; females received higher amalgam treatment than males did (Table 1).

Dietary mercury intake by questionnaires

Table 2 shows the dietary mercury intake when examined by the semi-FFQ and from the 24 hr recall record. The semi-FFQ showed proportion of the mercury intake by individual fish and the 24 hr recall record described the proportion by 15 kinds of food groups. The semi-FFQ revealed that frequently-eating fish (mackerel, belt fish, squid) and mercury laden fish (tuna, shark) were more risky fish species for the mercury exposure than other species (Table 2A). In the 24 hr recall record, fish and shellfish group was a highest proportion of total mercury intake and had a widest range of 95% confidence interval (Table 2B). Geometric means of the dietary mercury intake from the semi-FFQ and the 24 hr recall record were 18.59 µg/week (Table 2A) and 30.17 µg/week, respectively (Table 2B).

Blood mercury concentration

Geometric means of the blood mercury concentration in the subjects was 5.12 (4.99-5.26) µg/L. Males had a higher blood mercury concentration as 6.01 (5.77-6.26) µg/L than in females as 4.50 (4.36-4.64) µg/L (Table 3). Age group (P<0.001), education (P<0.001), household income (P<0.001), drinking status (P<0.001) and residential district (P<0.001) were significantly associated with the blood mercury concentration (Table 4).

Multiple regression analysis

In multiple regression analysis, the blood mercury concentration was significantly associated with the dietary mercury intakes obtained from the semi-FFQ (β=0.003, P<0.001) and the 24 hr recall record (β=0.002, P<0.001). Age groups, sex, drinking status and residential district as well as the dietary mercury intakes were also significant in the regression analysis. High household income and education level of graduated school were also significantly different in the regression analysis. Estimation of blood mercury by prediction equation from the regression was restricted to explain distribution of the mercury concentration by the dietary mercury intake (adjusted R2=0.234) (Table 5). The prediction equation in this study was: Ln (Blood Hg level) =0.238*(Male sex)+(0.224-0.539)*(The 20s, 30s, 40s, 50s, 60s in Age group)+0.185*(Coastal area in residential district)-(0.117-0.128)*(Non-drinking or ex-drinking in drinking status)+0.109*(High or Highest household income)+0.105*(Graduated school in education)+0.003*(Hg intake from FFQ)+0.002*(Hg intake from 24 hr recall)+0.964.

DISCUSSION

This study showed the dietary mercury intakes from the semi-FFQ and the 24 hr recall in the study population of southeastern Korea. The semi-FFQ suggested that mercury laden fish (tuna, shark) and frequently-eating fish (squid, belt fish and mackerel) were important in the fish species. The 24 hr recall record pointed that fish and shellfish was a most heavy source of the mercury intake and had a widest range of the intake in the food groups. The dietary mercury intake significantly affected the blood mercury concentration, but the effect had a relatively weak correlation.
KFDA reported that the dietary mercury intake of general population in Korea was 2.18-2.40 µg/day based on the results reported in KNHNES in 2005 and 2007 (7, 8). Choi et al. (9) reported that an increased amount of the intake (4.29 µg/day) was obtained from KNHNES in 2008. The dietary intake level of the TDS in 2005 and 2007 was lower than that in this study (7, 8), but Choi et al. (9) was not. Yaginuma-Sakurai et al. (17) reported that dietary mercury intake level was concurrently inflated as number of dietary items increased. Choi et al. (9) examined 178 food items (47 items were fish and shellfish) of their examination, but the other TDS had comparable food items to this study (7, 8). Thus, it suggested that the level of the dietary mercury intake in our study population was higher than the general population in Korea.
Moon et al. (10) reported that the dietary mercury intake in the general population in Korea was 0.52 µg/week using data from KNHNES in 2001. Moon et al. (10) calculated the intake level using 5 more fish than this study and mercury contents of the fish species was measured by their laboratory. It was not confirmed whether the dietary mercury intake from the semi-FFQ was superior to Moon et al. (10) or not. However, the fish species with high risk of the mercury intake between our study (tuna: 15.7%, squid: 11.8%, belt fish: 11.8%, and mackerel: 10.8%) and Moon et al. (10) were consistent (mackerel: 16.0%, tuna: 14.0%, squid: 12.5%, belt fish: 6.4%). In Japan, tuna, sword fish, and marlin, which were the fish species with high mercury contents, were the main source of mercury intake by ingesting the fish (17). Like Japan, the mercury-laden fishes (tuna, shark and whale) were also important to increase the risk of mercury exposure in this study population. Such large predator fishes as shark and tuna are known to have a large variance in mercury contents according to the size of the fish. Therefore, it was considered that detail information on mercury contents by the size of these species will help to judge the precise evaluation for mercury exposure by ingesting the fishes.
Lee et al. (18) reported that a single item taking highest proportion in dietary mercury intake for Koreans was cereals. Proportion of the mercury intake from the cereals in the 24 hr recall record was 13.2 %, which was the second-highest in this study. In the Korean TDS, the cereals was the second heavy food group of the mercury intake as 15.9% and 16.7% (7, 8). It was reported that the countries consuming rice as their staple food might have increased risk of mercury exposure even though the mercury content in rice is low (19). However, because the confidence interval of the intake by cereals had a narrower range than that of the fish and shellfish, fish and shellfish were more important to manage the risk of the mercury exposure in the subjects.
This study showed that geometric means of the dietary mercury intake by sex in the semi-FFQ was opposite to the 24 hr recall record. Considering males' mercury levels at every percentile were consistently higher than in females, this discrepancy was caused by minor over-reported participants in females.
Geometric mean of the blood mercury concentration in this study was 6.07 µg/L, which was higher than the concentration (3.23-4.15 µg/L) of the researches in Korea (12-14). This study showed the male predominance and the peak of fifties in the blood mercury concentration. These finding were consistent with other bio-monitoring studies (12-14), but its mechanism was not clarified yet. It was observed that the subjects with currently drinking had a significantly higher concentration in this study. Animal experiment showed that alcohol potentiated the toxicity of mercury and increased the concentration in tissues dose-dependently (20). The significance was continued after adjustment with intake of raw sushi, which was favorite dish during drinking in Korea and acted as confounding (data was not shown). However, further study was expected to determine whether stop drinking was an effective way to reduce the risk for mercury exposure or not. Especially, it was observed that college level subjects with education background had a relatively lower blood mercury concentration than others. It assumed that the difference was caused by the increased proportion of young participants in the college level: proportion of the 20s participant in college level (47.4%) was prominently higher than other education level.
In multiple regression analysis, the dietary mercury intakes from nutritional examinations were significantly associated with the blood mercury concentration. Coefficients of the dietary factors suggested that the mercury intake from the semi-FFQ had a strong effect on the blood mercury concentration. It assumed that the semi-FFQ better provided the data of the mercury exposure by ingesting foods because of weakness for one-day recall survey in this study (21, 22). Additionally, a goodness of fit in the regression did not prove that the semi-FFQ was better predictor of the blood mercury concentration. Though we performed calorie adjustment in the regression analysis, these problems was sustained. Yaginuma-Sakurai et al. (17) pointed the difficulty of finding a significant correlation between dietary mercury intake and mercury level in biospecimen. Stern et al. (23) observed that the dietary mercury intake by fish consumption was significant in the regression of hair mercury, but had a weak correlation. Sirot et al. (24) reported that a group with low mercury intake had a poor reflection on the mercury concentration. The precision in the regression was underestimated because the subjects had a difference of fish consumption with fisherman who consumed fishery products as main dishes daily. However, researchers developed estimation models to explain blood mercury concentration by dietary intake and the models had good prediction in comparing with the actual mercury level in their study population (25-27). If the estimation model for the Korean is developed, it contributes to establish plans for management on the mercury exposure for the Koreans.
This study was the large-scaled study with strengths of recruiting even-distributed subjects with age and sex, and investigating into the dietary survey and bio-monitoring together for the local residents in southeast Korea. Additionally, it compared the dietary mercury intake with the blood mercury concentration by individual. However, the considerations on tools for increasing the accuracy of the nutritional information were not sufficient to verify the effect of the dietary mercury intake on the blood mercury level. If these limitations are overcome by sophisticated designs for the nutritional survey and detailed data on the mercury contents by fish species is available, it was expected to evaluate the risk for the mercury exposure by ingesting foods and ensure effective communication with heavily-exposed group.

Figures and Tables

Table 1
General characteristics in the study population
jkms-29-176-i001
Table 2
Dietary mercury intakes and proportion from the FFQ and the 24 hr recall record
jkms-29-176-i002
Table 3
Distribution of dietary mercury intakes and blood mercury concentration
jkms-29-176-i003

G.M., geometric means; CI, confidence interval.

Table 4
Comparison of blood mercury concentration by the demographic characteristics with ANOVA (Unit: µg/L)
jkms-29-176-i004

G.M., geometric means; CI, confidence interval.

Table 5
Multiple regression analysis of the blood mercury concentration
jkms-29-176-i005

Prediction Equation: Ln (Blood Hg level)=0.238* (male sex)+(0.224-0.539)*(Age group)+0.185*(coastal area)-(0.117-0.128)*(non-drinking or ex-drinking in drinking status)+0.109*(High or Highest in household income)+0.105*(Graduated in education)+0.003*(Hg intake from FFQ)+0.002*(Hg intake from 24 hr recall)+0.964; Regression was adjusted with calorie from 24 hr recall record.

Notes

This study was supported by the Dong-A University research fund 2014.

The authors disclose no conflicts of interest.

References

1. Agency for Toxic Substance and Disease Registry (ATSDR). CERCLA priority list of hazardous substances 2011. accessed on 1 June 2013. Available at http://www.atsdr.cdc.gov/SPL/resources.
2. Clarkson TW. The three modern faces of mercury. Environ Health Perspect. 2002; 110:11–23.
3. Ikingura JR, Akagi H. Methylmercury production and distribution in aquatic systems. Sci Total Environ. 1999; 234:109–118.
4. Ward DM, Nislow KH, Folt CL. Bioaccumulation syndrome: identifying factors that make some stream food webs prone to elevated mercury bioaccumulation. Ann N Y Acad Sci. 2010; 1195:62–83.
5. Auger N, Kofman O, Kosatsky T, Armstrong B. Low-level methylmercury exposure as a risk factor for neurologic abnormalities in adults. Neurotoxicology. 2005; 26:149–157.
6. Clarkson TW, Vyas JB, Ballatori N. Mechanisms of mercury disposition in the body. Am J Ind Med. 2007; 50:757–764.
7. Kwon YM, Lee HS, Yoo DC, Kim CH, Kim GS, Kim JA, Lee YN, Kim YS, Kang KM, No KM, et al. Dietary exposure and risk assessment of mercury from the Korean total diet study. J Toxicol Environ Health A. 2009; 72:1484–1492.
8. National Institute of Food and Drug Safety Evaluation. Dietary intake and risk assessment of contaminants in Korean food. National Institute of Food and Drug Safety Evaluation;2009. p. 133–154.
9. Choi H, Park SK, Kim MH. Risk assessment of mercury through food intake for Korean population. Korean J Food Sci Technol. 2012; 44:106–113.
10. Moon HB, Kim SJ, Park H, Jung YS, Lee S, Kim YH, Choi M. Exposure assessment for methyl and total mercury from seafood consumption in Korea, 2005 to 2008. J Environ Monit. 2011; 13:2400–2405.
11. Endo T, Yong-Un M, Baker CS, Funahashi N, Lavery S, Dalebout ML, Lukoschek V, Haraguchi K. Contamination level of mercury in red meat products from cetaceans available from South Korea markets. Mar Pollut Bull. 2007; 54:669–677.
12. Kim NS, Lee BK. Blood total mercury and fish consumption in the Korean general population in KNHANES III, 2005. Sci Total Environ. 2010; 408:4841–4847.
13. Lee JW, Lee CK, Moon CS, Choi IJ, Lee KJ, Yi SM, Jang BK, Yoon BJ, Kim DS, Peak D, et al. Korea National Survey for Environmental Pollutants in the Human Body 2008: heavy metals in the blood or urine of the Korean population. Int J Hyg Environ Health. 2012; 215:449–457.
14. Son JY, Lee J, Paek D, Lee JT. Blood levels of lead, cadmium, and mercury in the Korean population: results from the Second Korean National Human Exposure and Bio-monitoring Examination. Environ Res. 2009; 109:738–744.
15. National Institute of Food and Drug Safety Evaluation. Human risk assessment of heavy metals in food for safety management systems. National Institute of Food and Drug Safety Evaluation;2010. 10162RA994-401.
16. Kim HY, Kim JC, Kim SY, Lee JH, Jang YM, Lee MS, Park JS, Lee KH. Montitoring of heavy metals in fishes in Korea. Korean J Food Sci Technol. 2007; 39:353–359.
17. Yaginuma-Sakurai K, Shimada M, Ohba T, Nakai K, Suzuki K, Kurokawa N, Kameo S, Satoh H. Assessment of exposure to methylmercury in pregnant Japanese women by FFQ. Public Health Nutr. 2009; 12:2352–2358.
18. Lee HS, Cho YH, Park SO, Kye SH, Kim BH, Hahm TS, Kim M, Lee JO, Kim CI. Dietary exposure of the Korean population to arsenic, cadmium, lead and mercury. J Food Compost Anal. 2006; 19:S31–S37.
19. Li P, Feng X, Qiu G. Methylmercury exposure and health effects from rice and fish consumption: a review. Int J Environ Res Public Health. 2010; 7:2666–2691.
20. National Research Council. Toxicological effects of methylmercury. Washington, D.C.: National Academy Press;2000.
21. Zukowska J, Biziuk M. Methodological evaluation of method for dietary heavy metal intake. J Food Sci. 2008; 73:R21–R29.
22. Kipnis V, Midthune D, Freedman L, Bingham S, Day NE, Riboli E, Ferrari P, Carroll RJ. Bias in dietary-report instruments and its implications for nutritional epidemiology. Public Health Nutr. 2002; 5:915–923.
23. Stern AH, Gochfeld M, Weisel C, Burger J. Mercury and methylmercury exposure in the New Jersey pregnant population. Arch Environ Health. 2001; 56:4–10.
24. Sirot V, Guérin T, Mauras Y, Garraud H, Volatier JL, Leblanc JC. Methylmercury exposure assessment using dietary and biomarker data among frequent seafood consumers in France CALIPSO study. Environ Res. 2008; 107:30–38.
25. Xue J, Zartarian VG, Liu SV, Geller AM. Methyl mercury exposure from fish consumption in vulnerable racial/ethnic populations: probabilistic SHEDS-dietary model analyses using 1999-2006 NHANES and 1990-2002 TDS data. Sci Total Environ. 2012; 414:373–379.
26. Carrington CD, Bolger MP. An exposure assessment for methylmercury from seafood for consumers in the United States. Risk Anal. 2002; 22:689–699.
27. Tran NL, Barraj L, Smith K, Javier A, Burke TA. Combining food frequency and survey data to quantify long-term dietary exposure: a methyl mercury case study. Risk Anal. 2004; 24:19–30.
TOOLS
ORCID iDs

Chang-Hun You
https://orcid.org/http://orcid.org/0000-0001-6844-4394

Byoung-Gwon Kim
https://orcid.org/http://orcid.org/0000-0002-1762-6320

Yu-Mi Kim
https://orcid.org/http://orcid.org/0000-0003-1123-8690

Sang-Ah Lee
https://orcid.org/http://orcid.org/0000-0002-5079-9733

Rock-Bum Kim
https://orcid.org/http://orcid.org/0000-0001-5868-0465

Jeong-Wook Seo
https://orcid.org/http://orcid.org/0000-0002-1909-6714

Young-Seoub Hong
https://orcid.org/http://orcid.org/0000-0002-9037-3761

Similar articles