

 PDF
PDF ePub
ePub Citation
 Print
Print


INTRODUCTION
Preservation of residual renal function (RRF) has consistently been an independent predictor of mortality and cardiovascular death in peritoneal dialysis (PD) patients (1, 2, 3, 4, 5, 6, 7, 8). Recently, the contribution of low glucose degradation product (GDP) solutions to the preservation of RRF has been evaluated. In the 3 out of 5 prospective randomized controlled studies comparing low GDP solution with conventional solution, the low GDP solution better preserved RRF (9, 10, 11, 12, 13). Among the randomized controlled trials using icodextrin in continuous ambulatory peritoneal dialysis (CAPD) patients (14, 15, 16), there are conflicting results regarding the effect of icodextrin on RRF. A previous study reported that icodextrin better preserved urine volume compared with 2.27% glucose solution during 6 months (14). Another recent study demonstrated that a combination of three biocompatible PD solutions including icodextrin better preserved urine volume during 12 months (15). On the other hand, a randomized controlled trial showed similar decline in urine volume and renal creatinine clearance (CrCl) between icodextrin and glucose solution for 2 yr in diabetic PD patients (16). Therefore, more randomized long-term studies are required in various patient populations to clarify the advantage of icodextrin over the glucose solution in terms of preserving RRF.
There is a broad consensus that a minimum of weekly Kt/Vurea target of 1.7 must be reached in PD (17, 18). However, it is not clear whether CAPD should begin with a full dose with four exchanges a day or begin with a smaller dose and increase the dose according to the parameters, such as solute clearance and ultrafiltration (UF), in incident CAPD patients having RRF. Although small dose CAPD by fewer exchanges a day is expected to give lower peritoneal solute clearance and UF compared with full dose CAPD, adequate solute clearance and volume control can be achieved by RRF in incident CAPD patients. Furthermore, it may have advantages of lower burden of glucose, better quality of life, lower peritonitis rate and better preservation of RRF, based on the clinical results of incremental PD (19, 20). We designed a prospective randomized controlled study to assess clinical benefits and safety of three daily exchanges CAPD technique using one icodextrin-containing and two neutral-pH, low GDP glucose-containing dialysates in incident CAPD patients. The primary outcome was change in RRF. Secondary outcomes were volume control, dialysis adequacy, and biocompatibility.
MATERIALS AND METHODS
Patients
Eighty end-stage renal disease patients starting CAPD from dialysis centers of 8 hospitals of the Catholic University of Korea, College of Medicine were enrolled from June 2007 to February 2009. Exclusion criteria included bedridden status, dependency on tube feeding, advanced liver cirrhosis, and current malignancy.
Study design
A multicenter, prospective, randomized, controlled trial was conducted. This study was registered with the International Standard Randomised Controlled Trial Number Registry (ISRCTN23727549). After enrollment, patients were randomly assigned to one of the two groups, and used four exchanges of glucose-containing dialysates (Physioneal, Baxter Healthcare, Woodlands, Singapore) a day. Randomized assignment was maintained by personnel not directly involved in the study. After one month (represents as 0 month), patients in the control group (GLU) continuously used four exchanges of glucose-containing dialysates (Physioneal) a day. Patients in the treatment group (ICO) used one icodextrin solution (Extraneal, Baxter Healthcare, Woodlands, Singapore) for the long dwell (12-hr) and two exchanges of glucose-based dialysates (Physioneal) a day. Liberal use of 1.5%, 2.5%, or 4.25% glucose-based dialysates was allowed in both groups to achieve adequate control of edema and blood pressure. All patients were prescribed loop diuretics at baseline, and the dose of loop diuretics were not changed during the study. Visits were scheduled every month, and clinical evaluations were done in each visit. Peritoneal equilibration test was done at 0 month. Laboratory assessments were done at 0 month and every three months for hematological and serum chemistry data. Urine and peritoneal effluent samples were analyzed every six months for glucose, urea, creatinine and sodium levels and cancer antigen 125 (CA125) and interleukin-6 (IL-6) levels. Plain radiographs for chest were taken every six months. The study period was 12 months after randomization.
Sample size
The sample size was based on a power analysis to detect a 30% difference in proportion of patients with less than 50% reduction of RRF between two groups (α=0.05, 1-β=0.8). This resulted in a sample size of 39 patients in each group.
Clinical and biochemical assessments
Body weight, blood pressure (BP), prescription schedule and net peritoneal UF volume were assessed on 0 month and every three months. UF volume was averaged from peritoneal effluent volumes of three consecutive days before each visit. Dialysis adequacy, peritoneal creatinine clearance (peritoneal CrCl), mean of renal urea and creatinine clearance (renal CrCl), urine volume, β2-microglobulin clearance (β2-MGCl), ratio of overnight dialysate and serum β2-microglobulin (D/Pβ2-MG), peritoneal glucose absorption, dialysate calorie load, insulin requirements, daily dialysate sodium loss, and cardiothoracic index (CTI) on chest radiographs were assessed on 0 month and every six months. D/Pβ2-MG was calculated from serum and overnight dialysate, which was a glucose-containing dialysate in the GLU group and icodextrin in the ICO group. β2-MG was estimated by solid-phase, two-site chemiluminescent immunometric assay with Immulite 2000 (Siemens, Erlangen, Germany). Dietary protein intake was estimated from the protein equivalent of nitrogen appearance (PNA) following the equation: PNA=15.1 + 0.1945 urea appearance (mM/24 hr) + protein losses (g/24 hr) (21). The daily (24-hr) dialysate sodium loss was calculated from the directly measured volume and sodium concentration of the daily drained dialysates minus the infused dialysate volumes and sodium concentrations during the 24-hr time interval. The daily (24-hr) peritoneal glucose absorption was calculated from the infused dialysate volumes and glucose concentrations during the 24-hr time interval minus the directly measured volume and glucose concentration of the daily drained dailysates. The dialysate calorie load was calculated from the sum of calorie from the dialysates used a day (22). In the 24-hr dialysate effluents, CA125 levels were measured by immunoradiometric assay using immunotech kit (Beckman Coulter, Prague, Czech Republic) and IL-6 levels were measured by sandwich ELISA (R&D Systems, Minneapolis, MN, USA) every six months. The intra- and inter-assay coefficients of variation were 2.0% and 3.8%, respectively. The dialysate sodium, glucose, CA125 and IL-6 levels and plasma sodium levels were measured in the central laboratory of Seoul St. Mary's Hospital. Other biochemical data were measured in the laboratory of each participating hospital according to standard procedures. Events of peritonitis and cardiovascular disease were recorded in every visit. Cardiovascular events included coronary heart disease (angina pectoris or myocardial infarction), cerebrovascular disease (transient ischemic attack, cerebral infarction, or cerebral hemorrhage), peripheral/pulmonary vascular disease, and heart failure.
Statistical analysis
There was no patient who crossed over the two groups. At 6 months, there were 34 (GLU group) and 36 (ICO group) patients with data; at 12 months, these were 33 and 35 patients, respectively. In intention-to-treat analysis, mean values between groups were compared at 0, 6, and 12 months using unpaired Student's t-test. A mixed-model longitudinal data analysis was used to test for an effect of treatment on the primary endpoints, change in renal CrCl and urine volume, with age and gender as covariates. As 12 patients (15.0%) dropped out during the study, we analyzed the change in parameters in each group using paired t-tests and by including only patients who fulfilled the study (per-protocol analysis; 33 patients in GLU group and 35 patients in ICO group). Also the change in serial measurements over time was analyzed by repeated measures analysis of variance (ANOVA). Proportions between groups were compared using chi-square tests or Fisher's exact tests. A P value less than 0.05 was taken to indicate statistical significance. Values are presented as mean±standard deviation.
RESULTS
Baseline characteristics
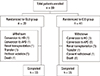
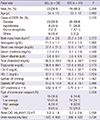
Eighty patients were enrolled and randomized. Sixty-eight patients completed the 12-month protocol (GLU group, n=33; ICO group, n=35; Fig. 1). Baseline characteristics are shown in Table 1. The mean ratio of dialysate to plasma creatinine (D/P creatinine at 4 hr) was significantly higher in the ICO group than the GLU group. However the proportions of peritoneal membrane transport types were not different between the 2 groups.
Residual Renal Function (RRF)
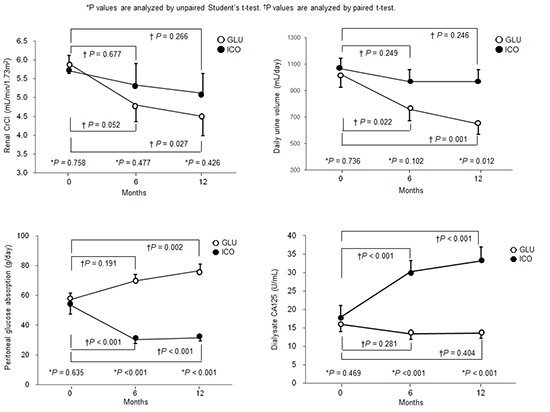
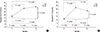
The renal CrCl and daily urine volume were measured for assessment of RRF. There was no statistical difference in renal CrCl (mL/min per 1.73 m2) at 0, 6, and 12 months between the two groups (GLU vs. ICO; 0-mo, 5.9±1.6 vs. 5.7±2.6, P=0.758; 6-mo, 4.8±2.6 vs. 5.3±3.5, P=0.477; 12-mo, 4.5±2.9 vs. 5.1±3.1, P=0.426). When analyzed by the mixed model with adjustments for age and gender, there was no statistical difference in renal CrCl between the two groups (P=0.783). In per-protocol analysis, the GLU group showed a significant decline in renal CrCl at 12 month from 0 month (P=0.027), but the ICO group did not. Repeated measures ANOVA showed that there was no significant treatment effect on the change in renal CrCl (P=0.528) (Fig. 2A).
Daily urine volume (mL per day) was significantly higher in the ICO group than the GLU group at 12 month (GLU vs. ICO; 0-mo, 1,024±609 vs. 1,066±522, P=0.736; 6-mo, 760±502 vs. 969±542, P=0.102; 12-mo, 649±458 vs. 967±553, P=0.012). When analyzed by the mixed model with adjustments for age and gender, there was no statistical difference in renal CrCl between the two groups (P=0.060). In per-protocol analysis, the GLU group showed a significant decline in urine volume at 6 and 12 months from 0 month (P=0.022 and P=0.001, respectively), but the ICO group did not. Repeated measures ANOVA showed that there was no significant treatment effect on the change in urine volume (P=0.104) (Fig. 2B).
Markers for volume status
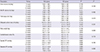
Measurements of daily urine and peritoneal UF volume, dialysate sodium loss, body weight, CTI, and BP were used as surrogate markers for volume status (Table 2). The daily urine volume was significantly higher in the ICO group than the GLU group at 12 month, and it significantly decreased in the GLU group, but not in the ICO group. The GLU group showed a significantly higher peritoneal UF volume than the ICO group at 6 months, and the GLU group showed a significant increase in the peritoneal UF volume at 6 and 12 months (P<0.001), but the ICO group did not. Therefore, the total output (sum of urine volume and net UF volume) was not different between the two groups. There was no significant difference in the dialysate sodium loss between two groups during a year. However, the dialysate sodium loss significantly increased in the ICO group at 6 and 12 months (P=0.029 and P=0.006, respectively), but not in the GLU group. Body weight was not different between the two groups, but significantly increased during the study in both groups. CTI and absolute systolic and diastolic BP values were not different between the two groups and did not change significantly during the study in each group. Repeated measures ANOVA showed that there were no significant treatment effects on the changes in these volume-related parameters.
Prescription of 2.5% glucose dialysates
At 0 month, the proportion of patients using at least two 2.5% glucose dialysates per day was similar between the two groups (GLU, 21.2%; ICO, 20.0%). Over time, patients using at least two 2.5% glucose dialysates increased in the GLU group, but decreased in the ICO group, and the proportion was significantly higher in the GLU group than the ICO group (3-mo, 42.4% vs. 8.6%, P=0.002; 6-mo, 42.4% vs. 11.4%, P=0.006; 9-mo, 33.3% vs. 8.6%, P=0.016; 12-mo, 51.5% vs. 14.3%, P=0.001).
Dialysis adequacy and peritoneal β2-microglobulin clearance
The dialysis dose was adequate in both groups during the study (Table 3). The total Kt/Vurea, renal Kt/Vurea, and peritoneal Kt/Vurea were not different between the two groups, and the changes from 0 month were not significant in each group. The protein intake of the patients, represented by nPNA, was also adequate. The peritoneal CrCl was not different between the two groups during the study. In per-protocol analysis, the peritoneal CrCl significantly increased in the GLU group at 6 month (P=0.03), but not at 12 month. The ICO group did not show significant changes in peritoneal CrCl. Repeated measures ANOVA showed that there were no significant treatment effects on the changes in these parameters.
The peritoneal β2-MGCl was not different between the two groups, and the changes in peritoneal β2-MGCl were not significant in each group. The D/Pβ2-MG was significantly higher in the ICO group than the GLU group at 6 and 12 months (P<0.001). The D/Pβ2-MG did not change in the GLU group, but it significantly increased at 6 month (P=0.02) in the ICO group. Repeated measures ANOVA showed that there was significant treatment effect on the change in D/Pβ2-MG (P<0.001).
Peritoneal glucose absorption and dialysate calorie load
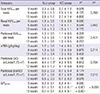
The peritoneal glucose absorption (g per day) was significantly lower in the ICO group than the GLU group at 6 and 12 months (GLU vs. ICO; 0-mo, 57.2±30.8 vs. 53.3±34.4, P=0.635; 6-mo, 69.7±18.6 vs. 30.2±13.8, P<0.001; 12-mo, 76.6±23.1 vs. 31.5±10.6, P<0.001). While the GLU group showed a significant increase in daily peritoneal glucose absorption at 12 month (P=0.002), the ICO group showed a significant decrease at 6 and 12 months (P<0.001). Repeated measures ANOVA showed that there was significant treatment effect on the change in peritoneal glucose absorption (P<0.001) (Fig. 3A).
The dialysate calorie load (Kcal per day) was significantly lower in the ICO group than the GLU group at 6 and 12 months (GLU vs. ICO; 0-mo, 423.9±83.2 vs. 405.5±69.9, P=0.326; 6-mo, 450.3±97.8 vs. 372.7±44.6, P<0.001; 12-mo, 478.9±101.7 vs. 380.8±63.3, P<0.001). The GLU group showed a significant increase in the dialysate calorie load at 12 month (P<0.001), but the ICO group showed a significant decrease at 6 month (P=0.023) (Fig. 3B). Repeated measures ANOVA showed that there was significant treatment effect on the change in dialysate calorie load (P<0.001). Insulin requirements (U per day) did not differ between the two groups (GLU vs. ICO; 0-mo, 41.3±72.6 vs. 31.3±26.5, P=0.459; 6-mo, 41.1±73.0 vs. 34.5±36.3, P=0.344; 12-mo, 55.6±61.2 vs. 36.4±36.2, P=0.367), and the change in insulin doses was not significant in each group.
Peritoneal effluent CA125 and IL-6 levels
The dialysate CA125 levels (U per mL) were significantly higher in the ICO group than the GLU group at 6 and 12 months (GLU vs. ICO; 0-mo, 16.0±9.8 vs. 17.9±15.2, P=0.469; 6-mo, 13.4±9.8 vs. 30.3±16.5, P<0.001; 12-mo, 13.6±7.2 vs. 33.2±19.3, P<0.001). The dialysate CA125 level in the ICO group significantly increased at 6 and 12 months (P<0.001), in contrast to the GLU group (Fig. 4A). Repeated measures ANOVA showed that there was significant treatment effect on the change in dialysate CA125 level (P<0.001).
The dialysate IL-6 level (pg per mL) was significantly higher in the ICO group compared to the GLU group at 6 and 12 months (GLU vs. ICO; 0-mo, 12.3±10.3 vs. 11.4±8.1, P=0.464; 6-mo, 11.1±15.0 vs. 27.2±20.2, P<0.001; 12-mo, 12.0±12.6 vs. 22.8±12.4, P=0.003). The dialysate IL-6 level in the ICO group also significantly increased at 6 and 12 months (P<0.001 and P=0.001, respectively), whereas the IL-6 level in the GLU group did not (Fig. 4B). Repeated measures ANOVA showed that there was significant treatment effect on the change in dialysate IL-6 level (P=0.003).
Adverse events
The rate of peritonitis was 12.8% (n=5) in the GLU group and 9.8% (n=4) in the ICO group (P=0.73). The rate of cardiovascular event was 2.6% (n=1, cerebral infarction) in the GLU group and 2.4% (n=1, angina pectoris) in the ICO group (P=1.00). There was no significant difference in hemoglobin, albumin, calcium, phosphorus, aspartate aminotransferase and alanine aminotransferase levels between the two groups.
DISCUSSION
This is the first prospective, randomized, controlled study showing the benefits of a three daily exchanges CAPD technique using one icodextrin-containing and two low GDP, glucose-containing dialysates in incident CAPD patients. The present study demonstrated that the three daily exchanges CAPD technique using icodextrin was associated with better preservation of RRF and was more biocompatible in terms of glucose exposure and preservation of mesothelial cell homeostasis, compared with the four exchanges CAPD technique using low GDP, glucose solutions in incident CAPD patients.
There are conflicting results regarding the effect of icodextrin on RRF in CAPD patients (14, 15, 16). In this study, urine volume was significantly higher in the ICO group than the GLU group at 12 month. The per-protocol analysis showed that the decline in renal CrCl and urine volume was significant in the GLU group, but not in the ICO group. These results suggest that the thrice-exchange technique using icodextrin may better preserve RRF. Although we have not identified the reason for preserving RRF by icodextrin, there are two possible explanations. First, icodextrin may reduce the extracellular fluid volume whilst protecting the patient from intravascular volume contraction. Previous reports showed increased plasma atrial natriuretic peptide levels, a marker of intravascular volume, when using icodextrin (23, 24). Low concentrations of high molecular weight icodextrin in plasma could potentially influence oncotic pressures and prevent intravascular volume depletion. Second, the UF rate may be slower during the thrice-exchange technique than the four times-exchange technique. The colloid oncotic pressure of icodextrin promotes UF at a lower rate than glucose (25), and the thrice-exchange requires less amounts of hypertonic dialysate. Therefore the less variation in the patients' hemodynamic status may exert less ischemic damage to kidney. Third, less peritoneal UF volume may affect to better preserve RRF.
In terms of fluid removal, the GLU group showed significantly higher UF volume than the ICO group, which was associated with that the GLU group used more 2.5% glucose-containing dialysates. In every visit, the decision of glucose concentration of dialysate to prescribe was made according to the body weight, presence of edema, and BP. Therefore, it was likely that more use of 2.5% glucose-containing dialysates and consequent more UF volume in the GLU group attributed to the decreased urine volume, not vice versa. The ICO group maintained same volume status as the GLU group based on that there was no difference in total output, body weight, CTI and systolic and diastolic BP between the two groups. Maintaining the same volume status in the ICO group despite three daily exchanges was ascribed not only to the higher urine volume, but also to the superior net UF of icodextrin during long dwell compared with 2.5% or 4.25% glucose solutions (4, 14, 26, 27, 28, 29). In terms of sodium removal, the dialysate sodium loss was not different between the two groups. However, the dialysate sodium loss significantly increased in the ICO group, but not in the GLU group. As icodextrin removes sodium more effectively than glucose solutions (14, 30), the amount of dialysate sodium removal was not lower in the ICO group than the GLU group despite of lower UF volume.
The continuous absorption of glucose during PD imposes a carbohydrate load that can lead to long term metabolic complications such as obesity and dyslipidemia (31, 32). In contrast to glucose, a slower absorption of carbohydrate from icodextrin results in a lower calorie load (33). In this study, both the glucose absorption and dialysate calorie load were significantly lower in the ICO group than the GLU group. These results clearly demonstrate the advantage of the thrice-exchange CAPD technique using icodextrin, in terms of less carbohydrate and calorie load.
Peritoneal effluent CA125 levels were measured as a marker of mesothelial cell mass and integrity (34). The effluent CA125 levels were significantly higher in the ICO group than the GLU group at 6 month and 12 month. This suggests that the peritoneal mesothelial cell layer was better preserved in the ICO group than the GLU group. GDPs are known to cause damage to the peritoneal membrane (35). It can be explained that the lower glucose absorption of the ICO group resulted in better preservation of the mesothelial cell layer. IL-6 is a pleiotropic cytokine involved in inflammatory and immune responses (36). Whereas it was reported that IL-6 might reflect inflammation in the peritoneum (37), others suggested that the increase in IL-6 in biocompatible solutions may reflect increased preservation of mesothelial cells (15, 38). Our results are consistent with these studies, as the dialysate IL-6 levels were significantly increased in the ICO group compared with the GLU group. These results suggest that the increased mesothelial cell mass and preservation of the peritoneal membrane may have increased IL-6 levels in the ICO group.
Dialysis adequacy should be a concern with three daily exchanges CAPD technique because of low dialysis dose. As expected, the peritoneal CrCl was significantly lower in the ICO group than the GLU group at 6 month. However, the total Kt/Vurea levels were not different between the two groups and were within the acceptable range during a year. It was because that all patients were initially starting CAPD, who had enough RRF to compensate low dialysis dose. Although we cannot determine that how long the patients can be maintained on a thrice-exchange CAPD, it is likely that this technique may be acceptable as long as if the dialysis adequacy is reasonable. Moreover, the peritoneal β2-MGCl was not different between the two groups. This may be because the peritoneal removal of β2-MG is higher in icodextrin than a glucose-containing dialysate (39). This study also showed that the D/Pβ2-MG was significantly higher in the ICO group than the GLU group at 6 month and 12 month.
This study has some limitations. First the number of patients was small and the study period was not long enough to assess the long-term effect of the thrice-exchange CAPD technique using icodextrin on clinical outcomes. Second, whether a decrease in urine output or an increase in peritoneal UF became first is unclear. Third, a more accurate method for assessment of volume status was needed other than body weight, CTI and BP. Fourth, the mean D/P creatinine at 4 hr was different between the two groups. It is because stratification of D/P creatinine at 4 hr was not performed during randomization. The peritoneal transport might have affected our results, and the thrice CAPD technique using one icodextrin-containing and two-glucose containing dialysates may be a better option for high peritoneal membrane transporters.
In conclusion, the CAPD technique using one icodextrin-containing and two glucose-containing dialysates a day shows a tendency of better preservation of RRF and is more biocompatible compared to the CAPD technique using four exchanges of low GDP glucose-containing dialysates, with comparable dialysis adequacy in incident CAPD patients.
 XML Download