

 PDF
PDF ePub
ePub Citation
 Print
Print


INTRODUCTION
The intra-aortic balloon pump (IABP) is used to increase myocardial oxygen perfusion, while at the same time increasing cardiac output and decreasing the workload of the ventricle. This is realized via counter-pulsation of the IABP. Several parameters affect IABP treatment, such as the volume of the balloon, its location in the aorta, its rate of inflation and deflation, and the phase of IABP pumping. Several researchers have examined the effects of various parameters on IABP function in terms of increasing myocardial oxygen perfusion and decreasing the workload of the ventricle. When the volume of blood used to inflate and deflate the balloon increases, the IABP functions were improved (1). Inflation of the IABP at end-systole and deflation of the IABP at end-diastole were the optimal pumping phase in order to decrease the ventricle workload and increase aortic pressure during diastole, thereby increasing myocardial oxygen perfusion (2).
To quantify the reduction in workload, indirect parameters are used, such as the mean systolic pressure (3), product of heart rate and peak systolic pressure (3), and pressure-volume area (4). No study has quantified the reduction in workload with IABP directly because experimental methods for documenting and evaluating myocardial energy consumption throughout the ventricular volume are hampered by low spatiotemporal resolution. Computational modeling is an alternative approach that overcomes this limitation. However, the previous computational models of the cardiovascular system and IABP used a simple lumped model of the cardiovascular system, which cannot calculate the contractile cardiac energy consumption directly.
Previously, we developed a computational model of left ventricular assist device support using a three-dimensional electromechanical model of failing canine ventricles together with a lumped model of the circulatory system (5, 6). This model enabled us to quantify the changes in the local contractile energy consumption of the myocardium. In this study, we incorporated IABP function into the electromechanical model of a ventricle with a lumped model of the circulatory system. Then, we used the model to investigate the changes in the contractile energy consumption of the myocardium with an IABP using different inflation volumes.
MATERIALS AND METHODS
Model description
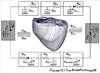
The IABP-implanted cardiovascular system model was implemented by combining a three-dimensional (3D) finite element (FE) electromechanical model of the failed heart, a lumped model of the circulatory system, and a model of IABP function. Fig. 1 shows a schematic of the integrated model (A) and myofilament dynamics, which were adapted from Rice et al. (7). The models are described in detail below.
3D cardiac electromechanical model of the failing heart
We used an anatomically accurate 3D-FE electromechanical model of failing canine ventricles, which incorporated a biophysical representation of cardiac myofilament dynamics (8). The electrical model based on the membrane dynamic model of Fox et al. (9) used magnetic resonance (MR) image-based canine ventricle geometry with approximately 1,400,000 nodes and 1,700,000 elements, which were developed using linear interpolation. The mechanical model based on the myofilament dynamic model of Rice et al. (7) used the same canine ventricle geometry with 356 nodes and 172 elements, which were developed using Hermite polynomials. Both meshes also have realistic fiber and laminar sheet structural information obtained from the diffusion tensor (DT) MR image. The passive mechanical properties of the myocardium were assumed to be transversely isotropic, hyperelastic, and nearly incompressible, defined by an exponential strain energy function. The local electrical activation times in the electrical mesh were mapped to the mechanical mesh. Fig. 2 shows the electrical activation time mapped to the mechanical mesh. Here, the local electrical activation time is defined as the instant at which transmembrane voltage exceeds 0 mV.
As an electrical wave propagates through the heart, the depolarization of each myocyte initiates the release of calcium (Ca) from intracellular stores. This is followed by the binding of Ca to troponin C and cross-bridge cycling. The cross-bridge cycling forms the basis for contractile protein movement and the development of active tension in the cell, resulting in deformation of the ventricles. These physiological contractile mechanisms are considered in the myofilament model (7).
To consider remodeling of the passive electromechanical properties associated with heart failure (HF), several changes were made to the electromechanical model (Table 1). First, we used the dilated geometry of a canine ventricle with heart failure (HF) (8). Then, the electrical conductivity was reduced by 30%, allowing for a total electrical activation time of 150 ms, according to the experimental results of Helm et al. (10). Third, to account for the increased stiffness of the failing myocardium, the passive scaling constant in the strain-energy function was increased fivefold (11). Finally, to introduce systolic dysfunction, the peak and time constant of the calcium transient function ([Ca](t) of Eq. 55 in the myofilament model of Rice et al. (7)), which served as an input, were reduced to 70% of the normal values. This resulted in a calcium transient with a reduced peak and prolonged relaxation rate, which are the key features of the remodeled Ca transient in HF (12).
Combining the ventricle model with the circulatory and IABP models
We combined the FE heart model with a lumped model of the circulatory system and IABP to predict the cardiovascular response during IABP therapy. The model is formulated as an electrical analog model consisting of elements such as resistors, capacitors, and diodes. Using the hemodynamic parameters related to blood circulation, this model calculates the pressure, volume, and blood flow for each of the six compartments making up the vascular system and atria (Fig. 1): the systemic arteries and veins, pulmonary arteries and veins, left atrium, and right atrium. Individual elements in every compartment are modeled by considering the local resistance to blood flow and compliance of blood vessels. The atria are modeled as two-chamber pumps with time-varying compliance. The inertia of blood is ignored due to its relatively small effect on the canine cardiovascular response. The four heart valves that surround the ventricles and control the blood flow direction are modeled by diodes and resistances.
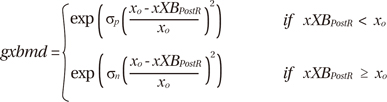
Briefly, the IABP component was modeled as the time-varying compliance of the systemic arteries. To generalize the patterns of inflation and deflation of an IABP, a harmonic waveform was used for the time-varying compliance of the systemic arteries. The harmonic waveforms for the compliance of the aorta were expressed as follows:

Here, CSA,IABP is the time-varying compliance of the systemic arteries with the IABP, CSA is the compliance of the systemic arteries without the IABP, SFIABP is a scale factor for the IABP, sf is the level of the scale factor, BCL indicates the basic cycle length of the ventricle, and ø indicates the time shift between the ventricular contraction cycle and IABP inflation cycle. The sf is major parameter which is proportional to the stroke volume of IABP and related to the pumping compliance of IABP. In this study, sf was given values of 0.05, 0.1, 0.15, 0.2, and 0.25, and ø was set to 3.66 radians (350 ms shift), instead of end-systole.
RESULTS
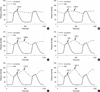
Fig. 2 shows the simulated pressure waveforms in the LV and systemic artery under HF (A), and HF with the IABP operating at level 1 (sf=5%, B), 2 (sf=10%, C), 3 (sf=15%, D), 4 (sf=20%, E), and 5 (sf=25%, F). The mean arterial pressure under HF was 125 mmHg, which matches that in congestive heart failure. As the level of IABP treatment was increased, the aortic pressure during diastole, which is related to coronary perfusion, increased and the left ventricular peak pressure during systole, which is related to the after-load, decreased.
Fig. 3 shows the calculated transmural distribution of the contractile ATP consumption rates at end systole and end diastole for HF without an IABP (Fig. 3A), and the model with the IABP operating at level 5 (Fig. 3B). The ATP consumption rate changed significantly in the left ventricle rather than the right during systole. The contractile ATP consumption decreased significantly in the presence of the IABP. Compared with the case involving HF without an IABP, the contractile ATP consumption decreased by 12% with IABP therapy (see the ATP consumption rate in Table 2).
Fig. 4 shows the calculated transmural distribution of the fiber strain at end systole and end diastole for HF without an IABP (Fig. 4A) and the model with the IABP operating at level 5 (Fig. 4B). The fiber strain decreased significantly in the presence of the IABP.
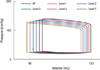
Fig. 5 shows the pressure-volume curves for the six cases studied: HF without IABP therapy, and HF with the IABP at levels 1 to 5. The pressure-volume curves shifted to the left and downward. The end-diastolic volume decreased by 8 mL (Fig. 6); this indicates that the IABP results in ventricular volume unloading by reducing the end-diastolic volume.
Table 2 shows the hemodynamic responses for HF and HF with the IABP at levels 1 to 5. While the cardiac output and stroke volume increased, the stroke work and ATP consumption decreased with IABP therapy due to the pressure unloading effect. The decreased left ventricular peak pressure also indicates the pressure unloading effect during IABP therapy.
DISCUSSION
This study investigated the changes in the contractile energy consumption of the myocardium with IABP with different inflation volumes using a cardiac electromechanical model with a lumped model of the circulatory system and IABP function. To generalize the patterns of inflation and deflation of the IABP, a harmonic waveform was used for the time-varying compliance of the systemic arteries. According to the IABP inflation volume, the arterial pressure increased during diastole, while the ventricular peak pressure decreased, which indicates improved coronary perfusion and ventricular unloading. To estimate the change in the ventricular workload directly, the contractile ATP consumption of the ventricle was computed (Fig. 3). With greater inflation, the ATP consumption decreased significantly. The transmural distribution of the mechanical strain was also compared between HF ventricles and HF ventricles with an IABP at level 5 in order to estimate the volume-unloading effect of the IABP (Fig. 4). The fiber strain also decreased significantly with an IABP. The pressure-volume diagrams in Fig. 5 were consistent with the fiber strain distributions.
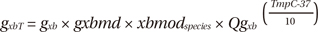
The contractile ATP consumption and fiber strain varies transmurally. In general, the sarcomere length affects the density of effective cross-bridges and therefore the contractile force; this is known as the Frank-Starling law of the heart. A longer sarcomere length results in greater contractile ATP consumption because of the greater density of the attached cross bridges in myocytes, as expressed in Eq. 3 in the Appendix. Previously, we demonstrated that myofibers in the endocardium have greater end-diastolic lengths than myofibers in the mid-myocardium and epicardium (6). Fig. 4 also shows that the end-diastolic strain and ATP consumption rate of the endocardial sarcomere are greatest. This explains why the contractile ATP consumption by the endocardium was greater than that at the mid-wall or epicardium (Figs. 3 and 4). The cardiac output, stroke volume, stroke work, MAP, ATP consumption rate, and ejection fraction are all increased with IABP treatment (Table 2). Interesting point is that although the ATP consumption is decreased significantly, stroke work is decreased only slightly, which indicates that the IABP helps the failed ventricle to pump blood efficiently.
There are several limitations. We used an image-based electromechanical model of failing canine ventricles, in which the ventricular geometry, fiber architecture, and hemodynamics differ from those of human ventricles. We also considered only the contractile ATP consumption of the myocardium, although ATP is used in other ways, such as by sarcoplasmic/endoplasmic reticulum calcium ATPase (SERCA), plasma membrane Ca-ATPase (PMCA), and Na pumps. Their functions are changed at failing heart condition (13-15). Finally, we did not considered remodeled electrical activities of myocardial cell in failing heart. We assumed that the electrical conductivity changes in tissue level encapsulated those changes in cellular level. However, these limitations should not alter the main findings of this study greatly.
We conclude that IABP improves coronary perfusion as well as pressure unloading and volume unloading and also helps the failed ventricle to pump blood more efficiently.


 XML Download