

 PDF
PDF ePub
ePub Citation
 Print
Print


INTRODUCTION
Cancer incidence in South Korea (Korea hereafter) is rising with very high lifetime prevalence. The age-standardized rate of Korea's cancer incidence reached 300 per 100,000 in 2009, after increasing with an annual rate of 3.4% during 1999-2009 on average (1). The 5-yr relative survival rate of all cancers combined in the nation registered a jump from 41.2% during 1993-1995 to 59.5% during 2004-2008 (2). Indeed, one of every 3 Koreans is likely to have cancer during his/her expected lifetime, with the probability of cancer incidence during the expected lifetime being 37.9%/32.7% for Korean men/women (3). Moreover, Korea's major cancers are changing in terms of incidence. In terms of incidence rates, lung, liver and cervix uteri cancers are going down while thyroid, prostate, breast and colon cancers are moving in the opposite direction (3). The rising incidence of cancer does not create great burden only for Korean individuals, but also for Korean society. In 2005, Korea's economic burden of cancer (i.e., 14.1 billion US dollars) constituted 1.75% of its GDP with a 23.7% increase from 2002 (4). With such a rapid growth in its economic burden of cancer, it is becoming more vital in Korea to conduct an accurate estimation for its socioeconomic burden of cancer and make an appropriate decision on its resource allocation in public health.
The Global Burden of Disease Study (GBD) approach is a method to estimate the socioeconomic burden of cancer. This approach centers on DALYs (disability adjusted life years), a collective indicator of population health combining mortality and incidence rates of various diseases and injuries (5). The DALYs, which sums up YLLs (years of life lost) and YLDs (years lived with disability), helps to evaluate and set priorities for health intervention and health service provision (6). Its calculation has been done in various dimensions, e.g., on a national level like Australia (7), Korea (8), on a global scale (9-12) and by disease group, cancer (8, 13, 14) and psychiatric disorder (15). Here, the estimation of the DALYs requires the calculation of disability weights, a component of YLDs measuring the severity of a disease between perfect health, 0 and death, 1 (16).
The WHO and the GBD Group recommend individual nations to measure their own disability weights in order to reflect their unique social contexts (17). In this vein, disability weights for main diseases were estimated separately during 1997-2003 regarding Australia (7), Korea (18, 19), the Netherlands (16) and other European nations (20). The estimated values for major cancers were higher in Korea than in Australia (19). The gaps were considerably high in kidney cancer and lymphomas/multiple myeloma, i.e., 0.399 and 0.339, respectively. However, some of these gaps might have disappeared in the past ten years as the past decade saw the following improvements in Korea. First, Korea's rate of acceptance for national cancer screening programs tripled from 12.9% in 2002 to 39.9% in 2011 (21), and this might have helped the rise of its cancer prevalence, given that cancer screening is reported to be beneficial in Korea for the early detection of various cancers such as stomach and pancreatic cancer (22, 23). Second, Korea's medical technology converged with other advanced nations, especially in selective, customized cancer treatment (24), and this might have contributed to the growth of cancer survival in the nation during the period. Indeed, with the Korea Cancer Center established in 2000 and the Cancer Control Act legislated in 2003, the Second 10-Year Plan for Cancer Control in Korea during 2006-2015 has resulted in the improvement of cancer survival from 46% to 62%, endeavoring for behavioral reform, medical-technological development and the reduction of cancer burden in Korea (25). All these changes are expected to have promoted the fall of disability weights for major cancers in Korea, and this discussion leads to the following hypothesis on the indicators for the nation: Disability weights for major cancers went down in Korea during 2003-2012 as underlying mechanism that the enhanced acceptance of cancer screening and the increased success of early detection led to the rise of cancer prevalence in Korea during the past ten years. On the other hand, the progress of medical technology contributed to the growth of cancer survival in the nation. These transitions promoted the fall of disability weights for major cancers in the nation.
It is important to reflect these social transitions in the burden-of-cancer study in Korea. Moreover, intra-rater, inter-rater and inter-method reliabilities for the estimation of disability weights should be attained for the affirmation of their common use. In these contexts, this research measures disability weights for all major cancers in Korea and check their reliabilities within respondents, between respondents and between methods.
MATERIALS AND METHODS
Data
Data came from 32 doctors in a general hospital with 2000 beds located in Seoul, Korea. This study is preliminary with a purposive sampling of the 32 doctors. The cancer patients in this hospital might be representative since many cancer patients in Korea take treatment in huge, reputable general hospitals located in Seoul (26-28). Indeed, this hospital ranks among top 3 in terms of the number of beds and cancer treatment in the nation. Also, oncologists in this hospital are expected to have clinical experience in all major cancers given that this hospital includes 15 prominent cancer centers.
Respondent's estimation of disability weights for a certain disease can be affected by his/her amount of knowledge on the disease (29). In this context, the 32 doctors were divided into oncologist and non-oncologist groups with rich experiences in cancer treatment and general treatment, respectively. The oncologist panel consists of 12 doctors, i.e., 6 in internal medicine and 6 in obstetrics and gynecology. The non-oncologist panels are made up of the 1st subgroup of 8 dermatologists and the 2nd subgroup of 12 psychiatrists for within-group homogeneity to be achieved.
Analysis
Disability weights were measured and intra-rater and inter-rater reliabilities were checked for 10 indicator diseases and 24 major cancers listed in Table 1 during October and November 2011. The Global Burden of Disease Study (GBD) approach (30) was used in this research. The analysis of this study consists of six steps explained below.
As the first step, the Person Trade Off (PTO) approach was repeated for each of the 10 indicator diseases in the following procedure. First, the estimation procedure was explained to the 32 respondents. Second, each of the 32 respondents was asked to choose a number N such that the extension of life by 1 yr for N people with the disease is indifferent to the extension of life by 1 yr for 100 healthy people. Third, each respondent explained the reason why he or she took the number while selecting one more N (this N was the final value).
As the second step, Visual Analogue Scale (VAS) approach was repeated for each of the 34 diseases (the 10 indicator diseases and the 24 major cancers) in a very similar way with the PTO method explained above. First, the estimation procedure was explained to the 32 respondents. Second, each of the 32 respondents was asked to rate the disease/cancer between 0 (the worst imaginable health state) and 100 (the best imaginable health state). Third, each respondent explained the reason why he or she did such rating while rating the disease/cancer one more time (this rating was the final value).
As the third step, intra-rater reliability was checked in the following manner during January and February 2012. First, the VAS scale and the disease list were mailed for each of the 32 respondents. Second, the VAS rating was obtained from each of the 32 respondents for each of the 10 indicator diseases and the 24 major cancers. Third, the median of disability weights (1-[VAS/100]) from the 32 respondents was calculated for each of the 34 diseases by study period, i.e., 2011 and 2012 (This created 34 medians in each study period). Fourth, a correlation was estimated between the 34 medians for 2011 and those for 2012.
As the fourth step, inter-rater reliability was assessed in the following procedure. First, the median of disability weights was calculated for each of the 24 cancers by the respondent group, i.e., 12 oncologists, 8 dermatologists, 12 psychiatrists (This created 24 medians for each respondent group). Second, a correlation was estimated between the 24 medians for one respondent group and those for another respondent group.
As the final step, inter-method reliability was evaluated in the following way. First, the median of disability weights from the 32 respondents based on the PTO approach and that based on the VAS method were calculated for each of the 10 indicator diseases (This created 10 medians on each approach, i.e., the PTO and the VAS). Second, a correlation was estimated between the 10 medians on the PTO and those on the VAS.
In this research, Spearman correlation was used and the 5% significance level was applied. There might be no consensus on the sample size required for Spearman correlation analysis as non-parametric estimation. A too small sample size creates too low precision while a too large sample size produces too much complexity in terms of computation. The sample sizes in this study (i.e., 34/24/10 for intra-rater/inter-rater/inter-method reliability assessment) look fine given that a group of mathematicians suggest that a sample size between 5 and 60 might be suitable for Spearman correlation (31).
RESULTS
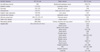
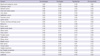
Table 2 shows the median of disability weights by the respondent group and by major cancer. The medians from the 32 respondents were relatively high for pancreas cancer (0.90), gallbladder cancer (0.81), mouth and oropharynx cancer (0.80), and esophagus cancer (0.80). Conversely, the medians were relatively low for breast cancer (0.37), prostate cancer (0.33) and thyroid cancer (0.10). All estimated values of inter-rater reliability were higher than 0.7 with the 1% significance level. Table 3 displays the correlation between the medians of disability weights for the respondent groups. The correlation was relatively low between the dermatologist and the oncologist (0.713), but relatively high between the oncologist and the psychiatrist (0.927). The statistics between the two non-oncologist groups was in the middle (0.873). Indeed, intra-rater reliability, the correlation between the medians of disability weights for 2011 and for 2012, was 0.752 with the 1% significance level. On the other hand, inter-method reliability, the correlation between the medians of disability weights on the PTO and the VAS, was 0.927 with the 1% significance level. Above all, the results of this study support the hypothesis that disability weights for major cancers went down in Korea during 2003-2012. Korea's disability weights for the 22 cancers were lower in this study than in a previous 2003 research (18, 19). The gaps were relatively low for mouth and oropharynx cancer (0.046), gallbladder cancer (0.055), esophagus cancer (0.063), and trachea, bronchus and lung cancer (0.064). On the contrary, the differences were relatively high for thyroid cancer (0.671), prostate cancer (0.461), breast cancer (0.449), and kidney cancer (0.409). Correlation between the medians of disability weights in the two studies was 0.583 with the 1% significance level.
DISCUSSION
This study estimated disability weights for 24 major cancers in Korea. They were relatively high for pancreas cancer (0.90), gallbladder cancer (0.81), mouth and oropharynx cancer (0.80) and esophagus cancer (0.80). Conversely, they were low for breast cancer (0.37), prostate cancer (0.33) and thyroid cancer (0.10). Regarding cancers with high disability weights, early screening is not successful, the quality of patient's life is low and the 5-yr relative survival rates are low, e.g., 7.6%, 24.9%, and 57.5% during 2004-2008 for pancreas, gallbladder and mouth and oropharynx cancers, respectively (2, 32). On the contrary, early screening is successful, the quality of patient's life is high and the 5-yr relative survival rates are high for cancers with low disability weights, i.e., 89.9%, 86.2%, and 99.3% for breast, prostate and thyroid cancers, respectively (2, 32). Similar conclusions were drawn on the comparison between this study and the previous research on disability weights for major cancers in 2003 (18, 19). The gaps were relatively low for the cancers with ineffective early screening and low 5-yr relative survival rates, including pancreas cancer (0.008), mouth and oropharynx cancer (0.046), gallbladder cancer (0.055), esophagus cancer (0.063), and trachea, bronchus and lung cancer (0.064). On the contrary, the differences were relatively high for the cancers with effective early screening and high 5-yr relative survival rates, such as breast cancer (0.449), prostate cancer (0.461), and thyroid cancer (0.671). Overall, with the 1% significance level, the correlation was moderate (0.583) between the medians of disability weights in the two studies. These findings suggest that the progress of medical technology contributed to the growth of cancer survival and the fall of disability weights for major cancers in Korea during the past 10 yr (albeit with the different size of the effect by cancer type).
A cross-national comparison of disability weights confirms traditional results on a negative relationship between living standards and disability weights for severe diseases including cancers (19). The gaps in the disability weights were quite apparent between 2003 Korea and 1999 Australia, e.g., liver cancer (0.352: 0.870 vs 0.518), gallbladder cancer (0.347: 0.865 vs 0.518), trachea, bronchus and lung cancer (0.183: 0.864 vs 0.681), colon and rectum cancer (0.299: 0.863 vs 0.564) and esophagus cancer (0.173: 0.863 vs 0.690) (7, 18, 19). However, these differences became smaller between 2011 Korea and 1999 Australia, e.g., liver cancer (0.082: 0.600 vs 0.518), gallbladder cancer (0.292: 0.810 vs 0.518), trachea, bronchus and lung cancer (0.119: 0.800 vs 0.681), colon and rectum cancer (-0.014: 0.550 vs 0.564), and esophagus cancer (0.110: 0.800 vs 0.690) (7). These results reflect that 1) some gaps in disability weights are still resilient for certain cancers between Korea and Australia (e.g., pancreas cancer), but 2) the differences are largely disappearing as Korea is catching up other advanced nations in terms of medical technology, especially in selective, customized cancer treatment (24).
This study compared the estimated values of disability weights for major cancers between the oncologist and non-oncologist groups, in order to examine whether the respondent's clinical knowledge and experience affect his/her estimation of disability weights. Existing rubrics of statement have been mixed on this issue, one camp (29) acknowledging but the other (33) denying the existence of the effect. The results of this research are consistent with the latter line of argument. The high correlation between the oncologist and non-oncologist panels show that, in spite of their differing clinical knowledge and experience, oncologists and non-oncologists might share similar views on the nature of cancers and the quality of patient's life. It can be noted, however, that the gaps in the median/estimation of disability weights exist for some cancers, e.g., Hodgkin lymphoma (0.24 for dermatologist vs oncologist, 0.22 for psychiatrist vs oncologist) and non-Hodgkin lymphoma (0.31 for dermatologist vs oncologist, 0.31 for psychiatrist vs oncologist). Lymphoma is a cancer with great variety in incidence, etiology and clinical progress relating to patient characteristics (34). Therefore, knowledge on this cancer might vary among doctors to a great extent, which might lead to their great differentials in disability weight measures.
Also, intra-rater reliability, the correlation between the medians of disability weights for 2011 and for 2012, was 0.752 with the 1% significance level. On the other hand, inter-method reliability, the correlation between the medians of disability weights on the PTO and the VAS, was 0.927 with the 1% significance level. These findings are consistent with the previous results (33). Based on the VAS approach, disability weights for mild diseases tend to be overestimated (30). However, most cancers are severe hence this is not a big issue for this study. Moreover, the VAS method is easy to understand and utilize (30).
This research has the following limitations. First, its data came from doctors in one general hospital. However, this might not be very problematic given that many cancer patients in Korean provinces take treatment in huge, reputable general hospitals located in Seoul (26-28) and this hospital ranks among top 3 in terms of the number of beds and cancer treatment in the nation. Hence, cancer patients in this hospital might be representative. Second, all of its respondents were doctors in a general hospital. Measuring disability weights for major cancers requires professional knowledge and experience. However, the collection of a more inclusive and representative sample will present additional insights on this line of study. Third, it does not consider different types of clinical conditions and the corresponding varieties of disability weights within a specific cancer. For example, the National Cancer Institute divides leukemia into two subcategories based on the pace of disease development, i.e., acute/chronic for developing quickly/slowly (35). In the Australian study, disability weights for a certain disease were divided into subcategories based on clinical conditions as well (7). For instance, a disability weight for prostate cancer was 0.270 in diagnosis and primary therapy, 0.270 in follow-up without active therapy, 0.200 in remission, 0.180 in the condition of being clinically disease-free after primary therapy, 0.640 in the state of being hormone refractory and 0.930 in the terminal stage. Instead, the respondents in this research evaluated the disability weights based on the most common clinical conditions in terms of histologic types and stages. It will be important to categorize disability weights for certain cancers based on their histologic types and stages as in the Australian study.
In spite of the limitations addressed above, disability weights for major cancers went down in Korea during 2003-2012, reflecting the nation's economic and medical-technological development during the past 10 yr. Also, this research extended the possibility of their common application by evaluating their reliabilities within respondents, between respondents and between methods. In this context, this research can contribute to the-burden-of-cancer studies in Korea and other nations.
 XML Download