

 PDF
PDF ePub
ePub Citation
 Print
Print


INTRODUCTION
Given that the prevalence of childhood obesity is rapidly increasing worldwide including Korea (1, 2), assessment of obesity in children and adolescents is important. One of the relevant components to consider in the screening and assessment of their obesity is body composition. Especially, body fat mass and distribution have been known to be important determinants in obesity related negative health outcomes (3, 4). In addition, childhood obesity is characterized by excessive accumulation of body fat and adipose tissue development (5).
Among many direct and indirect methods to assess body fat, body mass index (BMI) is used as the most popular index for evaluation of obesity because of its simplicity and low cost. Several sets of reference values for BMI in children and adolescents have been published (6, 7). However, many studies addressed its limitation for representing the body fat and a considerable level of misclassification (8-13). They found that the accuracy of BMI was dependent on degree of fatness in growing children (9-13). Thus, recently several countries have measured body fat by whole-body, dual-energy x-ray absorptiometry (DXA), bioelectrical impedance analysis or skinfold measurement in children and adolescents and tried to provide its age- and gender-specific percentile values for references (13-18). The findings could be important for early intervention and treatment of childhood obesity in the light of the significant change in body composition during growth and development. Therefore, the objective of this study is to develop percentile curves of body fat mass and fat free mass, and to examine the relationship among BMI, fat mass and fat free mass in Korean children and adolescents, using data of the Korea National Health and Nutrition Examination Survey (KNHANES) 2009-2010.
MATERIALS AND METHODS
Subjects
The subjects were participants in the 2009-2010 KNHANES which was a nationwide cross-sectional survey to assess the health and nutritional status of adults and children living in Korea and administered by the Ministry of Health and Welfare and the Korea Centers for Disease Control and Prevention (KCDC).The data was collected with a year-round, using a stratified multi-stage clustered probability sampling to select a representative sample of the non-institutionalized civilian Korean population. The number of study subjects was 1,579 who aged between 10 and 18 yr old (834 for boys and 745 girls).
Body composition
The BMI was then calculated as weight divided by height squared (kg/m2). Height was measured using a stadiometer (SECA, Hamburg, Germany) and weight using a balance beam scale (G-TECH, Uijeongbu, Korea) with participants wearing a standardized gown. Percentage body fat was measured by whole-body DXA scans, using a QDR Discovery (formerly, the QDR 4500A) fan beam densitometer (Hologic, Inc., Bedford, MA, USA). The examination was performed in accordance with manufacturer's acquisition procedures. The results of DXA were analyzed using industry standard techniques at the Korean Society of Osteoporosis; and the Hologic Discovery software (version 13.1) was used to analyze the scans. The DXA measurements included bone mineral content, bone mineral density, fat mass, lean mass including bone mineral content, and body fat percentage (%BF, fat mass/total mass × 100). From these data, fat mass index (FMI, fat mass excluding the head area/height[m]2) and fat free mass index (FFMI, lean mass/height[m]2) were calculated.
Statistical methods
The analysis was separately performed by gender. The differences of mean values for anthropometric and body composition measurements for each age between sex were tested by t-test. The %BF, FMI, and FFMI percentile curves were calculated by using Cole's Lamba, Mu, and Sigma (LMS) method LMSChartMaker Pro Version 2.54, Medical Research Council, London, UK) (19). The LMS method assumes that the data can be normalized by using power transformation. The percentile curves are the results of smoothing the age specific curves: L for skewness, M for median and S for coefficient of variation (20, 21).
The LMS model fitting was performed using sample weights. The final percentile curves were chosen by selecting more parsimonious models over more complex models based on deviance measurements among the models satisfying the goodness of fit based on Q tests. The Q statistic is considered adequate if the Q statistics curves for L, M, and S are within the range -2 and +2. All analyses were done using SAS version 9.2 (SAS Institute, Cary, NC, USA).
The percentile curves of %BF, fat mass and fat free mass were also plotted according to BMI level using the LMS. The BMI level was categorized into two groups; normal (< 85th percentile for age and sex) and at risk of overweight (≥ 85th percentile for age and sex) based on the Standard Growth Charts of Korean children and adolescents in 2007 published by the KCDC and Korean Pediatric Society (22). To examine the distribution of fat mass and fat free mass according to BMI group for age and sex, fat mass and fat free mass were classified into two groups based on the criteria of 75th percentile (the highest quartile) of each index.
RESULTS
Table 1 shows mean values of height, weight, BMI, %BF, fat mass, fat free mass, FMI, FFMI in each age and sex. Generally, height, weight and fat free mass were higher in boys but %BF and fat mass were lower than girls. Especially, fat mass appeared to be higher in boys than girls until 11 yr old, but since then, girls have had a significant higher fat mass than boys.
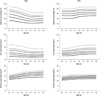
Smoothed LMS curves for the 15th, 25th, 50th, 75th, 85th, and 95th percentiles of %BF, FMI, and FFMI for boys and girls are presented in Fig. 1. For boys, %BF and FMI were the highest at age 10 yr and decreased until age 15 and then showed relatively flat pattern, whereas FFMI was the lowest at age 10 yr and gradually increased through adolescence. Girls had a relatively flat %BF and FMI at approximately age 13 yr and then increased between 13 and 14 yr old and then relatively stable and their FFMI also slightly increased at approximately age 16 yr and then were stable.
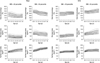
Fig. 2 shows the smoothed LMS curves of %BF, FMI, and FFMI according to BMI level. Generally, the patterns of curves for %BF, FMI and FFMI were similar between BMI groups in both boys and girls. Boys had relatively greater difference in each percentile value between BMI groups for %BF and FMI than girls during early adolescence (until around 13 or 14 yr old) but in the period of late adolescence, girls had greater difference than boys. For example, for FMI at 10 yr old, boys had the range of 2.4 (5th percentile) to 8.0 (95th percentile) in normal group versus 7.3 to 13.0 in group at risk of overweight based on BMI criteria but girls had 3.0 to 7.1 vs 6.4 to 9.6, respectively. However, FMI of boys at 18 yr old had 2.1 to 7.1 in normal group versus 4.7 to 9.8 in group at risk of overweight but girls had 4.6 to 8.2 vs 8.4 to 16.1, respectively. The percentile values of FFMI were slightly higher in overweight group than in normal group over the entire age range in both boys and girls.
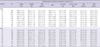
The distribution of FMI and FFMI according to BMI level by sex and age group is shown in Table 2. Boys and girls who were classified as normal by the BMI criteria were mostly included in the group below the 75th percentile of both FMI and FFMI (97%-100%). However, about 20% (boys aged 10-12 yr)-33% (girls aged 16-18 yr) of those at risk of overweight was classified as having FMI above the 75th percentile regardless of FFMI. Among boys and girls who were at risk of overweight, the percentage of those below the 75th percentile of FMI and above the 75th percentile of FFMI ranged from 9.5% (girls aged 16-18 yr) to 22.5% (boys aged 13-15 yr).
DISCUSSION
Given lack of information in the smoothed reference data for body fat composition indices for Korean children and adolescents, this study presented age and gender-specific percentile curves of body composition including %BF, FMI and FFMI, using nationally representative data. The pattern of %BF and fat mass development differed for boys and girls between 10 and 18 yr old. Among boys, there was a decrease in %BF and FMI during early adolescence but girls had an increase in the period of late adolescence. The pattern was more pronounced in the group at risk of overweight than normal group. Especially, the percentile distribution of FMI became more dispersed with age in girls at risk of overweight than other groups. Regarding fat free mass, boys and girls had consistent pattern, showing a gradually increased pattern with age.
The finding of different pattern for body fat mass between sex during childhood and adolescence was similar to those of other countries. Most of studies showed that boys had an increased fat mass until around 10-12 yr old and then a decreased pattern but girls showed a gradually increase in fat mass with age (14-17). In this study, because data were not available before 10 yr old, we could not examine the pattern during the period but the previous study for Korean children and adolescents observed that the pattern during the period was found to be similar to those of other countries (23). As the mean values of %BF in this study were compared with those of other studies measured by DXA, the mean value of %BF was similar to nationally representative US children showing 28.2% and 22.6% at age 10 yr and 18 yr for boys and 32.7% and 35.5% for girls, respectively. For the comparison with those of Chinese children and adolescents, the values of %BF in normal boys and girls in this study were slightly higher than those of normal Chinese boys and girls but other FMI and FFMI values by BMI level were similar to those of Chinese boys and girls in both normal and obese group (15).
In normal growth and development in children, boys gain more muscle and lean tissue than fat at puberty while girls gain more fat (24). The changes that occur at puberty were reflected in the curves of percentile for %BF, FMI, and FFMI in this study. These findings could suggest that the increases in BMI are attributable predominantly to increase in fat free mass of BMI (FFMI) in growing children, particularly in adolescent boys. Indeed, Maynard et al. (25) observed that the increase of fat free mass contributed to increases in BMI until late adolescence and the contribution of fat mass increase to BMI increase was higher in girl than in boys. Other studies have also examined that age-related increase in BMI during childhood was attributed to increasing fat free mass rather than fat mass (10, 12, 24). Thus, BMI which is often used to determine overweight and obesity of children and adolescents could not take into account the actual composition of body fat, leading to have a limitation in distinguishing between fat and lean mass. Since the pathology associated with obesity is driven by excessive fat mass, an index to directly assess adiposity is important in screening of overweight and obesity. Several studies reported that Asians have a lower BMI but a higher %BF compared to age-matched Caucasians (25-27), suggesting inappropriate use of universal BMI cut-off points as a proxy of adiposity related obesity assessment. In addition, a study assessing the ability of weight-and-height-based anthropometric indices like BMI for obesity screening among Asian adolescents showed that the indices had a low sensitivity to detect the obese adolescents (28).
These findings were also observed in this study. Because of no standard criteria for fat mass classifying overweight and obesity for children and adolescents, we defined the group with the highest quartile level (≥ 75th percentile) of FMI and FFMI as a relatively higher fat mass and fat free mass group. The magnitude of agreement between group at risk of overweight based on BMI and a relatively higher fat mass group (≥ 75th percentile of both FMI and FFMI or ≥ 75th percentile of FMI and < 75 percentile of FFMI) was low. The considerable proportion of boys and girls at risk of overweight was classified into the relatively normal fat mass group. Even among those at risk of overweight, the percentage of subject whose fat mass was relatively normal but fat free mass was relatively high was considerable, especially in boys. Given that several studies addressed to consider the fat mass reference in evaluations of BMI-based classification to assess overweight and obesity for children and adolescents because of the limitation of BMI (13-18), the information on the percentile values of body fat and their pattern during growth in this study would be helpful to complement assessment of overweight and obesity based on BMI.
This study has some limitations to interpret the results. Firstly, although the data was representative sample of Korean children and adolescents, the sample size was not enough to provide the reference value of %BF, FMI, and FFMI for each age. Thus, further large-scale studies are needed to establish appropriate reference values for age- and sex-specific %BF, fat mass and fat free mass percentiles and to verify their magnitude and pattern by BMI status. Secondly, because there is no standard fat mass cut-off value to assess overweight and obesity for children and adolescents, we choose the arbitrary cut-off value of the highest quartile level (≥ 75th percentile) to decide the higher fat mass and fat free mass group, and the cut-off value based on the quartile level has been used in other Asian children and adolescents studies (15, 29). Lastly, this study could not take into account the contribution of puberty on the change of fat mass and fat free mass because there was no specific staging information with respect to puberty.
Despite these limitations, the study has several strengths. For growing children and adolescents, the levels of both fat mass and fat free mass are influenced by body size such as stature (30). Thus, several studies have suggested FMI and FFMI normalized for stature, dividing by square of height as BMI is normalized for stature in order to increase comparability among fat mass, fat free mass and BMI (15, 31-34). This study examined the indices to consider the problems. Another strength is that DXA is known to more accurately quantify the body fat depot than other anthropometric measurements such as bioelectrical impedance analysis or skinfold measurement (35). This study provided more valid measurements of %BF, fat mass and fat free mass by DXA.
In conclusion, the study developed the smoothed percentile curves of %BF, fat mass and fat free mass for Korean children and adolescents. The results from percentile curves showed that the pattern of %BF, fat mass and fat free mass development differed for boys and girls between 10 and 18 yr old. In addition, when only BMI is used for screening overweight and obesity for children and adolescents, those with normal fat mass and high fat free mass appeared to be misclassified to overweight or obesity. Thus, in order to further control the weight of obese children, not only BMI change but also FFMI and FMI change should be used as monitoring indices. Further studies are needed to focus on developing gender and age specific cut-off values of these indices that are valid for the health risk-based definitions of pediatric obesity.

 XML Download