

 PDF
PDF ePub
ePub Citation
 Print
Print


INTRODUCTION
Monitoring of growth and development is the foundation of effective patient care in pediatrics. Growth reference charts are used around the world both to monitor for appropriate growth and to screen for possible genetic or developmental anomalies (1, 2). Children whose growth plots outside the range of normal, such as below the 3rd or above the 97th percentile, or whose growth velocity is beyond the normal range, may be exhibiting early signs of disease and warrant further evaluation (3). However, interpretation of growth patterns using conventional growth charts may be inaccurate and misleading due to a variety factors, including problems with the sampling method used to develop the standard. Most growth charts currently used in pediatric practice are constructed based on cross-sectional data and consist of the sum of data from different children, obtained from a single measurement. Therefore, these standards may not accurately reflect longitudinal growth of an individual child. Longitudinal growth is calculated by measuring a child's height at two time points and dividing that difference by the associated change in time (4). Since the use of growth charts based on cross-sectional measurements of height in a specific population may result in erroneous conclusions about the growth of individual children over time, most pediatricians believe that growth assessment by longitudinal standards is more accurate. Although a few outstanding longitudinal growth charts are currently in use (5-12), there is still a need for current longitudinal standards that are appropriate for specific populations. Unfortunately, the development of a reliable longitudinal growth standard is time consuming because of the requirements of a large patient population, long follow-up times, and careful handling and analysis of data.
Our study presents the height and height velocity charts from the large longitudinal population-based Kangwha study of growth of young and adolescent children in Korea. In addition, we describe the differences between our new longitudinal growth charts and the Korean National Growth Charts, which are based on cross-sectional measurements of height and are currently being used by most pediatricians to monitor the growth of children in Korea.
MATERIALS AND METHODS
This study was conducted as a part of a community-based prospective cohort study called the Kangwha Project, which started in 1986 in Kangwha County (13). Kangwha County is located on a large island, west of Seoul, and consists of rural villages and a small town. In this study, 800 school children (359 boys, 441 girls) who were born in 1980 were enrolled and followed between 1986 and 1999. The cohort included only healthy children with a documented birth history and past medical history. The sample size varied at different ages because of absent documentation and various reasons during this population-based, longitudinal study. The smallest sample size was 468 (200 boys, 268 girls) at the age of 19, and the largest sample size was 783 (342 boys, 441 girls) at the age of 15.
The examiners visited Kangwha County every summer and performed data collection for a period of 1 month after a week of training. Each subject was interviewed using a structured questionnaire. The examiners measured the height of subjects annually from 6 to 17 yr of age and finally at 19 yr of age. Height was measured to the nearest 0.1 cm by trained medical students using a stadiometer (SECA-225, SECA, Hamburg, Deutschland). The inter-observer error was within 0.2 cm. Near final height was defined as the height when growth velocity was <1 cm/yr. Longitudinal data in this study was compared to cross-sectional data from the 2007 Korean National Growth Charts (14).
Longitudinal data were analyzed using a linear mixed model (LMM), excluding confounder factors, to construct longitudinal standards for height and height velocity. We used the LMM and chi-square test to verify the demographic trends of continuous and categorical variables over the ordinal variable of time, respectively. We corrected for possible confounder factors and compensated for baseline measurements. Measurements were interpolated to exact ages because subjects are not measured at exactly the same age. We computed the estimated functional values for age, and the interpolated values were taken to be equal to the estimated functional values at the interpolated age. Significance was determined as P<0.05. Data were analyzed with the SAS program (version 9.2; SAS Institute, Cary, NC, USA).
Ethics statement
This study was approved by the institutional review board of Yonsei University Severance Hospital in 2010 (IRB number 4-2009-0624). Written informed consent could not be obtained at start of the Kangwha cohort (1986) and was exempted before approval of the study. Then, we obtained written informed consent from the subjects participating in the Kangwha study.
RESULTS
Height reference values for Korean children from 6 to 19 yr of age
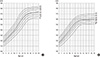
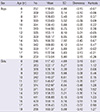
Table 1 displays the mean and standard deviation (SD) values for height in Korean boys and girls from 6 to 19 yr of age. The distribution of height values was approximately normal at most ages, according to the skewness and kurtosis values. Final height in this study was 173.5 cm for boys and 160 cm for girls. The height reference curves were constructed from these data (Fig. 1).
Height velocity reference values for Korean children from 7 to 19 yr of age
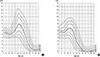
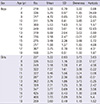
Table 2 shows the mean and SD values for height velocity in Korean boys and girls from 7 to 19 yr of age. The distribution of height velocity values was significantly positively skewed at most ages. It was suspected that the skewness might be due to variations in the timing of each child's pubertal development. The kurtosis of the height velocity curve for girls at 17 yr of age was very high and may not be applicable, because the observed data were dense. The height velocity reference curves were constructed from these data (Fig. 2). In boys, height velocity at 9 yr of age was 4.72 cm/yr, lower than height velocity at 8 and 10 yr of age. This phenomenon was not definite in girls. It was thought that mid-childhood growth spurt could be found in boys before puberty (15). Peak height velocity (PHV) was observed at 12 yr in boys and 10 yr in girls. The PHV was 8.62 cm/yr in boys and 7.07 cm/yr in girls (Table 2). This shows that girls attain peak height velocity 2 yr earlier than boys. The height velocity at the 25th percentile, which is required to maintain a child's height percentile on the growth chart, was >4.6 cm/yr before puberty and >6 cm/yr during puberty in boys. In girls, the 25th percentile height velocity was >4.8 cm/yr before puberty and >5.6 cm/yr during puberty. The mean height velocity was <1 cm/yr at 17 yr in boys and 15 yr in girls.
Comparison of the longitudinal standards for height with the Korean National Growth Charts
Fig. 1 displays a comparison of height values in the Korean National Growth Charts and our longitudinal standards for height in children 6 to 19 yr of age. The mean final heights of children at the 50th percentile for height in the Korean National Growth Charts and longitudinal standards were 173 cm and 172.5 cm for boys, and 160.5 cm and 159.5 cm for girls. Thus, differences in final height were minimal between the Korean National Growth Charts and our longitudinal standards. However, the mean heights attained in boys at the 50th percentile for height from ages 6 to 15 yr using our longitudinal standards were higher than those using the Korean National Growth Charts (Fig. 1A). A similar pattern was observed in girls between the ages of 6 and 13 yr (Fig. 1B). The heights between the 3rd and 97th percentiles converged in a narrow range in the Korean National Growth Charts compared with heights using our longitudinal standards, for both genders.
Comparison of longitudinal standards for height velocity with those from the Korean National Growth Charts
Height velocity at the 50th percentile line, calculated from cross-sectional data, demonstrated a wider and diminished peak compared with similar height velocities in our longitudinal standards. The height velocity curve from the Korean National Growth Charts had a peak that was between the 25th and 50th percentiles in longitudinal standards, both in boys and girls (Fig. 2).
DISCUSSION
Growth reference charts are essential to assess appropriate growth of individual children. Since conventional growth charts constructed with cross-sectional data were not developed by following the linear growth of individual children, it is likely that growth charts developed by following the growth of a large group of children over time will be more accurate. However, it is very hard to collect longitudinal data because following a group of children for many years is time-consuming and the cohort group must be large enough to take into account the inevitable withdrawal of subjects from the study (9). Therefore, most growth charts are based on cross-sectional data. The Korean Pediatric Society and the Ministry of Health and Welfare in Korean Government have developed the Korean National Growth Charts every 10 yr since 1967, using cross-sectional data. This study is the first to present longitudinal standards for height and height velocity in Korean children and adolescents.
In this study the final height was 173.5 cm for males and 160.5 cm for females, which was very close to final heights in the 2007 Korean National Growth Charts. Even though final height was similar between cross-sectional and our longitudinal standards, the longitudinal means were higher than cross-sectional means by 1-4 cm from 6 yr of age until the completion of puberty. These findings suggest that prediction of final height with cross-sectional standards may be an overestimate, based on the assumption that longitudinal standards are more accurate for assessing an individual's longitudinal growth.
The growth spurt is associated with the appearance of secondary sex characteristics in puberty. The pubertal growth characteristics including PHV and age at PHV contribute to final adult height (7, 16). PHV was calculated as 8.6 cm/yr at 12 yr of age in boys, and 7.1 cm/yr at 10 yr of age for girls in our study. The PHV was 7.7 cm/yr at 13 yr of age in boys, and 6.9 cm/yr at 10 yr of age for girls in the 2007 Korean National Growth Charts. The height velocity curve derived from the Korean National Growth Charts had a peak that was between the 25th and 50th percentile for height velocity curve peaks both in boys and girls and was wider compared with longitudinal standards. A similar longitudinal study was conducted by Lee et al. (12) in Taiwanese children. The age at PHV in that study was 12.5 yr for boys and 10.5 yr for girls. The whole year PHV was 8.0 cm/yr in boys and 7.0 cm/yr in Taiwanese girls (12). The mean growth velocity was <1 cm in boys and girls at 17 and 15 yr of age, respectively. Mean heights were 170.8 cm in boys and 158.7 cm in Taiwanese girls. These were similar to our results, except that PHV was lower in boys by 0.6 cm/yr. Final height was shorter by 2.7 cm in boys and by 1.3 cm in Taiwanese girls. In contrast, longitudinal studies in Western populations show that PHV is higher (9.42-9.79 cm/yr for boys and 7.12-8.3 cm/yr for girls), the age at PHV is later (13.5-14 yr for boys and 11.5-12 yr for girls), and final height is higher (176.8-180.43 cm for boys and 163.8-167.59 cm for girls) (7-11). Higher PHV and later age at PHV in Western populations may explain their increased final height. The age when the mean height velocity was <1 cm/yr was 17 yr in boys and 15 yr in girls in our study. The age at which children reached final height was similar both in Western and Asian populations. Pubertal growth consists of a phase of accelerated growth, followed by a phase of growth deceleration, and eventual cessation of growth with closure of the epiphyses (17). All studies including ours have shown similar growth patterns during puberty. Interestingly, the mid-childhood growth spurt was observed at 10 yr in boys and 8 yr in girls, which was two years earlier than the age at PHV in our study (Table 2). Previous studies have also reported a mid-childhood growth spurt in some children between 6 and 9 yr of age (15, 18).
Although this study has major strengths with respect to collection of data in a relatively large cohort of children for 20 yr, it also shows the inevitable difficulties and some limitations of such a long-term study. First, we did not account for pubertal stage in this study. For this reason, we could not determine the association between the growth spurt and puberty. Second, Kangwha county is a small rural region of Korea, therefore it may not be representative of the entire population of Korean children. Growth of children in an urban region may differ from the growth of children who live in rural areas. Some studies have demonstrated that height is significantly greater in urban compared with rural children (19, 20). Socio-environmental conditions as well as nutritional status might explain these differences between children living in urban and rural areas (21). Third, we did not account for factors that may influence linear growth, such as malnutrition or obesity in childhood (22-24). The growth velocity of obese children is known to be higher than that of lean children in the pre-pubertal period, but decreases notably during puberty (22). Body weight and body mass index may be important confounding factors; however, we did not analyze the effects of these variables on our results. Finally, this study did not consider the phenomenon that is said to be conditional on tempo (7). Actually, children during puberty can be divided according to the tempo of pubertal maturation, such as average, early, and late-maturing children. Longitudinal standards considering condition on tempo are being analyzed and will be the subject of a future report.
In conclusion, we have presented the first report of longitudinal standards for height and height velocity in Korean children and adolescents by analyzing population-based, longitudinal data from the Kangwha cohort.
 XML Download