

 PDF
PDF ePub
ePub Citation
 Print
Print


INTRODUCTION
Despite continuing improvements in perinatal and neonatal intensive care medicine, birth asphyxia and the resultant hypoxic ischemic encephalopathy (HIE) still remains a major cause of neonatal mortality and permanent neurologic sequelae such as cerebral palsy, mental retardation, learning disability, and epilepsy in survivors (1). Currently, hypothermia has emerged as the only available effective intervention to improve the outcome of HIE (2). However, the identification of infants who might benefit from hypothermia, and the monitoring of therapeutic responsiveness after intervention for neonates with severe brain injury continue to be the most difficult dilemmas in clinical practice (2). Therefore, the development of new diagnostic tools that can detect the brain cell death quantitatively in in vivo settings, and thereby can early predict the ultimate outcome of HIE is an urgent big clinical subject.
Proton magnetic spectroscopy (1H-MRS) is a noninvasive in vivo technique that increases the accuracy of diagnosis compared to the use of routine magnetic resonance imaging (MRI) alone, and is often performed to qualitatively diagnose diseases of the central nervous system (3). As a parameter of 1H-MRS, increased signal intensity of the lipid peak at 1.3 ppm has high diagnostic value of brain lesion because this peak is absent in healthy brain tissue (4). Increased lipid peak could detect and quantify different degrees of apoptosis both in vitro and in vivo (4-7). Lipid peak was also observed in necrotic cell death (4, 7). These findings strongly suggest that 1H-MRS visible lipid peak has a great potential to become a reliable noninvasive tool for detection and quantification of cell death in vivo, and also useful in the early outcome prediction of HIE.
In our previous studies, we have shown that flow cytometric detection of apoptotic and necrotic cell death with annexin V and propidium iodide (PI) (8) and flow cytometric monitoring of changes in the mitochondrial membrane potential (ΔΨ) with fluorescent probe JC-1 (5,5',6,6'-tetrachloro-1,1',3,3'-tetraethylbenzimidazolcarbocyanine iodide) (9) are both sensitive and reliable techniques in the quantitative evaluation of neonatal brain injury. We have also observed that inhibition of apoptosis with cycloheximide significantly reduces the ensuing cerebral infarction in the newborn rat pup model of hypoxia and ischemia (10). In the present study, to verify the accuracy of 1H-MRS lipid peak as a noninvasive tool for quantitative in vivo detection of brain cell death, we measured 1H-MRS peak at 1.3 ppm at 24 hr after hypoxia ischemia in the newborn rat pup model of HIE and cyclohexamide treatment, and compared with the extent of brain injury measured by flow cytometric analyses of annexin V/PI and JC-1.
MATERIALS AND METHODS
Animal model
The experimental protocols were reviewed and approved by the animal care and use committee of the Samsung Biomedical Research Institute in Seoul, Korea. This study also followed the institutional and National Institute of Health guidelines for laboratory animal care (C-A4-108). We randomly divided rat pups into three groups: normoxia control (NC, n=5); hypoxia ischemia control (HI, n=9); and hypoxia ischemia with cycloheximide treatment (HI-CHX, n=14). Unilateral carotid artery ligation was induced in seven-day-old Sprague Dawley rat pups (Daihan Biolink Co., Seoul, Korea) under anesthesia by inhalation of a mixture of halothane and 2:1 nitrous oxide and oxygen. The neck was incised in the midline, and the right common carotid artery was permanently ligated with 4-0 silk. The total time of surgery in each animal never exceeded five minutes. Following surgery, rats were returned to their mother for recovery and feeding for 2 hr. Sham operation was done for the NC group, and maintained in room air with their mother. The pups in other groups were exposed for 120 min to hypoxia (8% O2, 92% N2) by placing them in an air-tight chamber partially submerged in a temperature-controlled water bath to maintain the ambient temperature inside the chamber at a constant 36℃. In the HI-CHX group, rat pups received an intraperitoneal injection of cycloheximide at a dose of 0.6 mg/kg after a 2-hr recovery period, and an equal volume of normal saline was administered to the HI group. The rat pups were then returned to their mothers. At 24 hr after the hypoxic insult, newborn rats were examined by magnetic resonance imaging (MRI) and localized 1H-MRS. After MRS analysis, rats were sacrificed under deep pentobarbital anesthesia (60 mg/kg, intraperitoneal), and brains were removed and dropped into cold phosphate buffered saline (PBS). Part of the brain cortex was removed for FACS analysis (8-10).
MRI/1H-MRS
All spectra were acquired using a 4.7 Tesla Bruker Biospec MRI/MRS system (Bruker, Fällanden, Switzerland) 24 hr after HI. T2-weighted MRI was performed to identify the HI lesion and to obtain localizer images. A 7-mm-diameter round surface coil placed on the intact scalp over the parietotemporal lobe was used to transmit and receive the signal. A 2×2×3 mm3 single voxel was chosen on the parietotemporal area for MRS as a volume selective spectroscopy sequence and the following acquisition parameters were used: repetition time=3,000 msec, time to echo (TE)=30 msec, and number of scans=128. To differentiate the lipid signal from lactate appearing at 1.3 ppm, the spectrum was acquired with TE of 135 msec and those signals not inverted at 1.3 ppm were confirmed as lipid signals.
Flow cytometry
The brain was divided into hemispheres and the meninges were removed. The cortex was chopped up, placed in 2 mg/mL collagenase, diapase and 1× trypsin (0.25%) in PBS solution and incubated for 10 min at 37℃. PI (1 µL of 1 mg/mL; Sigma, St. Louis, MO, USA) and annexin V-fluorescein isothiocyanate (FITC) (5 µL of 0.5 mg/mL; Pharmingen, San Diego, CA, USA) were immediately added to 95 µL of cell suspension containing more than 1×10⁶ cells to fluorescently label apoptotic and necrotic cells. After incubation for 15 min at room temperature, each sample was mixed with 1 mL of annexin V binding buffer (10 mM N-2-hydroxyethylpiperazine-N-2-ethanesulfonic acid [HEPES]-NaOH, pH 7, 140 mM NaCl, 2.5 mM CaCl2) in a particle analyzing system tube (1.5 mL, Ø 55 mm×12 mm, Sarstedt, Germany). Flow cytometric analysis was carried out using a particle analyzing system and Partec FloMax software (Partec, Munster, Germany) equipped with an argon ion laser tuned to a wavelength of 488 nm. Green FITC-annexin V fluorescence was measured at 530±15 nm, and red PI fluorescence was measured at 600 nm. To exclude dead cells or debris, a primary gate based on physical parameters (forward and side light scatter, respectively) was set.
Fluorescent probe JC-1 (Molecular Probes, Eugene, OR, USA) was used to measure mitochondrial membrane potential. The dissociated cortical cell suspension was adjusted to a density of 1×10⁶ cells/mL and stained with 1 µL of JC-1 (2 mg/mL) at 37℃ for 20 min. JC-1 was excited with the 488 nm argon laser, and JC-1 green and orange fluorescence was measured on FL1 (530±15 nm band pass filter) and FL2 (575±13 nm band pass filter) channels (11). Within the gated region, a minimum of 20,000 cells were scanned and analyzed. FL-2 versus FL-1 blotting and a high-speed cell sorter FACS Aria (Becton Dickinson, San Jose, CA, USA) were used for cell sorting gates. All databases were maintained with Flow Jo software (Tree Star, Ashland, OR, USA).
Brain ATP and lactate measurements
Reserved brain tissue was dropped in 1.6 mL of 3 M perchloric acid and homogenized. The homogenate was centrifuged at 12,000 g for 10 min. A 1 mL-sample of the supernatant was carefully removed into another tube with neutralizing solution (2.23 M K2CO3, 0.5 M triethanolamine, 2:3 mixture). The solution was centrifuged at 1,800 g for 10 min. The supernatant was analyzed for adenosine-5'-triphosphate (ATP) and lactate. ATP content of the brain homogenate was measured using a luciferin-luciferase assay kit (ATP bioluminescence assay kit, Roche Molecular Biochemicals, Mannheim, Germany), and lactate concentration was determined with a lactate dehydrogenase kit.
Statistical analysis
All data are presented as the mean±standard deviation. Statistical comparisons between groups were performed using the Kruskal-Wallis test and the Mann-Whitney test. The correlation coefficients for the relationships between MRS and flow cytometry findings were obtained by Spearman correlation tests. SPSS version 17 (Statistical Package for Social Sciences; SPSS Inc., Chicago, IL, USA) was used for all statistical analyses. A P value <0.05 was considered statistically significant.
RESULTS
MRI/1H-MRS findings
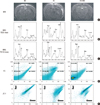
Representative MRI/1H-MRS findings of each group are shown in Fig. 1. T2 weighted brain MRI images obtained at 24 hr after HI showed brain infarction in the HI group, and the extent of brain infarction was attenuated in the HI-CHX group. As shown in Fig. 1 of HI-CHX group, increased lipid peak at 1.3 ppm was observed even without definite T2 weighted MRI images of brain infarction in a couple of cases, and this finding is quite similar with other previous reports (12). There were no significant differences in the N-acetyl aspartate (NAA), choline and creatine levels of 1H-MRS between the experimental groups. Significantly increased lipid peak at 1.3 ppm and lipid/NAA, lipid/creatine and lipid/choline ratios observed in the HI group compared to the NC group were significantly attenuated in the HI-CHX group (Fig. 1, Table 1). The increased lipid peak observed in both HI and HI-CHX was not inverted at TE 135 msec.
Flow cytometry
Representative flow cytometry findings with annexin V and PI of each group are shown in Fig. 1. Significantly increased levels of oncotic (annexin V-/PI+, Q1), necrotic (annexin V+/PI+, Q2), and apoptotic (annexin V+/PI-, Q4) cells in the HI group were significantly attenuated in the HI-CHX group (Fig. 1, Table 1). However, improvement of the HI induced reduction in the normal live (annexin V-/PI-, Q3) cells with CHX treatment did not reach a statistical significance.
The JC-1 (green+/red-) dot plot denoted mitochondrial membrane depolarization, which is indicated by a shift in JC-1 fluorescence from red to green. Loss of ΔΨ (JC-1: green+/red-) observed in the HI group compared to the NC group was also significantly improved in the HI-CHX group (Fig. 1, Table 1).
Brain ATP and lactate levels
Brain ATP and lactate levels in the HI group were slightly but significantly reduced and increased respectively compared to the NC group. These abnormalities observed in the HI group showed a tendency to improve without statistical significance in the HI-CHX group (Table 1).
Spearman's correlation analysis
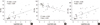
In correlation analyses, the lipid/NAA, lipid/creatine and lipid/choline ratios of 1H-MRS showed significant positive correlation with the oncotic (annexin V-/PI+, Q1), (secondary) necrotic (annexin V+/PI+, Q2) and apoptotic (annexin V+/PI-, Q4) cells and loss of ΔΨ measured with JC-1, and significant negative correlation with the normal live (annexin V-/PI-, Q3) cells measured with the flow cytometry (Table 2, Fig. 2).
DISCUSSION
In the present study, increased lipid peak at 1.3 ppm and the lipid/NAA, lipid/creatine and lipid/choline ratios of 1H-MRS observed in the HI group compared to the NC group were significantly attenuated in the HI-CHX group. In accordance with the 1H-MRS data, increased apoptotic and necrotic cells measured by flow cytometry with annexin V/PI, and the loss of ΔΨ measured with fluorescent probe JC-1 observed in the HI group compared to the NC group were significantly attenuated in the HI-CHX group. These findings verify the accuracy of 1H-MRS lipid peak as a noninvasive tool for quantitative in vivo detection of brain cell death during HIE.
As single voxel at the paritotemporal area MRS data were analyzed in the present study, there might be variation in MRS measurements according to voxel location. However, other multi-voxel MRS results (3, 13-15) have shown that the discrepancy, if any, according to the target voxel location might not be clinically significant.
In the present study, consistent with our previous studies (10, 16), CHX significantly attenuated the HI induced loss of ΔΨ and increase in both apoptotic and necrotic brain cell death. Moreover, the lipid peak of 1H-MRS was increased even before MRI detection of brain infarction. These findings suggest that the lipid peak of 1H-MRS might be a very sensitive and reliable diagnostic tool not only for the early detection of brain injury but also for in vivo real time monitoring for therapeutic efficacy after intervention during HIE. However, as cyloheximide is harmful to human, further studies for monitoring responsiveness to therapeutic hypothermia, the only currently available intervention for asphyxia brain injury, will be necessary for future clinical translation.
Proton magnetic resonance spectroscopy provides information about metabolites and brain function without exposure to radiation, and is thus a useful non-invasive method for research of brain development and detection of changes in metabolic states in HI brain injury (17). In the pathogenesis of neonatal HI injury, lipolysis of the neuronal membrane releases free fatty acids and diacylglycerides, starting within a few minutes from the onset of injury and continuing thereafter. Macrophage breakdown of cell membranes leads to lipids accumulate in necrotic tissue (18, 19) and, at 1.3 ppm, 1H-MRS (TE 30 msec) can detect lipid signals which strongly correlated with the amount of triglycerides and cholesterol esters extracted from brain samples in the rat model of stroke (4). A lactate peak at 1.3 ppm has also been detected in 1H-MRS (TE 30 msec), so that lipid and lactate overlaps in MRS spectra. In the present study, to differentiate the spectra of lipid from lactate at 1.3 ppm, an MRS spectrum with TE 135 msec, which indicate lactate levels as typical doublet inversion of lipid signal, was acquired. Our results of MRS spectrum with TE 135 msec displayed the lipid signal which consistently showed an upward peak without doublet inversion (20), and this affirms that detected lipid signal intensity is clearly representative with cancellation of lactate interference.
In our previous studies, we have shown that flow cytometric analysis with annexin V/PI is a sensitive and reliable technique for rapid quantification of apoptotic and necrotic brain cell death during HIE (9). In the present study, lipid peak of 1H-MRS showed significant correlation with the annexin V+/PI- apoptotic cells and annexin V+/PI+ secondary necrotic cells measured by flow cytometry with annexin V/PI. These findings indicate that the lipid peak at 1.3 ppm measured with 1H-MRS would be a sensitive and reliable technique for quantitative in vivo detection of both apoptotic and necrotic brain cell death during HIE.
Brain injury during birth asphyxia occurs biphasically not only during 'primary energy failure' resulting from cellular hypoxia but also 'secondary energy failure' during the reoxygenation and reperfusion period (21). The degree of 'secondary energy failure' reflects the extent of brain damage and thus predicts ultimate outcome such as mortality and neurodevelopmental outcome (2). Our data of significantly reduced brain ATP level in the HI group compared to the NC group measured at 24 hr after HI indicates HI-induced secondary energy failure. Slight but significant increase in the brain lactate level, and significant loss of ΔΨ measured with JC-1 implicate that loss of ΔΨ rather than cellular hypoxia is primarily responsible for the brain cell death during 'secondary energy failure', and the peak at 1.3 ppm observed with 1H-MRS primarily represents lipid rather lactate peak. Furthermore, our data of significant correlation of lipid peak measured by 1H-MRS with loss of ΔΨ measured with JC-1 suggests that the extent of brain cell death due to loss of ΔΨ during secondary energy failure could be quantitatively monitored real time in vivo.
In conclusion, increased lipid peak at 1.3 ppm measured by 1H-MRS during HIE showed significant correlation with the extent of loss of ΔΨ measured by JC-1 and both apoptotic and necrotic brain cell death measured by flow cytometry with annexin V/PI. These findings suggest that lipid peak at 1.3 ppm measured by 1H-MRS would be a sensitive and reliable diagnostic tool for quantitative in vivo detection of brain cell death during HIE.

 XML Download