

 PDF
PDF ePub
ePub Citation
 Print
Print


INTRODUCTION
Elevated blood pressure (BP) is the leading cause of cardiovascular disease (1). Much evidence suggests that dietary salt intake plays an important role in regulating BP (2, 3), and is related to cardiovascular events (4). Plasma sodium (pNa) is determined by multiple factors including dietary salt intake, fluid intake, and the excretion of sodium via the kidney (5). When salt intake is increased, a rise in pNa is immediately buffered by several compensatory mechanisms. The elevated osmotic pressure of the plasma gives rise to the sequestration of fluid into the plasma, stimulates the thirst center and vasopressin secretion, and increases sodium excretion (6, 7). In spite of these compensations, a significant but small increase in pNa is observed with progressive increases in salt intake (6-8). A few studies have shown associations between BP and pNa, although the results are not consistent (9-11). pNa was positively associated with systolic BP (SBP) but not with diastolic BP (DBP), in both men and women (9). The prevalence of higher pNa (≥147 mM/L) was frequent in hypertensive patients (10). In contrast, a significant inverse association was evident between pNa and DBP, and there was no association between pNa and SBP in middle-aged males (11). In addition, little was known about the effect of pNa on long-term outcome. Low pNa levels are reportedly related to stroke and all-cause mortality (12, 13), and the incidence of mortality is reportedly increased in hypernatremia (13). Hyponatremia and hypernatremia are associated with medical conditions such as heart failure and malignancy, and frequently result in hospitalization (11-14). However, the risk of mortality in subjects within the normal range of pNa has not been evaluated.
We evaluated the association between pNa and BP stratified by age and gender in a healthy Korean population, and estimated the risks of all-cause mortality according to increases in pNa, within the normal range.
MATERIALS AND METHODS
Subjects
After excluding the participants who were taking anti-hypertensive medication, had diabetes mellitus (DM), or had a glomerular filtration rate (eGFR)<60 mL/min/1.73 m2, we included the records of 100,649 adults aged ≥18 yr. These patients had undergone a voluntary routine health check-up at the Seoul National University Hospital during the period 1995-2006, and at the Seoul National University Bundang Hospital and Healthcare System Gangnam Center during 2003-2009. When multiple-visit data were available for a subject, we included only the data acquired during the first visit. The subjects had answered questions relating to smoking and drinking habits, medical history of renal disease, DM, hypertension, angina pectoris, acute myocardial infarction, and self-medication, prior to the examination.
Measurements and definitions
The participants arrived at the hospitals after an overnight fast for at least 12 hr, completed the questionnaires, had their BP measured, and underwent blood and urine tests. Serum creatinine was measured by the Jaffe reaction, and sodium was measured by Denka ISER Reagent (Denka Seiken, Tokyo, Japan) with an automated analyzer (TBA-200FR, Toshiba, Tokyo, Japan) in 3 hospitals, except for the Seoul National University Hospital, from 1995 to 1999 (Hitachi 747, Hitachi Co., Nagashi, Japan). The eGFR was calculated using the Modification of Diet in Renal Disease study equation (15). Proteinuria was determined by the urine dipstick test and defined as there being traces of protein or more. The CLINITEK ATLAS automated urine analyzer was used in the 3 hospitals. We measured blood pressure from the left arm of the participant who was seated for 30 min before the measurement. Blood pressure was assessed with an oscillometric device (Colin Press-Mate BP-8800, Colin, Komaki, Japan). The use of anti-hypertension medications was recorded by a self-reported history. DM was defined as a fasting glucose of 126 mg/dL or greater, a self-reported history of DM, or use of hypoglycemic agents. A history of coronary artery disease (CAD) was defined as a self-reported history of angina or acute myocardial infarction. Body mass index (BMI) was calculated on the basis of weight and height (weight [kg]/height [m2]). The components of metabolic syndrome were defined by the National Cholesterol Education Program ATP III (16). We divided the participants into 4 groups according to the pNa levels: group 1, 138-140 mM/L; group 2, 141-142 mM/L; group 3, 143-144 mM/L; and group 4, ≥145 mM/L.
Outcome
We combined the mortality data from Statistics Korea with our dataset using each individual's unique identifier (17). Mortality data were obtained until December 2009.
Statistical analyses
All analyses were performed using SPSS (SPSS version 18.0, Chicago, IL, USA). Data are presented as the mean±standard deviation for continuous variables and as proportions for categorical variables. Differences in continuous variables were analyzed by one-way analysis of variance (ANOVA), and differences in categorical variables were analyzed by chi-square tests. Co-variate ANOVA (ANCOVA) was used for adjusting independent factors related to BP such as age, eGFR, BMI, total serum cholesterol, protein, calcium, phosphorus, glucose, potassium, high density lipoprotein cholesterol (HDL cholesterol), and alkaline phosphatase (ALP). Statistical significance was deemed to be indicated when P<0.05. To detect intra-group differences in BP among the 4 sodium groups, we used Bonferroni's correction (P<0.05/9=0.006 or P<0.05/4=0.013). The group with pNa 138-140 mM/L was designated the reference group. These analyses were adjusted for gender, age, eGFR, BMI, calcium, total serum cholesterol, phosphorus, fasting glucose, potassium, ALP, HDL cholesterol, and metabolic syndrome. We compared the cumulative incidence of all-cause mortality between participants, and categorized them into 4 groups according to the pNa levels, via a log-rank test. Cox's hazard proportional analysis was used to estimate the hazard ratios (HRs) for all-cause mortality.
RESULTS
Characteristics of participants
We excluded 12,703 with a history of anti-hypertensive medication, 10,486 diabetics, and 8,209 with an eGFR<60 mL/min/1.73 m2 of the all participants. In addition, we excluded 3,640 participants with pNa<138 mM/L; the remaining 97,009 participants were enrolled in the study.
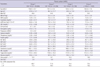
Of the 97,009 participants, 52.7% were male, median age was 49 yr, 17.9% had metabolic syndrome, and 0.6% had CAD. We divided the 97,009 participants into 4 groups according to pNa levels and designated group 1 as the reference group. Of the 4 sodium groups, age (P<0.001), gender, BMI (P<0.001), BUN (P<0.001), creatinine (P<0.001), eGFR (P<0.001), hemoglobin (P<0.001), potassium (P<0.001), calcium (P<0.001), phosphorus (P<0.001), protein (P<0.001), ALP (P<0.001), total serum cholesterol (P<0.001), HDL cholesterol (P<0.001), glucose (P=0.002), HbA1c (P<0.001), urine protein ≥1+ by dipstick, CAD, number of metabolic syndrome components ALT (P=0.007), were significantly different, as determined by ANOVA or chi-square tests (Table 1).
BP according to pNa levels
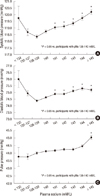
All patients showed positive correlations between pNa and SBP, DBP, or PP (P for trend<0.001). Fig. 1A shows the relationship between SBP and pNa levels. In participants with pNa ≥141 mM/L, SBP was significantly higher compared to those with pNa 138-139 mM/L, after adjustment for age, eGFR, BMI, total serum cholesterol, protein, calcium, phosphorus, glucose, potassium, HDL cholesterol, and ALP (P<0.001). There was no significant difference in SBP between participants with pNa levels of 138 mM/L and 140 mM/L (Fig. 1A). DBP according to pNa levels was also analyzed. DBP in participants with pNa ≥141 mM/L was significantly higher than in those with pNa levels 138-139 mM/L (P<0.001), after adjustment for the above-mentioned factors (Fig. 1B). While pulse pressure (PP) in the pNa ≥144 mM/L group was significantly higher than that of the pNa 138-189 mM/L group; a positive correlation was evident between PP and pNa (P for trend <0.001) (Fig. 1C).
Blood pressure according to sodium groups stratified by age and gender
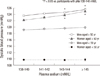
We subdivided the participants into 4 groups by age and gender: women aged ≥50 yr (n=22,243), men aged ≥50 yr (n= 23,221), women aged<50 yr (n=23,654), and men aged<50 yr (n=27,891). In women aged ≥50 yr, SBP (P<0.001), DBP (P≤0.002), and PP (P≤0.004) of sodium groups 3-4 were significantly higher than that of group 1. In men aged ≥50 yr, SBP in participants in group 3 (P=0.003) and group 4 (P<0.001), DBP in group 3 (P=0.013) and PP in group 4 (P<0.001) were all higher than the corresponding values in group 1. In participants aged<50 yr, SBP, DBP, and PP were not significantly different according to sodium groups in women; in men, only DBP in participants in group 3 was significantly higher than that of men in group 1 (P=0.009) (Fig. 2).
Blood pressure according to sodium groups stratified by metabolic syndrome components
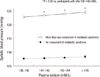
We divided the participants according to the presence of metabolic syndrome components: participants with one or more components (group A, n=69,371) and those without any components (group B, n=27,167). Mean SBP, DBP, and PP were higher in group A than in group B (P<0.001). Positive correlations between sodium and SBP, DBP and PP were noted in group A (P for trend<0.001), and with SBP and PP in group B (P for trend ≤0.007). In group A, SBP in participants in sodium groups 2, 3, and 4 was significantly higher than that of sodium group 1 (P<0.001), and no difference was evident between sodium groups within group B (Fig. 3). Also, DBP in participants in sodium groups 2, 3, and 4 was higher than that of sodium group 1 (P<0.001), and no difference was evident between sodium groups within group B. PP in participants in sodium group 4 was significantly higher than in group 1 in both group A (P<0.001) and group B (P=0.006).
All-cause mortality according to sodium groups
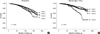
A total of 998 deaths (1.0%) were observed at the 50.8 months median follow-up period. The cumulative incidence of all-cause mortality increased continuously with increasing pNa (Log ranks, P=0.002) (Fig. 4A). Sodium group 1 showed the lowest incidence of all-cause mortality at 53.9 months median follow-up, and sodium group 4 showed the highest incidence at 51.6 months median follow-up. In women aged ≥50 yr, the cumulative incidence of all-cause mortality also increased with increasing pNa (Log ranks, P<0.001) (Fig. 4B). However, men aged ≥50 yr and both men and women aged <50 yr did not show significant differences in all-cause mortality according to sodium groups.
Because women aged ≥50 yr showed a significant association between sodium groups and all-cause mortality, we analyzed multivariate regression for all-cause mortality in women. Unadjusted HRs for all-cause mortality according to sodium groups were significant, at 1.366 (95% CI, 1.000-1.867), 1.618 (95% CI, 1.160-2.258), and 2.946 (95% CI, 2.005-4.329) in sodium groups 2, 3, and 4, respectively. After adjusting for age and SBP, HRs also increased with increasing pNa: 1.181 (95% CI, 0.863-1.615), 1.224 (95% CI, 0.875-1.712), and 2.009 (95% CI, 1.362-2.965) in sodium groups 2, 3, and 4, respectively. A multivariate adjusted model showed a similar trend: 1.135 (95% CI, 0.828-1.555), 1.164 (95% CI, 0.827-1.637), and 1.852 (95% CI, 1.245-2.754) in sodium groups 2, 3, and 4, respectively (Table 2).
DISCUSSION
In the present study, we determined the associations between increasing pNa, and BP and mortality. SBP and DBP were positively correlated with pNa in participants with pNa ≥138 mM/L. The positive correlation between pNa and BP was stronger in older subjects, women, and subjects with metabolic syndrome components. The cumulative incidence of mortality increased with increasing pNa in women aged ≥50 yr by sub-group analysis. Thus, pNa is an independent risk factor for all-cause mortality in women.
Endothelial cells are in physical contact with pNa and express epithelial sodium channels in response to aldosterone (18). Aldosterone leads to endothelial cell swelling via the uptake of sodium and water. Despite the already increased stiffness in aldosterone-treated cells, increase in the sodium concentration from 135 to 145 mM/L resulted in a further marked increase in stiffness in the aldosterone-treated endothelial cells (18). Generation of nitric oxide, a crucial vasodilator produced by endothelial cells, is reduced when the sodium concentration is increased from 135 to 150 mM/L (18, 19). In a human study, modest sodium restriction improved arterial stiffness measured by pulse wave velocity (3). An increase in pNa may affect endothelial function, vascular tone, and BP.
Older individuals exhibited significant differences in BP according to pNa in both men and women. The sensitivity of the renin-angiotensin-aldosterone system (RAAS) to the sympathoadrenal effect increased with increasing age, despite decreased plasma renin and aldosterone baselines (20). Changes in pNa are directly related to the RAAS response (21). Furthermore, in women older than 50 yr, pNa was strongly associated with BP, and young women exhibited no significant associations, unlike young men. Similar findings were evident with regard to all-cause mortality. Estrogen has a protective effect against increased BP, and the depletion of estrogen clearly increased the effects of salt on BP in hypertensive female rats (21). Ovariectomy increased the urinary excretion of aldosterone and angiotensinogen in animals on both normal salt and high salt diets (21, 22). The strong association between pNa and BP in older women could be explained by the depletion of estrogen.
Insulin resistance may lead to sodium retention and extracellular fluid volume expansion, thereby increasing the effects of salt intake on BP (23). It has been reported that metabolic syndrome enhanced the salt sensitivity in non-diabetic participants (24). We also confirmed a stronger influence of pNa on BP in participants with metabolic syndrome components. These greater increases in BP in response to pNa in older subjects, women, and subjects with metabolic syndrome components are in agreement with previous studies revealing an association between dietary salt intake and BP (24-26).
This study has several strengths. The characteristics of the study population differed from those of previous studies in that the participants were ethnically homogenous Asians who traditionally consumed high dietary salt. While the recommended dietary salt intake is less than 5.8 g per day for adults, the average salt intake in Korea was 14.3 g per day in 2005 (27), compared to 10.4 g in American men during 2005 through 2006 (28). In addition, the study was conducted in a healthy population. Disturbances in pNa concentration were observed in medical conditions such as heart failure, dehydration, volume depletion and malignancy (11-14). Our participants had a voluntary routine health check-up that enabled the exclusion of those with a debilitating condition. In addition, we excluded participants who were taking anti-hypertensive medication, had an eGFR <60 mL/min/1.73 m2, and were diabetics. Renal tubular dysfunction, diuretic usage, and RAAS blockade all lead to the modification of sodium absorption in the kidney. Severe endothelial dysfunction and arterial stiffness were noted in diabetic patients (29, 30). The difference in the prevalence of diabetics in each sodium group may have affected our analysis of the effect of pNa on BP. Second, the association between mortality and pNa in the normal range had not been previously evaluated. We detected differences in all-cause mortality influenced by a small increase in pNa in women aged ≥50 yr.
This study also has some limitations. The cross sectional study design prevented an evaluation of the causal relationship between BP and pNa. Second, dietary salt intake was not evaluated; thus, we could not determine whether the increase in pNa was correlated with dietary salt intake. Third, the types of anti-hypertensive medications were not identified. Therefore, we excluded all participants who were taking any anti-hypertensive medication. Finally, the follow-up period was relatively short. The median 4.2 yr of follow up was insufficient to reveal differences in all-cause mortality according to pNa in men and women aged <50 yr. There was no significant difference in men aged ≥50 yr despite a significant association between BP and pNa. Further long-term studies are needed.
We determined the effect of increases in pNa within the normal range on BP and mortality. The observed positive correlation between pNa and BP is stronger in older subjects, women, and subjects with metabolic syndrome components. Despite the short follow-up period, the incidence and adjusted risks of mortality increase with increasing pNa in women aged ≥50 yr.

 XML Download