This article has been
cited by other articles in ScienceCentral.
Abstract
This paper introduces statistics related to the size and composition of Korea's total health expenditure. The figures produced were tailored to the OECD's system of health accounts. Korea's total health expenditure in 2009 was estimated at 73.7 trillion won (US$ 57.7 billion). The annual per capita health expenditure was equivalent to US$ PPP 1,879. Korea's total health expenditure as a share of gross domestic product was 6.9% in 2009, far below the OECD average of 9.5%. Korea's public financing share of total health expenditure increased rapidly from less than 50% before 2000 to 58.2% in 2009. However, despite this growth, Korea's share remained the fourth lowest among OECD countries that had an average public share of 71.5%. Inpatient, outpatient, and pharmaceutical care accounted for 32.1%, 33.0%, and 23.7% of current health expenditure in 2009, respectively. A total of 41.1% of current health expenditure went to hospitals, 28.1% to providers of ambulatory healthcare (15.9% on doctor's clinics), and 17.9% to pharmacies. More investment in the translation of national health account data into policy-relevant information is suggested for future progress.
Keywords: Total Health Expenditure, Current Health Expenditure, Public Health Expenditure, System of Health Accounts (SHA), National Health Accounts (NHA)
INTRODUCTION
In 2000, the Organisation for Economic Co-operation and Development (OECD) published a manual entitled 'A System of Health Accounts' that set guidelines for the construction of health accounts (
1). Health accounts are a systematic description of financial flows related to healthcare and describe a health system from an expenditure perspective. No specific healthcare accounting program was in place before the system of health accounts (SHA) manual was introduced and implemented in Korea. Several Korean researchers developed independent estimates of the total health expenditure in Korea (
2-
8). However, there was no point in comparing them with OECD estimates for other countries because they included different health expenditure items. In 2003, a project involving the construction of Korean national health accounts (NHA) was undertaken under the initiative of the Ministry of Health and Welfare in compliance with guidelines set forth in the OECD's SHA (
9).
Differences in data on which the estimates are based and in the methodology used resulted in significant changes in the value and structure of total health expenditure between the pre-SHA estimates and the SHA estimates. New estimates have made it possible to better compare the total health expenditure of Korea with that of other OECD countries. Since the first successful NHA tables of three dimensions (function, financing, and provision) were created in 2004, the availability of data sources has continuously been checked and new sources added whenever available. Awareness and appreciation of the need for and gains from the application of SHA to the health expenditure classification have steadily increased, with OECD health expenditure figures more frequently quoted by health policy makers.
This paper aims to introduce figures related to the size and composition of Korea's total health expenditure produced as a result of the construction of the Korean NHA tailored to the SHA guidelines. Total health expenditure and current health expenditure are separately presented; in addition, health expenditures per capita and as a share of GDP are shown so that they can be compared to those of other OECD countries. An analysis is made of how health services are financed, provided, and function.
MATERIALS AND METHODS
Korea's NHA tables are formulated based on existing statistics after a mapping process set forth in detail in Jeong (
10). Data sources for the public sector include budget and settlement documents from all government levels, and various statistics from the National Health Insurance (NHI), Industrial Accident Compensation Insurance, and others, as shown in
Table 1. Data on public health expenditures is quite reliable; however, there are limitations on the assessment of the scale and constitution of private health expenditures. Appropriate calculations of the size of "out-of-pocket excluding cost-sharing" (as named in the SHA classification), among sub-headings of "household out-of-pocket expenditure," are a key element in the successful construction of the Korean NHA. The cost-sharing portion is derived from the NHI data, where financing, functions, and providers are clearly and specifically indicated, while "out-of-pocket excluding cost-sharing" is calculated by the addition of the NHI data as well as data from surveys such as the household income and expenditure (HIE) survey, Korean healthcare panel study (KoHPS), and survey on NHI out-of-pocket expenditures.
The main task is to estimate "out-of-pocket excluding cost-sharing" by function and by provider with the aid of residual techniques. However, the problem is that the total revenues of providers are not known exactly. An estimation of the composition of such provider expenditures is made from other financing sources, such as the household income and expenditure (HIE) survey.
The HIE survey is conducted monthly in a diary method. The heading of "Health and Medical Outlays" (a major classification category) includes three subheadings or medium classifications: "Health and Medical Services," "Drugs," and "Medical Supplies and Appliances." "Health and Medical Services" includes expenditures on outpatient care, inpatient care, dental care, traditional medicine, postpartum care, and others, while the category of "Drugs" includes prescription drugs, OTC drugs, and herbal medicines, and "Medical Supplies and Appliances" consists of consumables for health and medical uses, eyeglasses, contact lenses, and others.
In view of the finding that the number of household members noticeably affects health expenditures per household (
11), health expenditures are totalled by heading and by the number of household members and then multiplied by the number of households by the number of household members. The surveys in which data by number of household members are published include:
"Urban household survey of urban and non-farming households with 2 persons or more" (Part A in Fig. 1) publishes the average monthly health expenditures from 1982 onward by number of household members, by quarter, and by medium classification.
"Household survey of all non-farming households with 2 persons or more" (A + Ⓐ in Fig. 1) publishes average monthly health expenditures from 2003 onward by number of household members, by quarter, and by medium classification.
"Household survey of all non-farming households" (A+ Ⓐ + C + Ⓒ in Fig. 1) publishes the average monthly health expenditures from 2006 onward by number of household members, by quarter, and by medium classification.
The size of "out-of-pocket expenditures excluding cost-sharing" is obtained by subtracting the "cost-sharing" figure (obtained from administrative statistics such as those of the NHI and medical aid program) from the entire household out-of-pocket expenditures by heading, obtained by adding up expenditures estimated by number of household members on the basis of the HIE Survey data.
A "mixed approach" is adopted, combining a "bottom-up approach," in which all sub-headings under a particular major classification heading together constitute the amount of that major classification heading, and a "top-down method," in which the amounts of major classification headings are determined and then distributed into medium classification and again into detailed classification headings. Here is the estimation procedure:
Average monthly amounts by medium classification by number of household members are estimated utilizing various time series data published in the HIE survey. For 2006-2009, since the average monthly amounts per annum by medium classification by number of household members are officially published, those data are utilized as they are (A + Ⓐ + C + Ⓒ in Fig. 1).
-
The information on "farming households" is not included in the previous data. Average monthly health expenditures of "entire households" that include "farming households" by medium classification heading are obtained by the following formula:
when T = 2006, 2007, 2008 and 2009
when T = 2005 and before
The numbers of households as shown in the population and housing census for 1990, 1995, 2000, and 2005 are referred to, and, for the years in between, the number of households is estimated by interpolation.
A combination of the two preceding sets of data makes it possible to estimate the size of the average monthly health expenditures that households by number of household members (1-member household, 2-member household, 3-member household, etc.) of the entire category of households (urban and non-farming households) hold for each of the medium classification headings.
Annual aggregates of private household out-of-pocket expenditures by number of household members are estimated by multiplying the preceding monthly expenditures by 12 months since the private household out-of-pocket expenditures by detailed heading is expressed in an annual average of monthly expenditures per household on the Korean Statistical Information System (KOSIS) portal (http://www.kosis.kr/).
Expenditures by both medium and detailed classification headings obtained in the foregoing manner are redistributed and tailored to the SHA classification.
RESULTS
Total and current health expenditures
Total health expenditure (THE) measures the final consumption of health goods and services (current health expenditure or CHE) plus capital investment in healthcare infrastructure. It has been argued that the two aggregates cannot be directly summed up as they refer to different periods of consumption where capital formation enables future provisions (
12). Korea's THE in 2009 was estimated at 73.7 trillion won, equivalent to US$ 57.7 billion (
Table 2). Of this, 94.9% was CHE and the remaining 5.1% was expenditures for capital formation by healthcare provider institutions.
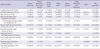
THE in 2009 was 11.2% higher than in 2008 due to an 8.2% increase in real health expenditures and the general inflation rate (consumer price index) of 2.8% during the year. THE has increased annually even though the rate of increase has been on a steady decline with annual averages of 19.3% in the 1980s, 14.1% in the 1990s, and 12.2% for the period of 2000-2009 (
Table 2). In Korea, the rate of increase stagnated (2.2%) in 1998 largely due to the 1997 Asian financial crisis. This was followed by a rapid rate of increase (21.9%) in 2001, largely influenced by reforms introduced in the second half of 2000 that mandated the separation of drug prescription and dispensing facilities, coupled with rises in doctor's fees (
13-
15). Subsequent years saw a slight drop in the rate of increase (7.5% in 2002 and 9.2% in 2004) due to a cost-containment policy, followed by sharp rises again after 2005, when public benefit coverage was enhanced. Current increases in annual rates have been in the double digits and have created a controversy over the future sustainability of the Korean healthcare system.
Annual per capita health expenditure was 1.5 million won (US$ 1,879) in purchasing power parity and is estimated to have increased by 11.7%, or 8.3% in real terms, annually over the last decade. Korea's THE as a share of gross domestic product (GDP) was 6.9% in 2009 and is an increase of 0.46 percentage points from 2008 level. The increase of 2.7 percentage points during one decade (from the figure of 4.3% in 1999) indicates a high increase not only in the proportion of overall economic activity contributed by health expenditures but also in the burden of maintaining the Korean health system. The largest annual increase during the decade came in 2001, when the "THE to GDP" ratio grew from 4.5% to 5.1%. That is related to changes in GDP as well as changes in health expenditures. Throughout the 1980s, THE grew at an annual average rate of 19.3% and was supported by average annual GDP increase rates as high as 17.3%. This was still the case in the 1990s, when the annual average of THE stood at 14.1% and the GDP at 13.2%; however, between 2000 and 2009 average economic growth slowed to 6.9% despite the continued rapid average annual increases as high as 12.2% in THE over the same period that resulted in an increase in the "THE to GDP" ratio. This ratio increased after the 2008 global recession and was further entrenched in 2009; that is, overall health spending has been outpacing economic growth.
Financing, functions, and recipients of health expenditures
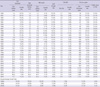
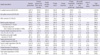
Table 3 shows the NHA cross-table for functional and financing classifications. As a share of THE, public financing accounted for 58.2% (government 13.5% and social security 44.7%) and private financing for the remainder (private insurance 5.2%, household out-of-pocket 32.4%, and others 4.2%). For CHE, the public share reached 59.5%, and the private share stood at 40.5%. The social security fund (most of which comes from the national health insurance program) is the major source of funding for healthcare providers; in addition, direct household payments play a significant role as well. In this situation, patients have to pay high co-payments for their medical bills as well as pay the full cost of services that are not included under national health insurance benefits. Although spending by private insurance has recently increased, its share has remained relatively low.
The public share of THE barely exceeded 20% in the early 1980s (
Table 2); however, in 1984 it was over 30% due to the expansion of insurance beneficiaries and it increased to 35% (or higher) in 1990 when universal coverage of health insurance was implemented. The public share increased to 50% in 1999 with the implementation of the insurance benefit expansion policy in the mid-1990s. The share of public financing also increased rapidly in 2001, when the financial effects of reforms that mandated the separation of drug prescription and dispensing facilities started to manifest themselves, reaching a level of 54.9% (
16). After a slight decline in 2002 to 53.7% and in 2003 to 52.4% due to the cost-containment policy, the share started to rise again gradually 58.2% in 2009.
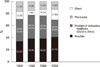
Fig. 2 shows the allocation of CHE across the different types of health services and medical goods (functions). The ratio of inpatient to outpatient spending depends on the institutional arrangements for healthcare provisions. In 2009, Korean inpatient, outpatient, and pharmaceutical care accounted for 32.1%, 33.0%, and 23.7% of CHE, respectively. Inpatient share has increased over the last decade, from 29.4% in 2000, while outpatient and pharmaceutical shares have decreased from 35.1% and 25.7%, respectively. The outpatient share reached a peak in 2001 when fees for consultation were increased under the pharmaceutical reforms (
17). The decrease in the pharmaceutical share of CHE (despite that sector's relatively high increase in the absolute measure) may be partly explained by the more rapid increase of other types of services. The share of CHE allocated to public health and prevention activities, such as vaccination programs, public health campaigns against alcohol abuse, and antismoking initiatives stood at 3.3% in 2009 or around twice its share in the early 2000s. This rapid increase is due to a more active involvement by the centralized Health Promotion Fund in public health and prevention campaigns (
18).
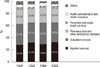
As shown in
Fig. 3, 41.1% of CHE went to hospitals in 2009, 28.1% to providers of ambulatory healthcare (15.9% to doctors' clinics), and 17.9% to pharmacies. However, this situation was different before the mid-2000 pharmaceutical reform when the prescription and dispensing roles of doctors and pharmacists were not separated. In 1999, (for example) the pharmaceutical share of CHE was as low as 7.0% while the share going to doctors' clinics was 23.3%. The hospitals' share has also increased over the last decade from 38.3% in 2000 to 41.1% in 2009.
DISCUSSION
Differences in health spending levels per capita reflect an array of market and social factors, as well as diverse financing and organizational structures of the health systems of the concerned countries (
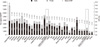
19). Korea shows a relatively low (but rapidly growing) level of health expenditures compared to other OECD countries. As shown in
Fig. 4, Korean health expenditure per capita (US$ PPP 1,879) in 2009 was 58.3% of the unweighted OECD average (US$ PPP 3,223). The purchasing power parities (PPPs) for the whole of GDP are used for the conversion of the expenditures from different national currency units into US dollars. Korea also belongs to a group of countries that spend far below the OECD average in terms of the "THE to GDP" ratio (6.9% vs 9.5%). Such trends in this ratio can be ascribed to the combined effect of trends in both GDP and health expenditures. For example, the gap between the Korean level and the OECD average was considerably wider in health expenditures (difference of 42% in per capita THE) than in economic development (difference of 20% in per capita GDP).
Over the past decade, the increase in THE in Korea (12.2%) has been higher than the OECD average (8.3%). This can be partly explained by the fact that the countries that have experienced the highest increase in health expenditures per capita over the last decade are those that ranked relatively low at the beginning of the period (
19).
Fig. 4 shows that Korea's public financing share of THE (58.2%) among OECD countries in 2009, remains the fourth lowest, after Chile, the United States, and Mexico that have an average public share of around 71.5% and is unchanged from 1990. There has been a convergence in the levels of the public share of health spending among OECD countries over recent decades (
19). Korea, like many countries with a relatively low public share in the early 1990s, has increased its public share and reflects health system reforms as well as the ongoing expansion of public coverage.
According to Orosz and Morgan (
20), the public sector plays a dominant role among OECD countries in paying for inpatient services even though private financing plays an increasingly important role in the area of outpatient services (particularly dental care). The public purse covers significantly less of the total pharmaceutical expenditures than of expenditures on physician and hospital services and reflects higher co-payments for pharmaceuticals under public insurance schemes in some other countries. In this sense, Korea has an unusual public-private financing mix of health expenditures by mode of production. Korea's public share in both inpatient and outpatient care is significantly lower than the OECD average; however, the public share in pharmaceutical expenditures in Korea is as high as the OECD average and higher than in the United States and Canada where the public share is less than 40%.
Until the early 2000s, Korea spent a relatively large share of its health expenditures on outpatient care (35.1% of CHE in 2000) and a correspondingly lower share on inpatient care (29.4%) compared to most OECD countries (
Fig. 2). With the former decreasing and the latter increasing since then, the distribution of CHE between outpatient and inpatient care has neared the OECD average (24.9% and 36.6%, respectively) (
Table 4).
Variations in pharmaceutical spending are observed in OECD countries and reflect the differences in volume, structure of consumption, and pharmaceutical pricing policies. In 2009, Korea's per capita expenditure on pharmaceutical products was US$ PPP 423, lower than the OECD average of US$ PPP 488 (
Table 4). According to the OECD (
21), the major pharmaceutical spenders were the United States (US$ PPP 956), followed by Canada (US$ PPP 744) and Greece (US$ PPP 677); however, Mexico (US$ PPP 249) and New Zealand (US$ PPP 276) had the lowest per capita expenditures on pharmaceuticals. As a share of GDP, Korea's pharmaceutical spending was almost the same as the OECD average of 1.6%. Pharmaceutical spending as a share of GDP among OECD countries ranged from a group that includes Luxembourg, Norway, Denmark and New Zealand (with an average of less than 1%) to a group that includes Portugal, the United States, Greece, the Slovak Republic and Hungary (with an average of more than 2%).
In conclusion, the figures relating to the size and composition of Korea's Total Health Expenditure are introduced and analyzed in this paper. Korea shows a relatively low level of health expenditures compared to other OECD countries; however, increases in annual rates have been in the double digits and have created a controversy over the future sustainability of the Korean healthcare system. The Korean public financing share of health expenditures remains among the lowest for OECD countries while Korean household out-of-pocket payments are high.
Sound evidence provided by national health accounts is essential for the equitable and efficient allocation of limited health resources in Korea. Linking this evidence with non-monetary information (such as output and outcome indicators) can provide the basis for powerful tools to monitor the performance of the Korean health system. Among them would be Korea's health outcome compared to other countries with similar incomes and health expenditure levels. The next step forward will be to translate produced data into policy-relevant information that channel resources into priority areas.


 PDF
PDF ePub
ePub Citation
 Print
Print


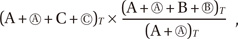 when T = 2006, 2007, 2008 and 2009
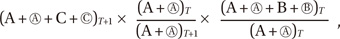 when T = 2005 and before
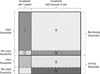
 XML Download