

 PDF
PDF ePub
ePub Citation
 Print
Print


INTRODUCTION
Bone densitometry measurements are conducted for many reasons, such as evaluations of fracture risk in old age. The World Health Organization (WHO) introduced three diagnostic categories (normal, osteopenic and osteoporotic bone) for the interpretation of bone mineral density (BMD) (1). BMD measurements by dual energy radiography absorptiometry (DEXA) are used for the diagnosis of osteoporosis. Bone densities are usually measured at the lumbar spine (L1-4) and hip joints to grade the severity of osteoporosis by the lowest T-score. Unilateral measurements of proximal femoral BMD are typically performed to minimize time, medical costs and radiation exposure that is associated with radiography (2). Minimal differences of bilateral proximal femoral BMD are assumed (2-5). However, some authors have observed BMD variation in opposing femora by DEXA measurements (6, 7). Furthermore, unilateral hip disorders, such as arthritis, hemiplegia, Paget's disease, and fractures with or without implants, may affect BMD; it remains unclear whether symmetry of BMD in the proximal femur can be assumed (8-10). Therefore, controversies exist regarding the use of bilateral hip scanning. As the diagnostic classification of osteoporosis is based solely on the lowest T-score at the spine and hip in most cases, interpretations could be affected by significant differences in hip BMDs between the left and right hips. The purpose of this study was to ascertain differences in BMD and the lowest T-score measurements of both hips in Korean women for the evaluation of osteoporosis using DEXA.
MATERIALS AND METHODS
Participants and methods
This study was a retrospective cohort study. BMD data were collected from the Anam Hospital database. Postmenopausal women over 50 yr of age were eligible for the study if the following criteria were met: 1) measurements performed between 1 January 2007 and 31 December 2010 and 2) anatomical structures that were suitable for DEXA scanning. Exclusion criteria included diseases affecting calcium homeostasis (i.e., hyperparathyroidism or hypoparathyroidism, hyperthyroidism or hypothyroidism, hypocalcemia, rheumatoid arthritis, Paget's disease, osteomalacia, and serum creatinine levels greater than 1.7 mg/dL) and cancer.
Measurement of bone mineral density
The BMDs of both femoral necks, intertrochanteric areas and total BMD were measured on the same day using a Hologic Discovery W dual-energy x-ray absorptiometry (Hologic, Inc., Bedford, MA, USA). Adult whole body software (QDR V. 12.1) was used for data acquisition and analysis. Bone mineral densities were expressed as grams per square centimeter (g/cm2). The results of measurements for the femoral neck, trochanteric area, intertrochanteric area, and total hip were collected. Ward's triangle data were excluded. Bone status was determined by the lowest T-score. Cases were classified as normal, osteopenic bone, osteoporotic bone, or severely osteoporotic bone according to WHO criteria.
Other variables
Additional covariates were obtained from data collected concurrently with BMD measurements and included age, height (cm), weight (kg), and BMI (kg/m2). Using BMI scores, we classified women as low weight (BMI < 20), normal (20 ≤ BMI < 25) and overweight (25 ≤ BMI).
Statistical analysis
Statistical analyses were performed with the Statistical Package for the Social Sciences (SPSS) V.18 software. Results are presented as means ± SDs. The Wilcoxon signed ranks test was used to compare BMD measurements between the right and left hips. Analyses of covariance (ANCOVA) were used to determine the influences of age, height, weight, and BMI on differences between BMD and lowest T-score measurements. For all statistical comparisons, P values < 0.05 were considered significant.
RESULTS
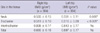
Three hundred eighty four women were enrolled in this study. The mean age was 69.5 ± 9.0 yr, and the mean height, weight and BMI were 151.9 ± 5.6 (cm), 55.04 ± 9.1 (kg), and 23.3 ± 3.5 (kg/m2), respectively. We compared bilateral BMD (g/cm2) at different parts of the femur (Table 1). There were significant discordances of the neck and trochanteric area measurements between the right and left hips according to the Wilcoxon signed ranks test (P < 0.05). Other areas of the hip and the lowest T-scores did not differ significantly.
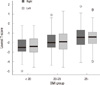
When included as a BMI covariate, ANCOVA indicated that the lowest T-scores differed significantly between the right and left hips (P = 0.018). Other covariates, age, height, and weight did not have a significant influence on T-score in ANCOVA. The values shown in Table 2 represent the means ± SDs and distributions of the lowest T-scores assigned to each BMI group. Fig. 1 is a box-whisker plot based on Table 2 that shows median values, interquartile range, spread, and outlying values for the lowest T-scores in the three groups. As BMI increased, the median T-score value increased.
The distribution according to WHO classification of osteoporosis and concordance rates between the lowest T-scores of both hips are shown in Table 3. The lowest T-scores were concordant between hips in a total of 70.9% of the women. The rest of the women (n = 112, 29.1%) would have been at risk of misdiagnosis provisionally if only unilateral BMD measurements had been taken. Among these patients, 62 (16.3%) would have been classified as having normal or only osteopenic bone mineral density if we had merely scanned them unilaterally. These groups are important because they would have not received treatment for osteoporosis based upon just one score according to the WHO criteria. Fifteen patients (3.9%) who were diagnosed as having normal bone density actually had osteopenia; and 35 (9.1%) severely osteoporotic patients were underdiagnosed as simply having osteoporosis.
DISCUSSION
In our study, a significant bilateral difference in hip BMD (g/cm2) was identified at the neck and trochanter areas. We also confirmed that BMI could influence the difference between bilateral hip BMD measurements; as BMI increased, the median T-score also tended to increase. To put the issue into a clinical perspective, we usually use the lowest T-scores to determine patients' bone health according to the WHO classification. In our study, the lowest T-scores were discordant between hips in 30% of participants and about 17% would have missed the chance to be treated for osteoporosis due to underestimation. Patients could be classified differently if only one normal or osteopenic hip is scanned but the osteoporotic or severely osteoporotic contralateral hip is not.
The reasons for the discordance of bilateral hip BMD can include genetic variation, immobilization, pathology such as osteoarthritis, stroke etc. (11, 12). Dominance of extremity can be another reason. Moreover, aerobic and strength training exercise can also make the skeletal system stronger. Krahl et al. (13) reported the professional tennis player could develop a stronger and bigger skeleton and a higher BMD in the dominant stroke arm.
However, a controversy exists regarding the clinical use of bilateral hip scans. Petley et al. (14) reported that only 3.3% patients in whom one side was osteoporotic had other sides and/or spine measurements that were normal or osteoporotic. Many authors agreed with this opinion. They insist that there is only a small benefit in performing bilateral femoral neck BMD measurements (15, 16). In contrast, Lilley et al. (7) revealed that the range of BMD differences between the femora was large; for some individuals, the BMD values differed by up to 35% in the femoral neck, 64% in Ward's triangle and 80% in the trochanter. They recommend routine scanning of both femora (7). We also observed a difference in bilateral BMDs at the femur neck and trochanteric area (P < 0.05).
The authors who were in opposition to bilateral scanning of BMD have mentioned that it is a time-consuming and costly procedure. Clinically, measuring BMD at the hip was made possible with the introduction of dual-photon absorptiometry (DPA) in the early 1980s (17). However, the scan time for a single hip was 20 min or more, so it was not practical to consider bilateral hip scans in clinical practice. This lengthy time is the reason the practice of scanning only one hip remains the standard densitometry procedure in most large centers. With the advent of successive generations of scanning systems (such as DEXA), however, scan times have become much shorter. A single hip scan can be easily completed in a few minutes in automated sequential bilateral hip mode; the second hip adds only 60 sec, and both hips can be scanned in five minutes unless patient positioning needs to be adjusted. Therefore, the ability to perform bilateral hip scans is no longer constrained by time issues. Under the Korea National Health Service, patients pay the same price for routine scanning, which includes the L-spine and one femur, as they pay for scanning of the L-spine and both femurs. Thus, bilateral hip BMD scanning is no longer a time-consuming, or costly procedure.
Clinically, we gained some advantages from bilateral BMD monitoring. Bisphosphonate may induce insufficiency fractures in the subtrochanteric area. Alendronate, an inhibitor of bone resorption, is a drug widely used in osteoporosis treatment. However, concerns have been raised recently about potential over suppression of bone turnover during long-term use. Many patients receiving bisphosphonates for the treatment of osteoporosis have sustained atypical subtrochanteric femoral fractures (and sometimes simultaneous bilateral fractures) following low-energy trauma (18-21). Patients who take osteoporosis medication should have their bone mineral density checked regularly to retain approval of insurance coverage in Korea. In this situation, we can use the films for BMD measured by DEXA as a screening tool for cortical thickening at the subtrochanteric area without additional femur radiographs. As noted above, insufficiency fractures can develop bilaterally. BMD scanning is very beneficial, especially for patients who have taken bisphosphonate medications for years.
Over the past several years, a series of meta-analyses has been performed to identify risk factors for osteoporotic fracture and to determine their dependence upon age, sex and BMD (22-25). A fracture risk assessment tool (FRAX™) was developed based upon the use of clinical risk factors both with or without BMD tests applied. This tool has been widely applied and studied in Korea (26). We can easily calculate a patient's risk automatically by inputting patient data into the tool. The data include the following variables: patient age, sex, height, weight, previous fracture history, parental history of hip fracture, current tobacco smoking, use of oral glucocorticoids, rheumatoid arthritis, other causes of secondary osteoporosis, and daily alcohol consumption. The tool has used the femoral neck site measured with DEXA as the reference standard for diagnosis of osteoporosis based upon a T-score of - 2.5 SD or lower using a standardized reference population and femoral neck BMD. FRAX algorithms give the ten-year probability of hip fracture and the ten-year probability of a major osteoporotic fracture, including fractures of the spine, forearm, hip, or shoulder. Having data for the femoral neck BMD is essential when using the algorithm. Differences in neck BMD between the right and left sides could influence the results. For example, in our cohort, a 72-yr-old female patient (156 cm, 62 kg) had a 0.603 g/cm2 right femur neck BMD and a 0.512 g/cm2. The calculated results were a 2.7% ten-year probability of hip fracture and an 8.3% ten-year probability of a major osteoporotic fracture based upon the right side BMD. Using the BMD of the left side, we found that a patient had a 5.8% ten-year probability of hip fracture and a 13% ten-year probability of a major osteoporotic fracture. These results would mean that we could have obtained inaccurate data from FRAX if her BMD scanning had been done unilaterally. We can go even further and derive a comparison of FRAX probabilities where the BMD input is based upon the lumbar spine T-score, minimum T-score (lumbar spine or bilateral femoral neck) and weighted mean T-score (lumbar spine or femoral neck or trochanter area). This method will help narrow the proper choice of BMD input to the FRAX model and therefore improve estimates of risk classification.
There were a few of limitation of our study. First, it looked at only one measurement. Follow up measurement would be necessary and could make up for a defect. Second, we limited range of investigation because most of BMD were taken in postmenopausal women to evaluate osteoporosis. Further evaluation including bilateral BMD check in all age group and sex should be performed to reflect precision.
Finally, as mentioned above, BMD discordance on upper extremity according to side dominance is very interesting. That dominance on lower extremity may have a same influence. Unfortunately, however in this study, side dominance of lower extremity was not included. The study about effect of side dominance at proximal femur BMD will be necessary and may provide a more accurate and interesting result.
In conclusion, we confirmed significant differences between hip BMD measurements at the femoral neck and trochanteric areas in a sample of postmenopausal women. We also observed discordance between the right and left hips in the lowest T-scores, which was more likely to occur with increasing BMI, and detected many cases of potential underestimation of osteoporosis if only one hip measurement had been performed. These results suggest that treatment opportunities will be missed if only one hip is routinely scanned when evaluating postmenopausal women for osteoporosis. Additionally, we can use bilateral hip BMD data in other clinical areas as well. Therefore, bilateral hip measurements using DEXA are recommended to avoid underestimating the BMD status of postmenopausal women and to extend the application of BMD.


 XML Download