

 PDF
PDF ePub
ePub Citation
 Print
Print


INTRODUCTION
Traditional risk factors for cardiovascular disease (CVD), such as diabetes mellitus, dyslipidemia, hypertension, smoking and low physical activity have been used to assess the risk of CVD (1, 2). However, these characteristics do not fully explain cardiovascular risk. Therefore, there has been a focus on newly identified risk factors such as increased plasma homocysteine (Hcy), Creactive protein (CRP), B-type natriuretic peptide level, and metabolic syndrome (MetS) (3, 4).
Although the mechanism that explains the relationship between elevated plasma Hcy levels and CVD is unclear, Hcy is a strong and independent risk factor for CVD, particularly coronary heart disease, stroke and atherosclerosis (5, 6). Commonly, hyperhomocysteinemia was defined with a Hcy level above 12 µM (7) or 15 µM (8). Some studies quantified the Hcy levels as quartile (6, 9) or quintile (10), and compared above and below 12 µM (7). Subsequently, the contribution of Hcy to the prediction or diagnosis on CVD is still undetermined.
MetS is known as a cluster of cardiovascular risk factors associated with insulin resistance, hypertension, glucose intolerance, hypertriglyceridemia and low levels of HDL, and is the concurrence of multiple metabolic abnormalities in an individual (11). MetS is associated with increased cardiovascular events and death (4), and is a cardiovascular risk factor, but not an independent predictive index along with diabetes, obesity, dyslipidemia, and smoking. Therefore, Wang et al. (3) stated the importance of putative biomarkers to standard risk factors for CVD risk assessment of individuals.
The Skaraborg project found a significant association between Hcy and insulin resistance index including serum insulin and HOMA-IR, and provided a potential link between MetS and hyperhomocysteinemia (12). In previous studies using Korean adults, MetS and its components were shown to have a significant correlation with a high level of Hcy (9, 13). However, the Persian Gulf Healthy Heart Study (14) indicated that no association between MetS using NCEP-ATP III criteria and Hcy. Furthermore, a few studies have shown that Hcy levels were not different based on the presence of MetS using NCEP-ATP III criteria in Korean type 2 diabetes patients (15, 16). There is controversy concerning the usefulness of Hcy based on whether the patient has MetS, but, no comprehensive study was performed on the predictive values of Hcy for CVD in subjects with or without MetS so far.
Therefore, in the present study, we investigated the association of Hcy with CVD and MetS and proposed optimal cut-off points for the prediction of CVD based on MetS.
MATERIALS AND METHODS
Subjects and study design
This was a retrospective case-control study, in which 4,043 individuals without pre-existing CVD between the ages of 40 to 59 yr participated in annual regular health check-ups in 2008. 3,886 of 4,043 individuals were participated health follow-up in 2009 and 2010. A total of 138 CVD patients who were newly diagnosed with CVD in 2009 or 2010 were included in this study and classified as the CVD group. The incidence of CVD cases were defined as fatal and nonfatal myocardial infarction, stroke, angina, heart failure, peripheral vascular event, revascularization (coronary artery bypass surgery or angioplasty with or without stenting) and CVD-related hospital admissions. Age- and the number of MetS components non-CVD group, who were recruited and provided informed consent, consisted of 290. The subjects were assigned in about 2:1 ratio to either the non-CVD group or CVD group. Finally, non-CVD and CVD groups were divided into four subgroups depending on the presence of MetS. In total, 428 men were included in the final analyses: 213 normal subgroup, 77 MetS subgroup, 104 CVD subgroup, and 34 CVD/MetS subgroup.
Measurements
Anthropometry of each subject was conducted by experienced research staff. Height and weight were measured with the subject standing straight wearing light clothing (InBody 720; Biospace, Seoul, Korea). Body mass index (BMI) was calculated as body weight in kilograms divided by height in meters squared (kg/m2). Waist circumference (WC) was obtained at midpoint between the anterior superior iliac crest and lower rib. Blood pressure was recorded in duplicate in a sitting position after 15 min of rest using a sphygmomanometer and the results were averaged.
Blood samples were collected from subjects for all biochemical evaluations after fasting for over 12 hr. Fasting plasma glucose (FPG), total cholesterol (TC), triglyceride (TG), high density lipoprotein cholesterol (HDL) and low density lipoprotein cholesterol (LDL) were measured using enzymatic methods (Cobas Integra 800; Roche Diagnostics, Mannheim, Germany). Hcy and creatine (CRE) were measured by enzyme-linked immune-sorbent assays (ELISA) using Alisei Quality system (SEAC, Calenzano, Italy).
Typical dietary intake was analyzed using a computerized food frequency questionnaire (FFQ). The FFQ consisted of 7 food groups including 108 food items and was based on the FFQ developed by the Korea Center for Disease Control and Prevention. It was designed to collect information regarding the usual intake of food over the past one year.
The subjects also completed a computerized self-administered questionnaire regarding their health-related variables that included smoking status, alcohol drinking habit and exercise.
We analyzed using the indices of anthropometry and blood sample, and results of FFQ and self-administered questionnaire for 2008.
Definition of MetS
A diagnosis of the MetS was based on modified ATP III definition, in which three of the following five criteria need to be satisfied (17):
WC: a modified cut-off point of 90 cm for Asia-Pacific men, which is consistent with recommendations from WHO Expert Consultation (18)
-
blood pressure: a systolic blood pressure (SBP) ≥ 130
mmHg or a diastolic blood pressure (DBP) ≥ 85 mmHg or on drug treatment for hypertension TG: ≥ 150 mg/dL (1.7 mM) or on drug treatment for elevated TG
HDL: < 40 mg/dL (1.0 mM) or on drug treatment for reduced HDL
FPG: ≥ 100 mg/dL (5.6 mM) or on drug treatment for elevated FPG
Statistical analyses
For determining sample size statistical software package G*Power (version 3.0.10, Franz Faul, Universität Kiel, Germany) was used. A total of 400 subjects were calculated as a sample size for α = 0.05 and 95% power among four groups in a fixed-effects ANCOVA model with a two-sided.
All statistical analysis was performed using SPSS for Windows, version 18.0 (SPSS Inc., Chicago, IL, USA). All values are presented as the mean ± standard deviation or number (%). Differences between the two groups were analyzed by an independent Student's t-test or chi-square test. In addition, markers of CVD among four groups were assessed by ANOVA and analysis of covariance after adjustment for age (ANCOVA). Pearson's correlation and partial correlation were used to examine the association of Hcy and cardiovascular risk factors. Stepwise multiple regression analysis was then used to evaluate the independent associations of these variables in non-MetS and MetS. Sensitivity and specificity of the Hcy criteria to detect CVD were calculated. Based on the receiver operating characteristic (ROC) analysis, the best cut-off point of Hcy was determined from the highest Youden index, which was defined as follows: sensitivity + specificity-1) (19). All reported P values were two-tailed, and the statistical significance was set at P < 0.05.
RESULTS
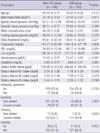
Table 1 shows the general and clinical characteristics of the 428 study subjects (290 CVD and 138 non-CVD). Compared with the non-CVD group, the CVD group had significantly lower value for HDL and dietary intake of vitamin B1 and B2 (HDL, P = 0.001; vitamin B1, P = 0.040; vitamin B1, P = 0.023). Also, Hcy concentration was significantly higher in the CVD group (P < 0.001). There were no significant difference in age, BMI, SBP, DBP, WC, FPG, TC, TG, LDL, MetS, smoking, drinking, and exercise between the two groups (Table 1).
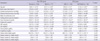
Compared with the control group, the mean age of MetS and CVD/MetS groups were significantly higher (P < 0.001). BMI, SBP, DBP, WC, TC, and TG were higher in CVD and CVD/MetS subgroups than in the control and MetS subgroup (P < 0.001). In the CVD/MetS subgroup, HDL was significantly lower (P < 0.001) and FPG and Hcy were significantly higher than the normal subgroup (P < 0.001). In addition, LDL was the highest in the CVD/MetS subgroup (Table 2). However, the dietary intakes of B vitamins (folate, B1, B2 and B6) were similar across the subgroups.
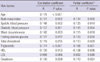
Correlations were analyzed between Hcy and cardiovascular risk factors (Table 3). Hcy demonstrated a statistically significant positive correlation with age (r = 0.175, P < 0.001), BMI (r = 0.151, P = 0.002), SBP (r = 0.148, P = 0.002), DBP (r = 0.157, P = 0.001), WC (r = 0.142, P = 0.003), FPG (r = 0.121, P = 0.012), TC (r = 0.118, P = 0.015), TG (r = 0.174, P < 0.001) and CRE (r = 0.100, P = 0.039) and negative correlation with HDL (r = -0.120, P = 0.013). Adjustment for age did not alter the results (Table 3).
In Table 4, stepwise linear regression analysis using Hcy showed a significant positive coefficient for CVD both in non-MetS subjects (β = 0.041, P < 0.001) and MetS subjects (β = 0.027, P = 0.034). Adjustment for age did not alter the results (Table 4).
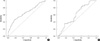
Fig. 1 shows the ROC curve for Hcy value prediction CVD based on the presence of MetS. In non-MetS subjects, the area under the curve (AUC) was 0.664 (95% confidence interval [CI], 0.598-0.731) and Hcy of 11.72 µM was the cut-off point, with a sensitivity of 61.5% and a specificity of 62.4% (P < 0.001). Also, Hcy cut-off point to predict CVD in MetS subjects was 13.32 µM with the best combination of sensitivity (70.6%) and specificity (50.6%) yielding the highest Youden index and 0.618 AUC (95% CI, 0.509-0.726; P = 0.049).
DISCUSSION
We investigated the usefulness of Hcy for predicting cardiovascular disease in subjects with and without MetS. The cut-off points of Hcy, which are 11.72 µM for non-MetS subjects and 13.32 µM for MetS subjects, are optimal for yielding the maximal sensitivity plus specificity for predicting CVD.
Hcy is known as an independent predictive biomarker for CVD (20), causing an increase in oxygen stress and a decrease in endothelial function and thus, enhancing thrombotic events (5). Hcy levels changed depending on sex, age, smoking and intake of coffee, alcohol and folate (9, 21-24). Boushey et al. (20) reported that an increase in Hcy for 5 µM/L is associated with an odds ratio (OR) for coronary artery disease (CAD) of 1.6 for men. Also, several studies demonstrated a relationship between Hcy and risk of obesity, diabetes, dyslipidemia, hypertension and MetS (25-27), although Veerkamp et al. (28) reported that no association was found between plasma Hcy concentration and plasma lipid levels, nor between Hcy and insulin resistance. In particular, the roles of insulin and/or insulin resistance in determining plasma Hcy have been demonstrated (29).
The WC, index of abdominal obesity and one of the components of MetS showed positive correlation with Hcy (7, 30), but no difference of Hcy level between subjects with WC ≥ 90 cm and with WC < 90 cm (13). Similarly, Koehler et al. (31) reported a weak positive relationship between BMI and Hcy concentrations, which was similar to our result. Jacques et al. (24) suggested that persons with BMI ≥ 30.7 kg/m2 had slightly higher plasma Hcy concentrations than those with a BMI < 30.7 kg/m2. The Hodaland Homocysteine Study investigators reported a U-shaped association between BMI and Hcy concentrations that disappeared after adjustment for other determinants of Hcy concentrations (32). Lim et al. (15) suggested that we should use a different index and standard of defining obesity according to ethnicity as well as East and West affiliation, because people with different ethnicities have different characteristics of obesity. We agreed with this opinion, and large-scale prospective studies are needed to establish a suitable index and standard of obesity for Korean.
Like our result, positive association between Hcy and blood pressure was reported in several studies (13, 22, 24, 32). However, Sun et al. (6) found negative correlation and Shin et al. (9) reported no correlation between Hcy and blood pressure.
Hcy and lipid metabolism were interrelated at least in part via methyl group donors (33). Moreover, hyperhomocysteinemia in mice was associated with a decreased activity of hepatic thiolase and serum lecithin-cholesteol acylransferase (LCAT), which are two important enzymes involved in HDL metabolism (34). Real et al. (27) and Obeid and Herrmann (33) showed significant negative correlation between Hcy and HDL, but no correlations with other lipid profiles. In our study, a relationship was found between Hcy levels and the lipid profile (TC, TG and HDL), except for LDL.
B vitamins (vitamin B1, B2, B6, B12, and folate) are involved in homocysteine metabolism (35). In addition, numerous observational studies suggested that B vitamins may provide a protective effect due to the Hcy-lowering effect (36). Chang et al. (37) showed that the dietary intake of folate, thiamin (vitamin B1), riboflavin (vitamin B2) and vitamin C were inversely associated with the risk of hyperhomocysteinemia in diabetic patients. In this study, the intakes of vitamin B1 and B2 were significantly low in CVD subjects, although there was no significant relation between Hcy and B vitamins (data not shown). Therefore, the deficiency of vitamin B2 could cause a secondary deficiency in folate (38), leading to an increase of plasma Hcy. Although plasma folic acid and vitamim B12 were not measured in this study, none of the patients had a history or laboratory evidence of anemia attributable to low plasma folate and vitamim B12.
There are just 3 published studies of CVD outcomes related to Hcy levels in men (mean age about 50 yr) (28, 39, 40). The mean Hcy level among controls in the different studies varied from 9.9 µM to 10.9 µM. In this study, Hcy levels of 10.89 µM were similar to other results in the control group, but the non-CVD group had higher Hcy levels of 11.45 µM. This may be because the non-CVD group included subjects with MetS. Previous observations and our study indicated that individuals with MetS a had higher Hcy level than control subjects (9, 13). Ntaios et al. (25) found that several drugs used in MetS patients influence Hcy levels. Therefore, to determine the optimal cut-off point of Hcy for CVD, we must consider the presence of MetS or the medication usage for the subjects.
A variety of large-scale prospective cohorts have specified only 1 vascular disease: stroke (10) or coronary heart disease (8). Moreover, there was no agreement on the cut-off point for the diagnosis of hyperhomocysteinemia, and there are few studies that suggested optimal cut-off point by Youden's index. We determined that 11.72 µM in non-MetS and 13.32 µM in MetS may be the optimal cut-off point for CVD. These values that were higher than 9.47 µM were the most appropriate cut-off point value of Hcy for cardiovascular events by Sun et al. (6). Despite Hcy being influenced by sex, Sun et al. (6) have not suggested a cut-off point of Hcy for CVD according to sex.
This study had a limitation because of the challenges with interpreting data in a case-control study to determine the optimal cut-off point. Although the discriminatory poser of our study was sufficient, the non-CVD group was selected by a matching method.
The strength of this study was that it was a large-scale study conducted in a comparatively short period. It is difficult to conduct an epidemiological study on CVD. Because the incremental costs of diagnosis for CVD, such as computed tomography (CT), treadmill test (TMT) and coronary arteriography (CAG), were huge. Also, diagnosis of CVD could take long to gather sufficient CVD cases. Nevertheless, our findings identified important issues for further study and provided possible explanations for important clinical findings on relationships among Hcy, MetS and CVD.
In conclusion, this study shows that the cut-off value of Hcy for predicting the CVD is influenced by presence of MetS. A prospective longitudinal study would be necessary to address these issues as well as to identify factors determining the Hcy level in response to the development of CVD with or without MetS. In addition, the feasibility of incorporating Hcy in clinical screening for primary prevention warrants further research.

 XML Download