

 PDF
PDF ePub
ePub Citation
 Print
Print


INTRODUCTION
The prevalence of type 2 diabetes and obesity have increased rapidly and both entities have become a major global health problem. In Asia, type 2 diabetes has developed in a much shorter time and in a younger age group compared to those of European descent (1). Nutritional transition driven by rapid economic development is one of the major causes of the rapid increase in diabetes and obesity in Asia. Unlike other Asian countries, Korea has maintained many of the aspects of the traditional diet, shaping a unique transition characterized by the lower than expected level of fat intake based on its level of economic development (2).
Obesity is a major risk factor of type 2 diabetes and also complicates the management of type 2 diabetes by increasing insulin resistance and blood glucose concentrations. Obesity is an independent risk factor for dyslipidemia, hypertension and cardiovascular disease and thus, increases the risk of cardiovascular complications and cardiovascular mortality in patients with type 2 diabetes (3). For obese type 2 diabetic patients, weight management is an important task with a goal of achieving and maintaining a desirable weight (4).
Medical nutrition therapy is the cornerstone to diabetes management. Calorie intake, dietary fiber, fat, carbohydrate and protein intake have been reported to be associated with obesity in previous studies, but there are still controversies and the associations seem to differ in different populations (4-9). Increased carbohydrate and protein consumption were associated with a lower risk of obesity in healthy elderly subjects (5) whereas, higher carbohydrate but not protein intake was associated with lower body mass index (BMI) in European type 1 diabetic patients (6). Low fiber intake also has been associated with obesity in non-diabetic subjects in previous studies (8, 9). Although there are many studies regarding food and nutritional intake and its effect on obesity and the risk of diabetes in non diabetic subjects, little has been reported regarding the status and role of usual dietary nutrient intake in individuals who already have been diagnosed with type 2 diabetes, especially in Asians who consume white rice as the staple (10, 11). Therefore, we set out to evaluate the association between usual dietary intakes of macronutrients and fiber, and obesity in Korean type 2 diabetic patients in the Korean National Diabetes Program (KNDP) to understand the association between usual dietary nutrient intake and obesity in this population. The KNDP is a prospective, observational, multicenter study conducted to understand the characteristics of Korean type 2 diabetes, including lifestyle factors leading to diabetic complications (12). In this investigation we report the baseline nutrient intake of the KNDP participants, compare the macronutrient intake in obese and non obese type 2 diabetic patients and evaluate which dietary nutrient intake is associated with obesity in Korean type 2 diabetic patients.
MATERIALS AND METHODS
Study population
Subjects were participants in the KNDP cohort, a prospective, observational, multicenter study of type 2 diabetic patients and prediabetic subjects which has been conducted from March 2005 to understand the characteristics of Korean type 2 diabetic patients. The details of the KNDP cohort has been described previously (12). Subjects were eligible to participate in the study if the patient was diagnosed with type 2 diabetes according to the American Diabetes Association criteria (13) and/or was being treated with oral hypoglycemic agents or insulin for known type 2 diabetes. A total of 4,324 type 2 diabetic patients were enrolled from 12 academic medical centers of Korea during the period from May, 2006 to July, 2009. Of these subjects, 2,983 patients completed the baseline dietary survey and clinical evaluation. After further excluding patients with HbA1c greater than 12%, those with a concurrent acute illness, taking anti-obesity medication, and those with reported caloric intake outside 1% of the distribution, 2,832 type 2 diabetic patients aged 20 yr or older were included for the present baseline cross sectional analysis.
Dietary data and lifestyle variables
Patients were interviewed according to a standardized questionnaire by trained research personnel for relevant past medical history and lifestyle factors. For dietary intake, patients were interviewed in person by trained registered dieticians using a 24 hr dietary recall questionnaire. Food models and photographs were used to estimate portion sizes. Dietary data were considered usable if they were not missing and the participant reported that the food intake on the day of the assessment was close to their usual quantity and pattern of food intake. The reported diet intake was analyzed by the Computer Aided Nutrient Analysis program version 3.0 (CAN-Pro 3.0, The Korean Nutrition Society, Seoul, Korea) which converted the food-consumption records to nutrient intake. The variables selected for this study were intakes of total calories, carbohydrate, protein, animal protein, total fat, cholesterol, saturated fatty acid, polyunsaturated fatty acid, and total dietary fiber. Dietary nutrient intake recommendation was adapted from the 2011 Treatment Guideline for Diabetes of the Korean Diabetes Association (14) and nutrient intake was compared with the recommended intake.
Leisure time physical activity was evaluated by a questionnaire that was modified from the Minnesota Leisure Time Physical Activity Questionnaire (MLTPAQ) (15, 16). The questionnaire covered the type of activity, months of the year the activity was done, frequency (times per week) and duration (in minutes). A metabolic equivalents (MET) value was assigned to each sports activity based on the compendium of physical activities (17). The total energy expenditure was calculated into kcal/day as previously described (16). Smoking habit was classified into two categories: current smoker or not. Education level was classified into three categories (less than high school, high school graduation and college graduation). Income was classified into 3 categories (monthly income of ≤ 1,700 US$ (2 million Korean won [KRW]), 1,701 to 3,400 US$ (more than 2 million to 4 million KRW), and ≥ 3,401 US$ (> 4 million KRW). Alcohol intake was categorized into 2 categories as current regular drinking or not; and amount of alcohol intake was analyzed as number of standard drinks per day. One standard drink was defined as 13.7 g of alcohol.
Anthropometric and laboratory measurements
All anthropometric measurements were standardized for all participating centers and made with participants wearing light clothing without shoes. The height and weight were measured to the nearest 0.1 cm and 0.1 kg. BMI was calculated as weight (kg) divided by the square of height (m). Obesity was defined as BMI ≥ 25 kg/m2 (18). Waist circumference was measured at the midpoint between the lower borders of the rib cage and the iliac crest. Blood pressure was measured after the subject has been in rest for at least 5 min in a sitting position. Blood samples were collected after an overnight fast of at least 10 hr and stored at -70℃ for subsequent assays. Hemoglobin A1c (HbA1c) values were determined by high-performance liquid chromatography.
Statistical analysis
Data are shown as mean ± standard deviation or median and interquartile range as appropriate. Student's t-test, Mann-Whitney U test and chi-squared test were used as appropriately for comparison between two groups. The mean daily intake of nutrients obtained from a 24 hr dietary recall was used in all statistical analyses and was adjusted for total energy intake through the multivariate nutrient density model (19). Energy-adjusted nutrient intakes were shown as percent of total energy for protein, fat, carbohydrates, saturated fatty acids, polyunsaturated fatty acids and g/1,000 kcal for dietary fiber. Since there were differences in dietary intake between men and women, analysis was done separately. For analysis of the association between nutrient intake and obesity, subjects were divided into quintiles of nutrient intake. Multiple logistic regression was used to estimate the odds ratio (OR) and 95% confidence interval (CI) of being obese for each quintile of nutrient intake after adjustment for age, duration of diabetes, and total calories and other possible confounding factors. Continuous variables using the median value in each quintile were created for trend tests. Multiple logistic regression analysis was further carried out for nutrient intake that was significant in the first analysis. Baseline characteristics of subjects were compared according to quintiles of fiber intake in both men and women and according to quintiles of protein in women using ANOVA, a Kruskal-Wallis test, or a chi-squared test as appropriate. For analysis between fiber intake and obesity, the model 1 was adjusted for age, diabetes duration, diastolic blood pressure, HbA1c, smoking, alcohol intake, monthly household income, education level, physical activity and energy intake. In model 2, we further adjusted for intake of animal protein, fat, carbohydrate, cholesterol, saturated fatty acids, polyunsaturated fatty acids. In model 3, we additionally adjusted for insulin and metformin use. For analysis between protein intake and obesity in women, logistic regression with further adjustment for factors significantly different between quintile groups of protein intake was carried out. All calculations and statistical analyses were performed using the SPSS for Windows software (version 19.0; SPSS, Chicago, IL, USA) and SAS (version 9.1.3; SAS Institute Inc., Cary, NC, USA). P values < 0.05 were considered to be statistically significant.
Ethics statement
The study was performed in accordance with the revised Declaration of Helsinki guidelines. All participants gave written informed consent. Each participating hospital obtained Institutional Review Board approval (IRB 2006-67, Inha University Hospital) (ClinicalTrials.gov: NCT 01212198).
RESULTS
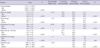
The mean age of the subjects was 54.5 yr, 56% were women, diabetes duration was 6.3 yr, BMI 25.1 kg/m2, and HbA1c 7.5%. Mean energy intake was 1,757.5 kcal/day, protein, carbohydrates, and fat intake were 17.3%, 60.9%, and 21.9% of total energy intake respectively and dietary fiber intake was 15.5 g/1,000 kcal. The dietary intake of men and women and the overall percentage of the participants meeting recommendations are shown in Table 1. Men had a significantly higher intake of energy, protein, fat, saturated fat and cholesterol and a lower intake of carbohydrates and dietary fiber compared to women. Of the total subjects 59%, 69%, and 35% had an intake of protein, fat, and carbohydrate meeting recommendations, respectively. In 54.1%, carbohydrate intake was >60% of total energy intake and fiber intake was lower than the recommended 12 g/1,000 kcal in 25% (30% in men, 18% in women) of the subjects. Most patients met the recommendation of saturated fatty acid intake while cholesterol intake was higher than recommended in 54% of the subjects.
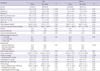
The characteristics of the subjects with and without obesity according to gender are shown in Table 2. In men with type 2 diabetes, obese subjects were younger, had a shorter duration of diabetes and a higher systolic and diastolic blood pressure, total cholesterol level, monthly household income and current alcohol drinking rate compared to non-obese subjects. Dietary fiber intake was significantly lower in obese men compared with non-obese men (14.3±4.6 vs 15.2±4.5 g/1,000 kcal, P < 0.001). In women, obese subjects were older, had a significantly higher systolic and diastolic blood pressure, total cholesterol level and a lower education level compared with non-obese subjects (P < 0.05). In the obese women, protein, animal protein, and saturated fatty acid intakes were lower (16.6±3.7 vs 17.1±3.3%, P = 0.003 for protein, 6.8±3.8 vs 7.2±3.8%, P = 0.03 for animal protein, and 3.2±2.6 vs 3.4±2.4%, P = 0.02 for saturated fatty acid) and carbohydrate intake was higher (63.0±9.2% vs 61.9±9.1%, P = 0.04) compared to the non obese women. In contrast to men, there was no difference in dietary fiber intake between the obese and non obese women (Table 2).
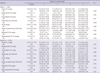
To assess the association between nutrient intake and obesity, the subjects were divided into quintiles according to the intake of each nutrient. Logistic regression of presence of obesity was done on each nutrient after adjustment for age, diabetes duration, HbA1c, alcohol intake, monthly household income, education level and energy intake. Higher intake of dietary fiber was associated with a lower odds of being obese in type 2 diabetic men (adjusted ORs for obesity were 1.00, 0.74 [95% CI 0.52-1.06], 0.64 [0.45-0.92], 0.65 [0.46-0.93], and 0.57 [0.40-0.82] for each quintile, respectively [Ptrend = 0.003]) after adjustment. There was no association between risk of obesity and intake of protein, animal protein, carbohydrate, fat, dietary cholesterol, saturated fatty acids, or polyunsaturated fatty acids in men. In women, higher protein intake was associated with a lower odds of being obese (adjusted ORs for obesity were 1.00, 0.68 [95% CI 0.46-1.01], 0.77 [0.52-1.15], 0.75 [0.51-1.12], and 0.57 [0.38-0.85] for each quintile, respectively [Ptrend = 0.03]. There was no association between obesity and intake of dietary fiber, animal protein, carbohydrate, fat, dietary cholesterol, saturated fatty acids, or polyunsaturated fatty acids in women (Table 3).
To confirm the association between fiber intake and obesity we compared the characteristics of subjects according to fiber intake quintiles for possible confounding factors. Type 2 diabetic men with higher intake of fiber had older age, lower BMI, waist circumference, diastolic blood pressure, alcohol intake, monthly household income, and smoking rate (Ptrend<0.05). Total energy intake, intake of animal protein, fat, dietary cholesterol, saturated fatty acids were lower and intake of carbohydrate and polyunsaturated fatty acids were higher in men with higher fiber intake (Ptrend<0.05). In women, subjects with higher intake of fiber were older, smoked less, had a higher level of leisure time physical activity and a higher intake of alcohol and carbohydrates and a lower intake of animal protein, fat, dietary cholesterol and saturated fatty acids (Ptrend<0.05).
In type 2 diabetic men, after adjustment for age, diabetes duration, diastolic blood pressure, HbA1c, smoking, alcohol intake, monthly income, education level, physical activity, and energy intake, the odds of being obese decreased as dietary fiber intake increased (Table 4, Model 1, adjusted ORs for obesity were 1.00, 0.81 [95% CI 0.54-1.23], 0.62 [0.41-0.94], 0.65 [0.43-0.99], and 0.58 [0.38-0.89] for each quintile respectively, Ptrend = 0.008). This association remained significant after further adjustment for animal protein, fat, carbohydrate, cholesterol, saturated fatty acids, and polyunsaturated fatty acids intake (Model 2, Ptrend<0.001). Additional adjustment for insulin and metformin use (Model 3) did not change the significance of the association (adjusted ORs for obesity were 1.00, 0.74 [95% CI 0.48-1.14], 0.51 [0.33-0.80], 0.50 [0.31-0.80], and 0.37 [0.22-0.63] for each quintile respectively, Ptrend<0.001). On the contrary, there was no significant association between fiber intake and obesity in type 2 diabetic women (Table 4).
Since protein intake was associated with a lower risk of obesity in women (Table 3), clinical characteristics were compared in women according to quintiles of protein intake. Higher protein intake was associated with a higher income, higher intake of animal protein, fat, dietary cholesterol, saturated fatty acids, and polyunsaturated fatty acids and a lower intake of carbohydrates (Ptrend<0.05). After additional adjustment for intake of animal protein, carbohydrates, fat, dietary cholesterol, saturated fatty acids, and polyunsaturated fatty acids, the association between protein intake and obesity was not significant (Ptrend = 0.13).
DISCUSSION
The present study evaluated the usual dietary nutrient intake in Korean type 2 diabetic patients and the association between usual nutrient intake and obesity in men and women with type 2 diabetes. Lower dietary fiber intake was associated with a higher prevalence of obesity in men, but not in women. Dietary fat, carbohydrate and protein were not associated with obesity in both men and women. The Korean type 2 diabetic patients in this study had an overall lower intake of fat and higher intake of carbohydrate than patients with type 2 diabetic patients from other countries in the literature, most of which are from Europe or North America (10, 11). While most of the previous studies in type 2 diabetic patients included a small number of patients (4, 20), the present study includes a large number of Korean type 2 diabetic patients. Although there are many studies on nutrient intake of patients with type 2 diabetes in the clinical trial setting, there are insufficient reports on real life intake of nutrients and its association with obesity in type 2 diabetic patients (4, 21). The present study was able to assess the dietary intake of a large population of type 2 diabetic patients in real life and evaluate the association with obesity. Therefore, the current findings can give more insights to the real life dietary intake and its association with obesity in type 2 diabetic patients.
Dietary fiber intake provides many health benefits. High intakes of dietary fiber may reduce the risk for developing coronary heart disease, stroke, hypertension, diabetes, and obesity and certain gastrointestinal disorders (22). Dietary fiber may modulate food intake and body weight, glucose homeostasis and plasma lipid profile and therefore there appear to be many reasons to recommend more fiber intake for diabetic individuals (23, 24). Epidemiologic data show a negative association between dietary fiber intake and obesity in non-diabetic men and women (4, 7-9, 25), but the association in type 2 diabetic patients has not been reported. The proposed mechanism by which dietary fiber modulates food intake and body weight is multiple. Decrease in energy density, prolonged chewing or gelling properties of the stomach may cause satiation. Fermentable dietary fibers increased plasma anorexigenic gut-derived peptides, PYY and glucaon like peptide-1 and reduced serum ghrelin levels leading to satiation in animal studies (23). Although there are many studies on the association between macronutrient intake and obesity in non-diabetic subjects (4, 7-9, 25), the association in type 2 diabetic patients has not been well studied. Because obesity itself is a major risk factor for development of coronary heart disease and can increase the risk of cardiovascular complications and cardiovascular mortality in patients with type 2 diabetes, attaining and maintaining a desirable body weight is important (3). The association between lower intake of dietary fiber and higher probability of obesity in men shown in this study are in line with previous studies in non-diabetic subjects. In women, there was no difference in dietary fiber intake between obese and non-obese subjects. This may be due to the higher fiber density in women compared to men or due to a sex difference of the effects of dietary fiber in type 2 diabetes.
In this study, saturated fat and carbohydrate intake were not associated with obesity in both men and women with type 2 diabetes. Higher carbohydrate intake was associated with a lower risk of obesity in several studies. Consuming a low-carbohydrate (approximately <47% energy) diet was associated with greater likelihood of being overweight or obese among healthy Canadian adults (26). In elderly people of the Mediterranean islands, increase in carbohydrate and protein consumption was associated with a lower likelihood of being obese (5). In European type 1 diabetic patients, higher carbohydrate intake was a significant independent predictor for lower levels of BMI in men and women (6). The lack of association in the present study may be due to the higher carbohydrate intake compared to other populations. Only 10.6% had a carbohydrate intake of less than 50% of total energy intake. High saturated fat intake has been reported to be associated with higher BMI in older adults with diabetes (26) but there was no association between saturated fat and obesity in the present study. This seems to be due to a lower saturated fat intake in the present study. Total fat did not have an effect on obesity in the present study, which is in line with the finding that fat consumption within the range of 18-40% of energy intake has little effect on body fatness (27).
The limitation of the study is that it is cross sectional and therefore cannot be interpreted into a definite causal relationship. However, this study represents one of the largest sources of data on Asian type 2 diabetic subjects that is currently available, making it of considerable interest. The use of a single 24 hr recall is also a major limitation of this study. The 24 hr recall can however provide detailed information on specific foods and is considered ideal for comparison of mean dietary intake levels of nutrients between populations (28). The subjects were divided into quintiles of each nutrient intake, enabling the comparison to be reliable between groups. Estimates from the single 24 hr recall method cannot be corrected for intra-individual daily variation in consumption and the variation of intake might be under or overestimated. The daily variations within a 24 hr dietary recall most probably lead to an attenuation of the effect size, probably resulting in the null results of some macronutrients (29, 30). Also, the study population was only recruited from academic medical centers and this may limit the generalization of the findings of this study.
In conclusion, lower level of fiber intake was associated with a higher odd of being obese in men with type 2 diabetes, supporting the importance of dietary fiber intake in the prevention and management of obesity in type 2 diabetes. The significance of these findings should be further studied in prospective studies.

 XML Download