

 PDF
PDF ePub
ePub Citation
 Print
Print


INTRODUCTION
According to a 2008 World Health Organization report, more than 500 million adults globally were obese (1). Obesity is associated with many health-related problems, such as cardiovascular, metabolic, and respiratory system problems (2). Obesity, especially abdominal obesity, is suggested to be associated with decreased pulmonary function. Several researchers have reported that abdominal obesity is inversely associated with forced expiratory volume in 1 cecond (FEV1) and forced vital capacity (FVC) (3). Because direct measuring of abdominal fat distribution is practically difficult, body mass index (BMI), waist circumference (WC) (4, 5), waist/hip ratio (6) and abdominal height (3) have been used as surrogates for abdominal adiposity. However the association between these surrogates and pulmonary function has not been consistent among studies.
Anatomically, abdominal adiposity is composed of two different compartments; visceral adipose tissue (VAT) and subcutaneous adipose tissue (SAT). VAT is metabolically more active and produces more pro-inflammatory adipokines than SAT (7). VAT is closely related to metabolic derangement, such as dyslipidemia (8), insulin resistance (9) and type 2 diabetes (7). Although an inverse relationship between abdominal adiposity and pulmonary function has been suggested, it is unclear which compartment is more closely related with pulmonary function. Only a few studies with small numbers of participants have investigated the relationship between compartments of abdominal adiposity and pulmonary function. Magnetic resonance imaging (10) and dual-energy radiography absorptiometry (11) have been performed to directly measure fat distribution in recent studies, but only a small number of subjects were enrolled.
We attempted to identify the impact of abdominal adiposity on pulmonary function by directly measuring the amount of abdominal adipose tissue using axial image post-processing from abdominal computed tomography (CT).
MATERIALS AND METHODS
Study population
In this cross-sectional study, we assessed study subjects between ages 18 to 85 yr who received comprehensive health examinations during November 1, 2005 to October 31, 2009, which included spirometry and abdominal adipose tissue analysis by CT scan. The examinations took place at the Healthcare System Gangnam Center (HCSGC) and Health Promotion/Disease Prevention Center (HPDPC) of Seoul National University Hospital, Seoul, Republic of Korea. Among them, we included only never smokers and excluded subjects with history of malignant diseases, self-reported asthma, and chronic lung diseases.
Measurements
Never-smokers were selected based on a self-administered medical questionnaire. Anthropometric measurements such as blood pressure (BP), height, weight, and WC were retrieved from the database, and BMI was calculated as weight in kilograms divided by the square of the height in meters (kg/m2). The population with BMI ≥ 23 kg/m2 was considered as overweight (12). WC was measured at the WHO recommended site; the midpoint between the lower border of the rib cage and the iliac crest (13). Results of blood tests including fasting plasma glucose (FPG), serum lipids, serum insulin and high-sensitivity C-reactive protein (hs-CRP) after overnight fasting were also collected.
Insulin resistance was assessed by the homeostatic model assessment of insulin resistance (HOMA-IR) (14). The formula for HOMA-IR is:

Low-density lipoprotein (LDL) cholesterol was measured directly. If directly measured LDL cholesterol was unavailable, LDL cholesterol was calculated (15). We excluded participants without directly measured LDL cholesterol level only when their triglycerides (TG) levels were above 400 mg/dL, since the estimated LDL cholesterol is not valid when the TG level is above 400 mg/dL.
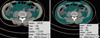
Detailed methods of using abdominal CT cross-sectional images to measure abdominal adipose tissue area are described elsewhere (16). Briefly, subjects underwent 16-detector row CT imaging of the abdomen (Somatom Sensation 16, Siemens Medical Solutions, Forchheim, Germany) in a supine position with both arms stretched above the head. A single slice at the umbilicus level was obtained. The adipose tissue area was determined using commercially available CT software (Rapidia 2.8; INFINITT, Seoul, Korea), and visceral and subcutaneous adipose tissue boundaries were defined using a manual tracing method with a cursor (Fig. 1).
Spirometric tests were performed following the American Thoracic Society recommendations (17) and were taken by experienced technicians. The same type of dry rolling seal spirometer (Model 2130, Viasys Respiratory Care Inc., San Diego, CA, USA) was used in both centers. FVC, FEV1, and FEV1/FVC were measured, which were expressed both as absolute values (L) and predicted values (%), calculated from the formula based on Korean population (18).
Statistical analysis
We established multiple linear regression models to predict FVC and FEV1 from abdominal adiposity. Because the distribution of abdominal adipose tissue was significantly different for males and females, we calculated P value and adjusted R2 values separately according to gender. Model 1 was adjusted for age and height. Model 2 was adjusted for the components of Model 1 and metabolic components such as weight, WC, systolic BP, HOMA-IR, hs-CRP, and LDL cholesterol were added. Stata 10 (StataCorp, College Station, TX, USA) was used as the statistical software, and results were significant when P < 0.05.
RESULTS
Demographic and clinical characteristics of the participants
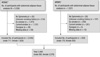
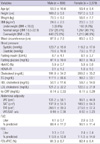
Of the 7,113 participants who underwent health examinations including spirometry and abdominal adipose tissue analysis during the study period, 3,469 met our inclusion criteria (Fig. 2). Of the 3,469 participants, 890 (25.7%) were male. The mean BMI and WC among males and females were 24.6 ± 2.8 kg/m2 and 87.8 ± 7.8 cm and 23.0 ± 3.0 kg/m2 and 83.0 ± 8.3 cm, respectively. The overweight population was 648 (72.8%) in male, and 1,210 (46.9%) in female. Although TAT in males (269.1 ± 99.3 cm2) was similar to that in females (273.6 ± 97.3 cm2), the distribution of fat was different: the VAT/SAT ratio was 0.99 ± 0.38 in males and 0.50 ± 0.23 in females. The predicted FVC and FEV1 were 88.4 ± 11.2% and 113.8% ± 13.8% in males and 90.1% ± 11.4% and 111.5% ± 14.0% in females. The average FEV1/FVC in males and females was 81.3% ± 6.7% and 82.4% ± 6.4%, respectively (Table 1).
Association between abdominal fat and FVC
In males, TAT, SAT, and VAT were inversely associated with the absolute value of FVC, regardless of model. However, in females, SAT was not associated with FVC in either model 1 or 2. Instead, TAT and VAT in model 2, but not in model 1, were inversely associated with the absolute FVC value (Table 2).
Association between abdominal fat and FEV1
TAT, SAT, and VAT were also inversely associated with the absolute value of FEV1 in model 1 in males. However, the inverse association between SAT and FEV1 was attenuated in model 2 (P = 0.056). In females, VAT in model 1 and TAT and VAT in model 2 was inversely associated with FEV1, but there was no association between SAT and FEV1 in both model 1 and model 2 (Table 2).
Association between abdominal fat and predicted values of FVC and FEV1
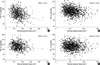
Fig. 3 shows the scatter plots of predicted values of FVC and FEV1 according to the amount of visceral adipose tissue in overweight population (BMI ≥ 23 kg/m2). Both predicted FVC and FEV1 had statistically significant negative linear correlations with VAT. In normal BMI group (18.5 ≤ BMI < 23), only FVC showed negative linear correlation with VAT (P = 0.001 in male, P = 0.002 in female).
Correlation between WC, BMI and the amount of adipose tissue measured by CT
Table 3 shows the adjusted R2 between traditional abdominal adiposity indices and the amount of adipose tissue directly measured by abdomen CT. WC was best correlated with TAT (adjusted R2 = 0.775, P < 0.001 in male, and adjusted R2 = 0.701, P < 0.001 in female). And the similar result was observed with BMI and TAT (adjusted R2 = 0.672, P < 0.001 in male, and adjusted R2 = 0.649, P < 0.001 in female).
DISCUSSION
In our study, the amount of adipose tissue, TAT, SAT, or VAT, directly measured using abdominal CT was inversely associated with lung function among non-smokers, even after being adjusted for age, height, weight, WC, systolic BP, HOMA-IR, hs-CRP, and LDL cholesterol. This observation implies that the amount of adipose tissue has a negative impact on pulmonary function even after adjustment for anthropometric and metabolic parameters.
How the amount of adipose tissue affects pulmonary function is still unclear. One possible explanation is that the systemic inflammation triggered by adipose tissue. Adipose tissue is associated with elevated pro-inflammatory molecules, such as complement C3, tumor necrosis factor-α, and interleukin (IL)-6 (7). In addition, activated macrophages in adipose tissue cause low-grade chronic inflammation (19) and are associated with insulin resistance (20, 21) in animal models. Furthermore, IL-6, produced mainly from VAT in individuals with obesity, is related to CRP level in arterial blood (22). An animal study has shown that IL-6 overexpression may cause an emphysematous lung phenotype (23). In epidemiologic studies, elevated CRP or IL-6 was associated with chronic inflammatory airway disease, such as asthma (24) or chronic obstructive pulmonary disorder (COPD) (25). According to a recently published observational study, systemic inflammation was associated with reduced pulmonary function in never smoking male population (26). Considering these in vitro and in vivo observations, impaired pulmonary function among individuals with increased amount of adipose tissue could be understood in the context of systemic inflammation.
Traditionally, BMI and WC have been used as indices of abdominal adiposity. We directly compared the correlation between these surrogate indicators of abdominal adiposity and directly measured VAT, which is a metabolically active adipose tissue. In our study, WC and BMI were best correlated with TAT, and least correlated with VAT (Table 3). These phenomenon was also observed previously in Japanese population (27). In the context of the consistent results, WC and BMI could well reflect the amount of TAT, but not VAT.
Interestingly, the association between abdominal obesity and lung function was different in gender according to fat distribution. Compared between VAT and SAT, both were important in males, but only VAT was important in females (Table 2). In fact, there were several reports underscoring the importance of VAT as a metabolic risk among females rather than males. A cardiometabolic risk profile was associated with VAT more profoundly among females (28). In addition, the association between VAT and atherosclerosis was stronger in females than males (29). Our current study also coincided in the importance of VAT on pulmonary function among females. However, the reasons for the more profound decreased pulmonary function of VAT among females remain to be discovered.
Strength of our study is that we included only never-smokers. Previous or current smoking is one of the most important confounding factors affecting impaired pulmonary function. To eliminate any influence of smoking, we excluded patients with even minimal history of smoking. Subsequently, inclusion of patients with COPD was minimized.
However, to fully appreciate the results, we must consider the limitations of this study. First, the study participants were not representative of the general population. Participants in our study were those individuals who had undergone medical examinations consisting of rather expensive tests. These subjects might be more concerned about their health and could afford to pay the cost of the program. Therefore, a relatively healthier and wealthier group compared to the general population was included in this study. Second, because this was a cross-sectional study, we could not infer a cause and effect relationship between abdominal obesity and decreased lung function. To confirm the causality of abdominal obesity on pulmonary function, an individualized follow up study is needed.
In conclusion, the amount of abdominal adipose tissue directly measured using CT is inversely associated with lung function. However, the amount of TAT is more important for pulmonary function in males, but the amount of VAT rather than SAT is more important in females.


 XML Download