

 PDF
PDF ePub
ePub Citation
 Print
Print


INTRODUCTION
Obsessive-compulsive disorder (OCD) is characterized by stereotyped repetitive behaviors and thoughts affecting from a rigid conceptual framework (1), in addition to coincident deficits in cognitive flexibility during set-shifting (2) or task-switching tasks (3). Functional magnetic resonance imaging (fMRI) studies in OCD have consistently reported an association between cognitive inflexibility and aberrant activity in the frontal-striatal areas including the orbitofrontal cortex (OFC), dorsolateral prefrontal cortex (DLPFC), basal ganglia, and the parietal cortex (4, 5). Moreover, Chamberlain et al. (4) demonstrated the importance of these regions, including lateral OFC, lateral PFC, and parietal cortex, in the development of OCD pathological behavior and suggested that cognitive inflexibility might represent a cognitive OCD endophenotype.
In agreement with previous studies, we have recently reported a deficit in task-switching ability accompanied by dysfunctional brain activation patterns in patients with OCD compared with healthy controls. We suggested an imbalance between the dorsal and ventral frontal-striatal regions during the task, including the DLPFC, anterior cingulate cortex (ACC), caudate body, and OFC, showing hyperresponsive to the repeat condition in the ventral frontal-striatal regions and hyporesponsive to the switch condition in the dorsal frontal-striatal regions (3). Neuroimaging studies indicate that activity in the ventral frontal-striatal regions increases at rest and in response to symptom-provoking stimuli, whereas activity in the dorsal frontal-striatal regions decreases during the performance of executive functions such as planning and switching in patients with OCD (3, 6-8). It has been suggested that these dysfunctional neuronal responses may be the result of an imbalance between direct (excitatory) and indirect (inhibitory) pathways in the frontal-striatal circuit and are related to the pathophysiology of OCD (6, 7, 9).
Several studies have used fMRI to investigate whether dysfunctional activation is normalized following treatment (10-12). However, the task paradigms used in previous follow-up studies (e.g. complex motor task, Stroop task, and working memory task) cannot elucidate the changes in neural correlates directly related to cognitive inflexibility, particularly task switching, which is the core deficit of OCD. Thus, it is unclear whether the brain activation pattern associated with cognitive inflexibility observed in OCD patients is altered by treatment (i.e., improved clinical symptoms and anxiety). A whole-brain imaging analysis is necessary to clarify this issue.
Longitudinal PET studies have revealed improved function in the ventral frontal-striatal regions in response to treatment with selective serotonin reuptake inhibitors (SSRIs) (13-16). In contrast, Nielen and Den Boer (17) found that fluoxetine had no clinical effect on cognitive functions mediated by the dorsal frontalstriatal circuit. Neuropsychological follow-up studies have reported that deficits in executive function mediated by DLPFC may not improve completely regardless of the extent of clinical improvement (18-20). Taken together, results from previous studies suggest that treatment may produce differential changes in the ventral frontal-striatal regions and the dorsal frontal-striatal regions in patients with OCD. Considered the implication in the findings of Chamberlain et al. (4), the parietal cortex may show dysfunctional activation similar to that of the PFC and basal ganglia despite treatment. Thus, in this study we observed changes in the parietal cortex in addition to the fronto-striatal regions.
The aim of this study is to examine whether pharmacotherapy could alter the activation pattern in the frontal-striatal circuits and parietal region recruited in task-switching. We investigated the longitudinal change in the activation pattern related to the concurrent deficit of ventral frontal-striatal regions and regulatory dysfunctions of the dorsal frontal-striatal and parietal regions in unmedicated OCD patients before and after treatment. Based on previous studies and our work, we hypothesized that aberrant activation in the ventral frontal-striatal regions that associated with cognitive inflexibility in OCD would be normalized after treatment, while dysfunctional activation in the dorsal frontal-striatal and parietal regions would remain despite clinical improvement.
MATERIALS AND METHODS
Subjects
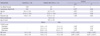
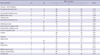
Ten patients diagnosed with OCD according to the criteria of the Diagnostic and Statistical Manual of Mental Disorders-IV (DSM-IV) were included in the study. An fMRI scan was performed in all patients one week following enrollment in the study and after 16 weeks of pharmacological treatment. At baseline, nine patients were drug-naive, and one had received medication for 10 days 1 month prior to inclusion in the study. At follow up, nine patients with OCD were on escitalopram treatment (average, 33.1 mg/day; range, 15-50 mg/day) and one patient was on fluoxetine (70 mg/day). Anxiolytics and an antipsychotic were added in two patients (2 mg/day of diazepam, 0.5 mg/day of clonazepam) and one patient (0.25 mg/day of risperidone), respectively. All of the control subjects and four patients were overlapped with a previous study (3), and six patients were newly recruited. One patient had comorbid obsessive-compulsive personality disorder (OCPD); none of the remaining patients had Axis I or major Axis II pathology. The control group consisted of 20 sex-, age-, handedness-, and IQ (using Korean-Wechsler Adult Intelligence Scale-Revised)-matched healthy volunteers. An assessment using the Structured Clinical Interview for DSM-IV Non-patient Version (SCID-NP) confirmed that no control subject had an Axis I psychiatric disorder. Exclusion criteria included a lifetime history of psychosis, substance abuse or dependence, significant head injury, bipolar disorder, Tourette's disorder, seizure disorder, and mental retardation. The demographic characteristics of the subjects are presented in Table 1.
The primary treatment outcome was measured as percent (%) improvement between the pre- and post-treatment Yale-Brown Obsessive Compulsive Scale (Y-BOCS) score. The Beck Depression Inventory (BDI) and Beck Anxiety Inventory (BAI) were administered at the pre- and post-treatment time points to assess changes in depressive and anxiety symptoms as potential confounding factors. As seen in most clinical samples of OCD, although subthreshold depressive symptoms were higher in OCD patients than healthy controls, no patients were diagnosed with major depressive disorder according to the SCID I.
We classified the patients according to the five symptom dimensions (21) and found the following predominant obsession/compulsions among the patients: contamination/cleaning (n = 4), aggressive/checking (n = 5) and symmetry/ordering (n = 1).
Task paradigm
We used a task-switching paradigm that required the participants to alter components of their response according to two different types of cues (square or diamond) that were previously demonstrated (3). The stimuli were four kinds of icons: a green house, a blue house, a green face, and a blue face. The square or diamond cue was presented for 500 ms, followed by a fixation cross for 670 ms. The participants were asked to respond to the color or shape of the upcoming stimulus, which appeared for 500 ms. The intertrial interval (ITI) was randomly set between 1,840 and 5,350 ms. A square cue signaled an upcoming shape (face or house) stimulus, and the diamond cue signaled a color (blue or green) stimulus. Each trial was classified into the task-switch or the task-repeat condition, depending on whether the upcoming task set was different from or the same as the previous one. A total of 264 trials were presented, and all participants were trained on the stimulus-response set for 10 min prior to scanning.
Image acquisition
Whole-brain imaging was performed using a 1.5 Tesla whole body scanner (Siemens AVANTO, Erlangen, Germany) with a standard head coil. Functional images were obtained using an echo-planar imaging sequence (repetition time [TR] = 2,340 ms, echo time [TE] = 52 ms, 3.28 × 3.28 × 4 mm3, flip angle [FA] = 90°), yielding 25 axial slices with a 1-mm interslice gap. The fMRI data were acquired in four runs of 130 scans of 304 sec each, lasting a total of approximately 20 min.
Functional imaging data analysis
The imaging data were analyzed using SPM2 (Wellcome Trust Centre for Neuroimaging; http://www.fil.ion.ucl.ac.uk/spm). The first three images in each run were discarded to eliminate non-equilibrium effects of magnetization. The functional images were corrected for differences in slice-acquisition timing and then realigned to the image in the middle of the second session to correct for motion effects. The images were normalized into standard stereotactic Montreal Neurological Institute (MNI) space using the echo-planar imaging template and resampled with a voxel size of 2 × 2 × 2 mm3. The normalized images were smoothed using an 8-mm full-width at half-maximum (FWHM) Gaussian kernel.
We used a two-phase analysis process in which contrast images reflecting switching activity in each subject were entered into a second-level random effects analysis. Four event types (task repeat, task switch, error trials, and post-error trials) were defined at the first level of analysis, and the task-switching-related brain activations were identified from task-switch minus the task-repeat contrast images. After confirming the task-switching-related brain activation using a one-sample t-test analysis in each subject group, we performed separate two-sample t-tests using the contrast images of task-switch minus task-repeat to compare healthy controls and patients with OCD at baseline and follow-up. A paired t-test was used to compare the patients at baseline and at the 16-week follow-up. Activations were reported using the criteria of P < 0.005 uncorrected at the voxel level, with a significance of P < 0.05 at the cluster level for multiple comparisons. For descriptive purpose, we also reported additional foci passing uncorrected threshold of P < 0.005 at the voxel level when not significant at the cluster level if these were consistent with regions of a priori interest based on our previous study (3) but we do not report any clusters containing fewer than 30 voxels to prevent false positives.
Further analyses using a region of interest (ROI) approach were conducted to examine changes in the activation pattern in the dorsal circuits, including the dorsal frontal-striatal and parietal regions, and in the ventral circuits, including the ventral frontal and limbic/paralimbic regions. Functinoal ROIs were identified as regions that showed significant differences between the OCD at baseline and control groups and between baseline and follow-up in patients with OCD. These functional ROIs included the DLPFC, dorsal ACC (peak MNI coordinates: -2, 32, 26), caudate, ventrolateral prefrontal cortex (VLPFC), rostral ACC, OFC, thalamus, insula, hippocampus, and parietal area. The thalamus, insula, and hippocampus were included based on the within-patient group comparison, and the other areas were determined from the between-subjects comparison at baseline. We estimated the BOLD percentage signal change for each subject using MarsBaR software (http://marsbar.sourceforge.net/) to extract beta values for each condition from a 5-mm sphere around the peak-activated voxel for each cluster of the functional ROIs in the normalized images, and then calculated the task-switch activation value compared to the task-repeat activation value. A one-way analysis of variance (ANOVA) was used to determine the group effect for each ROI, and Fisher's LSD test was used as a post hoc test for group-by-group comparisons.
Correlation analysis
Correlations between changes in ROI activity (activity at post-treatment minus activity at pre-treatment) related to flexibility (task-switch minus task-repeat condition) and percent improvement on the Y-BOCS, BDI, and BAI scores were examined. Additionally, we investigated correlations among the behavioral performance changes in switch error rates, switch reaction times (RTs), repeat error rates, repeat RTs, and switching cost of RTs (task-switch RTs minus task-repeat RTs), improvement of symptoms, and longitudinal changes in ROIs. Correlations were assessed using the Pearson product-moment correlation coefficient. Statistics were performed using SPSS (Version 12.0), and statistical significance was set at P = 0.05 (two tailed), corrected for multiple testing.
Fixed effects analyses in patients before and after treatment separately
Fixed effects analysis does not take appropriate account of the between-subjects variance and thus they do not allow population inferences. However, it increases detection power and allows for inferences related to the samples. Therefore, we conducted fixed effects analyses to investigate the similarities and the differences in task-switching-related brain regions in patients with OCD before and after treatment. Fixed effects analyses were separately performed in patients at baseline and follow-up by concatenating the data across subjects. These results were thresholded at P < 0.005 uncorrected at the voxel level, with a significance of P < 0.05 at the cluster level for multiple comparisons.
RESULTS
Treatment response
After 16 weeks of pharmacotherapy, the patients with OCD showed significant clinical improvement compared with the pre-treatment assessment (t = 2.23, P = 0.05). Y-BOCS scores decreased by 26.1% ± 41.2% (range; -53.3-80.0), and seven patients showed a greater than 30% reduction in the Y-BOCS score. Moreover, the patients showed a significant decrease in anxiety, as indicated by a 43.0% ± 36.5% reduction in BAI scores (Table 1).
Behavioral performance
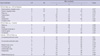
The correct response rate was more than 80% for all subjects (control, 95.8% ± 2.4%; OCD baseline, 92.1% ± 8.8%; OCD follow up, 94.3% ± 5.4%) except one (baseline, 71.0%). We analyzed error rates and RTs for the task-switch and task-repeat conditions. As previously reported (3), the task-switch error rates were significantly higher in the OCD group (at baseline) than in the control group (P < 0.05). The error rates and RTs tended to be lower in the OCD group at follow-up compared with baseline for both the task-switch and task-repeat conditions; however, no significant differences were observed in these behavioral performances (Table 2). Switching cost in the OCD group was significantly improved following treatment (Table 2). When subjects switch from one task to another, the switching cost (the mental effort to achieve cognitive flexibility) can be measured by calculating task-switch RTs minus task-repeat RTs. An improvement in switching cost reduces the energy required for flexibility, and cognitive flexibility is improved.
Regional patterns of activity after pharmacotherapy
The between-group analysis of the OCD group at baseline and controls revealed that the task-switch minus task-repeat condition produced significantly lower levels of activity in the OCD group in the bilateral DLPFC, bilateral parietal area, right rostral ACC, left dorsal ACC, bilateral caudate, right OFC, bilateral VLPFC, right insula, and bilateral hippocampus (Table 3, Figs. 1, 2A).
Repeated-measures analysis revealed that the pharmacotherapy significantly increased task-switching activity in the right rostral ACC, right insula, right posterior cingulate cortex (PCC), right parietal area, left thalamus, and left hippocampus (Table 4, Fig. 2A). In contrast, treatment decreased activity in the right middle temporal gyrus (MTG; MNI coordinates; 52, -34, -10; Z-value = 3.59) during task switching.
A comparison of the controls and patients at follow-up using the same contrast revealed lower activity in the dorsal frontoparietal regions in the OCD group, including the bilateral DLPFC, bilateral dorsomedial prefrontal cortex (DMPFC), right medial frontal cortex (MeFC), and bilateral parietal areas (Table 4, Fig. 1), whereas the other paralimbic regions including left insula, and right parahippocampal gyrus were hyperactive in patients with OCD after pharmacotherapy compared to the controls (Table 4).
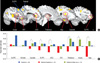
Fig. 2B shows the beta values for the switching condition compared to the repeat condition in controls and patients at pre- and post-treatment. The 16-week treatment significantly increased activity in the ventral frontal, striatal, and limbic/paralimbic regions including the caudate, VLPFC, rostral ACC, thalamus, insula, and hippocampus. In contrast, no significant difference was observed in dorsal frontoparietal regions including the DLPFC and parietal area following pharmacotherapy. Hyperactivity observed in the insula of the OCD group following treatment was significant compared with the control subjects, and the increase in activity in the OFC and dorsal ACC were not significant.
Correlation analysis
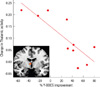
A significant correlation was observed between the longitudinal change (activity at post-treatment minus activity at pre-treatment) in the left thalamus and right insula and the percent improvement on the Y-BOCS scores following the 16-week pharmacotherapy. The correlation coefficient between the change in activity in the left thalamus and percent of Y-BOCS improvement was -0.82 (P = 0.004), and that between the change from baseline to endpoint between the right insula activity and BAI was -0.72 (P = 0.02). After correcting for multiple testing, only the correlation between the change in thalamus activity and percent Y-BOCS improvement was significant (< 0.006; corrected P = 0.05/9) (Fig. 3). Improvement in behavior and longitudinal changes in brain activity were not correlated.
Fixed effects results in patients before and after treatment separately
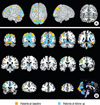
During task-switch minus task-repeat contrast, both patients at baseline and follow-up observed activation in the DLPFC and parietal cortex, which is consistent with the results of previous studies in healthy volunteers (Fig. 4). While patients at baseline showed activation in the OFC, patients at follow-up did not exhibit this activation. In contrast, patients at follow-up showed activation in the thalamus, ACC, and caudate.
DISCUSSION
The present study used the task-switching paradigm to examine the effect of a 16-week pharmacotherapy on the functional activation of brain areas mediating cognitive flexibility in patients with OCD. We found that the ventral frontal-striatal activation was partially normalized with improved clinical symptoms, while a dysfunctional activation pattern was sustained in the dorsal frontoparietal regions. In addition, treatment decreased the error rate and RT for both task-switch and task-repeat conditions and significantly improved switching cost in OCD patients. The decreased switching cost was regarded as the result of improved behavioral flexibility. As the switching cost is determined by both task-switch and task-repeat RTs (22), a common learning effect can be excluded from the results.
Several previous studies have suggested that an imbalance between direct (excitatory) and indirect (inhibitory) pathways in the frontal-striatal circuits was related to the dysfunctional neuronal responses and the pathophysiology of OCD (6, 7, 9). The imbalance in these pathways is thought to result in hyperactivity in the ventral frontal-striatal network and reduced activity in the dorsal frontal-striatal network. A recent meta-analysis of voxel-based morphometry studies on OCD showed increased regional gray matter volumes in striatum and decreased volumes in dorsal MeFC (23). The report suggested that gray matter volumes in striatum were related to the symptom severity and functional alterations in ventral frontal regions such as OFC might be compensatory responses. Thus, although deficits in ventral frontal-striatal regions may be state-dependent, primary alterations in dorsal frontal-striatal regions may not improve after a short period of treatment. Incoherent treatment response patterns between ventral and dorsal frontal-striatal circuits after pharmacotherapy were anticipated in the present study. As expected, in this study we showed discordance in functional improvement between the ventral frontal-striatal and dorsal frontoparietal regions following treatment, that is improved functional activation in ventral frontal-striatal regions in addition to sustained dysfunctional activation in dorsal frontoparietal regions. Fixed effects results also showed differential activation pattern in the frontoparietal regions, which is the similarities in the DLPFC and parietal cortex and the differences in the OFC, thalamus, ACC, and caudate between patients at baseline and follow-up.
Clinical improvement in the OCD group was associated with an overall change in brain activity in the ventral frontal and striatal regions during task switching. This finding was consistent with previous follow-up studies using PET (13-16). Previous neuroimaging studies reported that the improvement of symptoms in patients with OCD was accompanied by metabolic changes in the VLPFC, OFC, ACC, caudate nucleus, and thalamus (13-16, 24). Furthermore, reversible neuronal responses were observed in the white matter of the thalamus in patients with OCD following 12 weeks of citalopram treatment (25). Moreover, a previous longitudinal fMRI study found that improvement in symptoms was associated with decreased activation in the OFC, ACC, thalamus, and insula during a symptom provocation task (12). This finding is similar to the changes we observed in ventral frontal and limbic/paralimbic activation. However, the longitudinal change in OFC activation was not significant in our random effects analysis, possibly because the OFC abnormalities associated with maintaining the previous task-set were not sufficiently improved (3). This result was also demonstrated by Nabeyama et al. (11) in a follow-up study using the Stroop task.
Pharmacotherapy increased activity in the thalamus and limbic areas and produced a tendency toward hyperactivity in the left insula and right parahippocampal gyrus in patients with OCD. A possible explanation for this is that a reduction in anxiety, resulting from improved symptoms, produced an increase in limbic system activation. This suggests that the hypoactive ventral frontal and limbic regions can be modified in OCD by therapeutic interventions as a state marker (10, 26). Additionally, the compensatory responsiveness in the limbic/paralimbic regions (9) may be associated with excessive activity in the automatic subprocesses of the ventral circuit (7, 27).
In the present study, post-treatment thalamic activity was increased, and the thalamic activity change was negatively correlated with the OC symptoms improvement; thus, treatment increased activity in the thalamus, but less improved patients showed more increased activity in thalamus. In contrast, Zitterl et al. (28) reported a negative association between OCD symptom severity and thalamic/hypothalamic serotonin transporter availability in both the baseline and post-treatment conditions. Given the hyperactive pattern in the limbic and paralimbic regions, the inverse relationship between changes of thalamic activity and OC symptom severity may be a compensatory mechanism for unfulfilled improvement of OC symptoms or a overloaded result in the frontal-striatal circuit (7). As hypothesized by Saxena and Rauch (9), excess activity in the direct (as opposed to indirect) frontal-striatal pathway may lead to enhanced activation of regions including the medial-dorsal thalamus.
The DLPFC and parietal region are known to be important for cognitive flexibility (29). Fixed effects results showed activation of these regions in both patients at baseline and follow-up. Considering above results, it is not clear whether treatment altered the dorsal frontal and parietal dysfunction. However, a comparison between patients with OCD at post-treatment and control subjects revealed a sustained deactivation in the bilateral DLPFC and bilateral parietal cortex in the OCD group. Decreased activation in the frontal cortex (BA 9, 10) in response to the Stroop task (12) and unchanged activity in the frontal cortex reported in a follow-up fMRI study in children and adolescents with OCD (10) agree with the sustained decrease in DLPFC activation observed in the present study. In contrast, studies using a variety of approaches to examine the effect of treatment on activation of the parietal region in OCD have reported inconsistent results as exhibiting a non-significant change in the N-acetylaspartate level in the parietal region (30) and increased activation during the Stroop task (12).
Our study has some limitations. First, the sample size was relatively small and thus our results may be difficult to generalize because of the limited statistical power. However, the repeated-measures longitudinal design in unmedicated patients is valuable for distinguishing pathophysiological traits from states in patients. Second, depression and anxiety levels were significantly higher in OCD patients than in healthy controls, which could have potential confounding effects. In this study, differences between group and detected changes in brain activity could be due to comorbid symptoms such as depression or anxiety. However, no patients were diagnosed with major depressive disorder or other specific anxiety disorder according to the SCID I. In addition, we attempted to address the effects of depression or anxiety levels based on a correlation analysis with activation in each functional ROI and found no significant correlation, except a negative correlation between changes in insular activity and BAI. We also examined the group effect for each ROI using analysis of covariance with depression and anxiety level as covariates and there were no differences between the results of these added analysis and those of ANOVA. Finally, the task-switching paradigm primarily recruited the specific area of brain, prefrontal cortex and posterior parietal cortex rather than subcortical region; thus, our study is preliminary results. Further connectivity analyses are needed to investigate clearly the response of the striatal areas to the between dorsal and ventral circuits.
In summary, our preliminary results indicate that the flexibility deficit in OCD as assessed using the switching task is associated with dysfunctional activity patterns in the frontal-striatal and parietal regions. We demonstrated that selectively increased activity in the ventral frontal, striatal, and limbic regions produces an incomplete but considerable improvement in clinical symptoms and behavior. However, as we hypothesized, dysfunctional activity in dorsal frontoparietal regions in patients with OCD was sustained. Our results suggest that altered brain activation in ventral frontal-striatal regions in OCD patients was associated with their cognitive flexibility and changes in these regions may underlie the pathophysiology of OCD.


 XML Download