Journal List > J Korean Med Sci > v.26(2) > 1021558

Jeon, Kim, Huh, Mok, Song, Kim, Kim, Lee, Kim, and Kim: Cystatin C as an Early Biomarker of Nephropathy in Patients with Type 2 Diabetes

Abstract

This study was done to evaluate clinical usefulness of cystatin C levels of serum and urine in predicting renal impairment in normoalbuminuric patients with type 2 diabetes and to evaluate the association between albuminuria and serum/urine cystatin C. Type 2 diabetic patients (n = 332) with normoalbuminuria (n = 210), microalbuminuria (n = 83) and macroalbuminuria (n = 42) were enrolled. Creatinine, urinary albumin levels, serum/urine cystatin C and estimated glomerular filtration rate (eGFR by MDRD [Modification of Diet in Renal Disease] and CKD-EPI [Chronic Kidney Disease Epidemiology Collaboration] equations) were determined. The cystatin C levels of serum and urine increased with increasing degree of albuminuria, reaching higher levels in macroalbuminuric patients (P < 0.001). In multiple regression analysis, serum cystatin C was affected by C-reactive protein (CRP), sex, albumin-creatinine ratio (ACR) and eGFR. Urine cystatin C was affected by triglyceride, age, eGFR and ACR. In multivariate logistic analysis, cystatin C levels of serum and urine were identified as independent factors associated with eGFR < 60 mL/min/1.73 m2 estimated by MDRD equation in patients with normoalbuminuria. On the other hand, eGFR < 60 mL/min/1.73 m2 estimated by CKD-EPI equation was independently associated with low level of high-density lipoprotein in normoalbuminuric patients. The cystatin C levels of serum and urine could be useful markers for renal dysfunction in type 2 diabetic patients with normoalbuminuria.

INTRODUCTION

The number of people with diabetes is increasing due to population growth, aging, urbanization and the increasing prevalence of obesity and physical inactivity. According to the World Health Organization (WHO), the prevalence of diabetes for all age-groups worldwide was estimated to be 2.8% in 2000 and 4.4% in 2030 (1). Estimation of the prevalence of earlier stages of chronic kidney disease (CKD) in the US population and ascertainment of trends over time is central to disease management and prevention planning, particularly given the increased prevalence of obesity and diabetes (2). To prevent this increase, screening for CKD and early intervention are necessary. In diabetic patients, the early detection of diabetic nephropathy has focused on the measurement of urinary albumin excretion rate. The elevated urinary albumin excretion rate within microalbuminuric level (30-299 mg/24 hr or a spot urine albumin-to-creatinine ratio of 30-299 mg/g) allows the detection of patients with an increased risk for the development of overt diabetic nephropathy with persistent macroalbuminuria. Moreover, impaired renal function may be present even in patients with normal urinary albumin excretion rate (3). Gold standard procedures for glomerular filtration rate (GFR) measurement, based on the clearance of 51Cr-EDTA or iohexol, are impractical in clinical settings and for larger research studies.
Cystatin C, a cysteine protease inhibitor, is freely filtered by the renal glomeruli, metabolized by the proximal tubule and identified as a promising marker of renal failure (4). Cystatin C is produced at a constant rate by nucleated cells and released into bloodstream with a half-life of 2 hr. Its concentration is almost totally dependent on GFR. Other studies have demonstrated that serum cystatin C is an early renal marker in diabetic patients (5-7), but not all studies have done so (8).
Thus, we explored the possibility of the cystatin C levels of serum and urine as markers of early renal impairment in normoalbuminuric patients with diabetes. We also evaluated the relationship of albuminuria and serum/urine cystatin C.

MATERIALS AND METHODS

Patients

We retrospectively studied the samples of serum and urine from 335 patients with type 2 diabetes who visited our hospital between January 2008 and October 2009. We recorded confidential information of name, age, gender, race, height, weight and history of renin-angiotesin system inhibitors or antihypertensive medication. Because thyroid function could affect the levels of cystatin C (9), we excluded the patients with thyroid disease, or taking the medication due to thyroid disease in 6 months. We also excluded patients with uncontrolled hypertension making an effect on albuminuria.
The cystatin C levels of serum and urine were measured by the latex agglutination test (Modular P800, Roche, Diagnostics, Mannhein, Germany). The eGFR level was calculated using the Modification of Diet in Renal Disease (MDRD) formula: MDRD = 186 × (serum creatinine [mg/dL])-1.154 × age-0.203 (10). A correction factor of 0.742 was used for women. The eGFRcys level was calculated by the Chronic Kidney Disease Epidemiology (CKD-EPI) equation: eGFR = 127.7 × (cystatin C in mg/L)-1.17 × (age in years)-0.13 × (0.91 if female) (11). Patients were divided into 3 groups according to their urinary albumin concentration: those with normoalbuminuria (n = 210), those with microalbuminuria (n = 83) and those with macroalbuminuria (n = 42). Moreover, normoalbuminuric patients were subdivided according to eGFR calculated by the MDRD formula: those with ≥ 60 mL/min/1.73 m2 (n = 181) and those with GFR < 60 mL/min/1.73 m2 (n = 29).

Statistical analysis

In statistical analysis, SPSS for Windows (version 13.0) were used. Data are presented as mean ± SD for normally distributed values. Differences between the groups were analyzed by ANOVA, followed by the Bonferroni's test for normally distributed values and by the Kruskal-Wallis test, as well as the Dunn's test for non-parametric values. Pearson's correlation coefficient was employed to test the correlations between different variables. Before testing correlations, all non-normally distributed values were log-transformed to better approximate normal distributions. After correlation analysis, stepwise multiple linear regression was performed with the variables to find the factor that effects the cystatin C levels of serum and urine. Receiver operating characteristics (ROC) analysis was employed to calculate the area under the curve (AUC) for the cystatin C levels of serum and urine to find the best cutoff values for identifying renal impairment in diabetic patients. Logistic regression was performed to find the predicting factors for renal impairment in normoalbuminuric patients. All results were considered significant if P < 0.05.

Ethics statement

The study was approved by the institutional review board of the Pusan University Hospital, Busan, Korea (IRB review exemption No. 0740-1289).

RESULTS

Patient characteristics

Patients were categorized into 3 groups depending on their urinary albumin excretion evaluated using the urine albumin/creatinine ratio (ACR) (mg/g creatinine): the macroalbuminuric, microalbuminuric and normoalbuminuric groups. The baseline characteristics of the subjects are shown in Table 1. There were no significant differences in age and sex between the 3 groups. However, eGFR was significantly lower in the macroalbuminuric group (44.9 ± 26.6) than in the microalbuminuric (76.0 ± 27.8) and normoalbuminuric groups (84.6 ± 23.3) (P < 0.001). A high ACR was associated with antihypertensive agents, renin-angiotensin system (RAS) inhibitors, lipid lowering agents, high HbA1C/glucose, low eGFR and high triglycerides (Table 1).

Differences in the cystatin C levels of serum and urine according to albuminuria

The levels of cystatin C in serum showed stepwise increase with albuminuric levels (P < 0.001, P = 0.013, respectively) (Table 1, Fig. 1). Serum cystatin C was significantly different according to their albuminuria (normoalbuminuria vs microalbumiuria, P < 0.01; microalbumiuria vs macroalbuminuria, P < 0.001; normoalbuminuria vs macroalbuminuria, P < 0.001) (Table 1, Fig. 1A). The level of urine cystatin C also showed stepwise increase with albuminuric level (normoalbuminuria vs microalbumiuria, P < 0.05; microalbumiuria vs macroalbuminuria, P < 0.001; normoalbuminuria vs macroalbuminuria, P < 0.001) (Table 1, Fig. 1B).

Parameters related to the cystatin C levels of serum and urine in diabetic patients

The correlations between the log-transformed cystatin C levels of serum and urine and the albumin creatinine ratio were analyzed in all diabetic patients. The serum level of cystatin C was found to directly correlate with albuminuria (r = 0.555, P < 0.001). The urine level of cystatin C also positively correlated with albuminuria (r = 0.500, P < 0.001). In Pearson's correlation analysis, the serum level of cystatin C was related to age, ACR, creatinine, eGFR, C-reactive protein (CRP), high-density lipoprotein and systolic blood pressure; and the urine level of cystatin C was related to ACR, HbA1C, creatinine, GFR, CRP and glucose. We performed a stepwise multiple regression analysis with these factors. The serum level of cystatin C was related to CRP, ACR and GFR, and the urine level of cystatin C was related to triglyceride, age, eGFR and ACR.

Differences in the cystatin C levels of serum and urine according to eGFR in the normoalbuminuric group

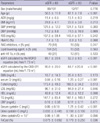
Table 2 presents the clinical characteristics of 210 patients with normoalbuminuria according to their eGFR. The patients with eGFR < 60 mL/min/1.73 m2 (n = 29, 14%) by the MDRD equation were older, had lower high density lipoprotein levels (40.3 ± 12.2 vs 46.9 ± 12.4 mg/dL, P = 0.008), had higher cystatin C levels of serum (1.21 ± 0.42 vs 0.86 ± 0.18 mg/L, P < 0.001) and urine (0.11 ± 0.11 vs 0.06 ± 0.45 mg/L, P = 0.013) than those with eGFR ≥ 60 mL/min/1.73 m2. However, there were no significant differences in ACR.

ROC Analysis of cystatin C levels of serum and urine

ROC analyses were performed to define the diagnostic profile of the serum and urine levels of cystatin C for detecting eGFR < 60 mL/min/1.73 m2 among subjects with type 2 diabetes. The serum level of cystatin C showed an AUC of 0.906 (95% CI, 0.865-0.947) with a cutoff value of 1.06 (sensitivity, 81.0%; specificity, 87.1%). Also, the urine level of cystatin C supported the diagnostic profile, showing an AUC of 0.807 (95% CI, 0.741-0.873) with a cutoff value of 0.1 (sensitivity, 70.9%; specificity, 86.3%) (Fig. 2).

Predictive factors for eGFR < 60 mL/min/1.73 m2 in normoalbuminuric patients with diabetes

We performed logistic regression analysis with ACR, CRP, glucose, low-density lipoprotein, triglyceride, high-density lipoprotein, and the cystatin C levels of serum and urine. In normoalbuminuric patients, eGFR < 60 mL/min/1.73 m2 by the MDRD equation was related to normal cystatin C levels of serum and urine by the cutoff value that was calculated from the ROC curve. When we used the EPI-equation, the factors which we put in logistic regression were ACR, CRP, glucose, low-density lipoprotein, triglyceride, high-density lipoprotein and the urine level of cystatin C. eGFR < 60 mL/min/1.73 m2 was independently related to the lower level of high-density lipoprotein (Table 3).

DISCUSSION

In this study, we aimed at evaluating the cystatin C levels of serum and urine in a small cohort of patients with type 2 diabetes by categorizing them into 3 groups depending on their different degrees of kidney damage (normalbuminuria, microalbuminuria and diabetic nephropathy). In normoalbuminuric patients, the cystatin C levels of serum and urine were significantly increased in patients with GFR ≤ 60 mL/min/1.73 m2 than those with GFR > 60 mL/min/1.73 m2. It was thought that this increment was probably due to the tubular phase before glomerular manifestation. This suggests that the cystatin C levels of serum and urine are related to subclinical tubular impairment and can be an earlier measurable markers of renal involvement before onset of albuminuria. In these patients, the cystatin C levels of serum and urine were independent factors to predict eGFR < 60 mL/min/1.73 m2 estimated by the MDRD equation. This finding indicated that the cystatin C could be an index reflecting renal tubular epithelial cells. With the EPI equation, the decreased level of high-density lipoprotein was the only independent factor to predict eGFR < 60 mL/min/1.73 m2. This result is consistent with those of previous studies demonstrating that lipid metabolism may participate in the development of glomerular and tubular alterations, leading to nephron destruction. Our results suggest that dyslipidemia can be a risk factor for kidney damage in normoalubminuric diabetic patients. Further studies are needed to confirm these results.
Our study showed that serum cystatin C was associated with CRP, ACR and eGFR, whereas urine cystatin C was associated with TG, age, eGFR and ACR in the stepwise multiple regression analysis. A recent study has suggested the relationship between cystatin C and factors such as old age, male, overweight, CRP (12), and inflammation (13). Our results are consistent with those studies.
The routine classical evaluation of diabetic nephropathy includes appearance of microalbuminuria, decreased creatinine clearance and increased serum creatinine (14). But, it has been reported that a decline in the renal function of patients with diabetes was not always accompanied by an increased ACR (15, 16). About 20%-30% of patients with type 2 diabetes, accompanied by renal insufficiency, showed normoalbuminuria (15-20). To overcome these limitations, many clinicians additionally used creatinine in evaluating such patients. However, serum creatinine also depends on creatinine production, extrarenal elimination and tubular handling (21). Moreover, tubular involvement may precede glomerular involvement because several tubular proteins and enzymes are detectable even before the appearance of microalbuminuria and a rise in serum creatinine (22, 23). Therefore, other biomarkers for estimation of renal function have been searched for and one of them was cystatin C (24). Our study results confirmed that cystain C could be one of the additional tubular factors which represent kidney state of diabetic patients.
This study has some limitations. First, owing to the retrospective cross sectional design, it was difficult to clarify the causal relationship between the risk factors and the natural course of normoalbuminuric renal insufficiency. Moreover, the patients with normoalbuinuria and eGFR < 60 mL/min/1.73 m2 might need more evaluation such as kidney biopsy to diagnose diabetic nephropathy. Second, eGFR, estimated by the MDRD or EPI-equation, did not appear to reflect actual kidney function. So, we could not conclude that which factor is more accurate or useful. Third, the subjected patients were not asked to discontinue their medications, such as antihypertensive medications. Therefore, albuminuria might be underestimated in these patients. Nevertheless, this study has some strength. We evaluated the levels of cystatin C in both serum and urine at the same time. In addition, this study demonstrated clearly that the cystatin C levels of serum and urine were increased along with the level of albuminuria in diabetic patients.
In conclusion, the results of this study suggest that cystatin C measurement in urine and serum is a useful, practical, non-invasive tool for the evaluation of renal involvement in the course of diabetes, especially in normoalbuminuric patients. Further investigations with a larger sample size and a prospective design are required to confirm the potential application of cystatin C as a useful biomarker for the early detection of diabetic nephropathy.

Figures and Tables

Fig. 1
Cystatin C in patient groups with normoalbuminuria (NA), microalbuminuria (MA) or macroalbuminuria (diabetic nephropathy, DN). (A) Serum cystatin C. *P < 0.01 NA vs MA; P < 0.001 MA vs DN; P < 0.001 NA vs DN. (B) Urine cystatin C. *P < 0.05 NA vs MA; P < 0.01 MA vs DN; P < 0.001 NA vs DN.
jkms-26-258-g001
Fig. 2
ROC curves of cystatin C in serum and urine in reference to eGFR < 60 mL/min/1.73 m2 calculated by the MDRD equation. The AUC for was 0.906 (95% CI, 0.865-0.947) for serum cystatin C and 0.807 (95% CI, 0.741-0.873), for urine cystatin C. For serum cystatin C, the cutoff value for the identification of eGFR < 60 mL/min/1.73 m2 conducted by the MDRD equation was found to be 1.06 mg/L with a sensitivity of 81.0% and a specificity of 87.1%, whereas for urine cystatin C, it was 0.1 mg/L with a sensitivity of 70.9% and a specificity of 86.3%.
jkms-26-258-g002
Table 1
Characteristics of metabolic and laboratory parameters in patients with type 2 diabetes
jkms-26-258-i001

Data are expressed as mean ± SD for continuous variables and frequency (%) for categorical variables. P values by ANOVA and the chi-square test. ACR, albumin creatinine ratio; anti-HT Tx, anti-hypertension treatment; BMI, body mass index; CKD-EPI, Chronic Kidney Disease Epidemiology Collaboration; Cr, creatitine; CRP, C-reactive protein; DBP, diastolic blood pressure; eGFR, estimated glomerular filtration rate; FBS, fasting blood sugar; FeCyst, fractional excretion of cystatin C; HDL, high-density lipoprotein; LDL, low-density lipoprotein; MDRD, Modification of Diet in Renal Disease; RAS, renin-angiotesin system; SBP, systolic blood pressure; TG, Triglyceride.

Table 2
Baseline characteristics of 210 diabetic patients with normoalbuminuria defined by using estimated eGFR (mL/min/1.73 m2) calculated by the MDRD equation
jkms-26-258-i002

Data are expressed as mean ± SD for continuous variables and frequency (%) for categorical variables. P values were obtained by the independent sample table t test.

Abbreviations as in Table 1.

Table 3
Independent factors associated with eGFR < 60 mL/min/1.73 m2 calculated by the MDRD equation and EPI-equation in normoalbuminuric patients
jkms-26-258-i003

CKD-EPI, Chronic Kidney Disease Epidemiology Collaboration; HDL, high-density lipoprotein; MDRD, Modification of Diet in Renal Disease.

AUTHOR SUMMARY

Cystatin C as an Early Biomarker of Nephropathy in Patients with Type 2 Diabetes
Yun Kyung Jeon, Mi Ra Kim, Jung Eun Huh, Ji Young Mok, Sang Heon Song, Sang Soo Kim, Bo Hyun Kim, Soo Hyoung Lee, Yong Ki Kim, and In Joo Kim
In type 2 diabetic patients, the early detection of diabetic nephropathy has focused on the measurement of urinary albumin excretion rate, but impaired renal function may be present even in patients with normoalbuminuria. Cystatin C, a cysteine protease inhibitor, is freely filtered by the renal glomeruli, metabolized by the proximal tubule and identified as a promising marker of renal failure. In our study, the cystatin C levels of serum and urine increased with increasing degree of albuminuria, reaching higher levels in macroalbuminuric patients. Especially, in normoalbuminuric patients, serum and urine cystatin C were identified as independent factors associated with eGFR < 60 mL/min/1.73 m2 estimated by MDRD equation. The cystatin C levels of serum and urine could be useful markers for renal dysfunction in type 2 diabetic patients with normoalbuminuria.

References

1. Wild S, Roglic G, Green A, Sicree R, King H. Global prevalence of diabetes: Estimates for the year 2000 and projections for 2030. Diabetes Care. 2004. 27:1047–1053.
2. Gregg EW, Cheng YJ, Cadwell BL, Imperatore G, Williams DE, Flegal KM, Narayan KM, Williamson DF. Secular trends in cardiovascular disease risk factors according to body mass index in US adults. JAMA. 2005. 293:1868–1874.
3. Olivarius Nde F, Andreasen AH, Keiding N, Mogensen CE. Epidemiology of renal involvement in newly-diagnosed middle-aged and elderly diabetic patients. Cross-sectional data from the population-based study "diabetes care in general practice", Denmark. Diabetologia. 1993. 36:1007–1016.
4. Comper WD, Osicka TM, Jerums G. High prevalence of immuno-unreactive intact albumin in urine of diabetic patients. Am J Kidney Dis. 2003. 41:336–342.
5. Mussap M, Dalla Vestra M, Fioretto P, Saller A, Varagnolo M, Nosadini R, Plebani M. Cystatin C is a more sensitive marker than creatinine for the estimation of GFR in type 2 diabetic patients. Kidney Int. 2002. 61:1453–1461.
6. Pucci L, Triscornia S, Lucchesi D, Fotino C, Pellegrini G, Pardini E, Miccoli R, Del Prato S, Penno G. Cystatin C and estimates of renal function: searching for a better measure of kidney function in diabetic patients. Clin Chem. 2007. 53:480–488.
7. Rigalleau V, Beauvieux MC, Le Moigne F, Lasseur C, Chauveau P, Raffaitin C, Perlemoine C, Barthe N, Combe C, Gin H. Cystatin C improves the diagnosis and stratification of chronic kidney disease, and the estimation of glomerular filtration rate in diabetes. Diabetes Metab. 2008. 34:482–489.
8. Oddoze C, Morange S, Portugal H, Berland Y, Dussol B. Cystatin C is not more sensitive than creatinine for detecting early renal impairment in patients with diabetes. Am J Kidney Dis. 2001. 38:310–316.
9. Wiesli P, Schwegler B, Spinas GA, Schmid C. Serum cystatin C is sensitive to small changes in thyroid function. Clin Chim Acta. 2003. 338:87–90.
10. Myers GL, Miller WG, Coresh J, Fleming J, Greenberg N, Greene T, Hostetter T, Levey AS, Panteghini M, Welch M, Eckfeldt JH. National Kidney Disease Education Program Laboratory Working Group. Recommendations for improving serum creatinine measurement: a report from the laboratory working group of the national kidney disease education program. Clin Chem. 2006. 52:5–18.
11. Stevens LA, Coresh J, Schmid CH, Feldman HI, Froissart M, Kusek J, Rossert J, Van Lente F, Bruce RD 3rd, Zhang YL, Greene T, Levey AS. Estimating GFR using serum cystatin C alone and in combination with serum creatinine: a pooled analysis of 3,418 individuals with CKD. Am J Kidney Dis. 2008. 51:395–406.
12. Knight EL, Verhave JC, Spiegelman D, Hillege HL, de Zeeuw D, Curhan GC, de Jong PE. Factors influencing serum cystatin C levels other than renal function and the impact on renal function measurement. Kidney Int. 2004. 65:1416–1421.
13. Keller CR, Odden MC, Fried LF, Newman AB, Angleman S, Green CA, Cummings SR, Harris TB, Shlipak MG. Kidney function and markers of inflammation in elderly persons without chronic kidney disease: the health, aging, and body composition study. Kidney Int. 2007. 71:239–244.
14. Hong CY, Chia KS. Markers of diabetic nephropathy. J Diabetes Complications. 1998. 12:43–60.
15. Lane PH, Steffes MW, Mauer SM. Glomerular structure in IDDM women with low glomerular filtration rate and normal urinary albumin excretion. Diabetes. 1992. 41:581–586.
16. Tsalamandris C, Allen TJ, Gilbert RE, Sinha A, Panagiotopoulos S, Cooper ME, Jerums G. Progressive decline in renal function in diabetic patients with and without albuminuria. Diabetes. 1994. 43:649–655.
17. Kramer HJ, Nguyen QD, Curhan G, Hsu CY. Renal insufficiency in the absence of albuminuria and retinopathy among adults with type 2 diabetes mellitus. JAMA. 2003. 289:3273–3277.
18. MacIsaac RJ, Panagiotopoulos S, McNeil KJ, Smith TJ, Tsalamandris C, Hao H, Matthews PG, Thomas MC, Power DA, Jerums G. Is nonalbuminuric renal insufficiency in type 2 diabetes related to an increase in intrarenal vascular disease? Diabetes Care. 2006. 29:1560–1566.
19. Rigalleau V, Lasseur C, Raffaitin C, Beauvieux MC, Barthe N, Chauveau P, Combe C, Gin H. Normoalbuminuric renal-insufficient diabetic patients: a lower-risk group. Diabetes Care. 2007. 30:2034–2039.
20. Kramer CK, Leitão CB, Pinto LC, Silveiro SP, Gross JL, Canani LH. Clinical and laboratory profile of patients with type 2 diabetes with low glomerular filtration rate and normoalbuminuria. Diabetes Care. 2007. 30:1998–2000.
21. Stevens LA, Levey AS. Measurement of kidney function. Med Clin North Am. 2005. 89:457–473.
22. Catalano C, Winocour PH, Gillespie S, Gibb I, Alberti KG. Effect of posture and acute glycaemic control on the excretion of retinol-binding protein in normoalbuminuric insulin-dependent diabetic patients. Clin Sci (Lond). 1993. 84:461–467.
23. Uslu S, Efe B, Alataş O, Kebapçi N, Colak O, Demirüstü C, Yörük A. Serum cystatin C and urinary enzymes as screening markers of renal dysfunction in diabetic patients. J Nephrol. 2005. 18:559–567.
24. Choe JY, Park SH, Kim SK. Serum cystatin C is a potential endogenous marker for the estimation of renal function in male gout patients with renal impairment. J Korean Med Sci. 2010. 25:42–48.
TOOLS
Similar articles