

 PDF
PDF ePub
ePub Citation
 Print
Print


INTRODUCTION
Diabetes has emerged as an important social issue worldwide, particularly in Asian countries (1, 2). According to the Diabetes Atlas of the International Diabetes Federation, the prevalence of diabetes in China and Japan were estimated to be 4.5% and 7.3% in 2010 and have been forecasted to increase up to 5.8% and 8.0% by 2030, respectively (3). In Korea, the prevalence of diabetes already reached 10.0% among the adult population according to the Korean National Health and Nutrition Examination Survey (KNHANES) 2009 (4), and this is a dramatic increase since the early 1990s (1).
Type 2 diabetes is a well-known disease in which diet play an important role in etiology and management. Until now, numerous studies on the association between diet and diabetes have been reported, mainly focusing on nutrients or single food/food group intake. Regarding the quality of carbohydrate intake, low glycemic index, high fiber, and whole grain intake were reported to reduce the risk of diabetes (5-8). Calcium or magnesium intake was also reported to be inversely associated with diabetes (8, 9). Regarding food intake, fruit and vegetable intake among US adults (10) as well as dairy food intake among French adults (9) were reported to be inverse association with type 2 diabetes.
As diet is a complex exposure variable, various approaches are required to examine the relationship between diet and disease risk. The traditional approach to investigating diet-disease associations focuses on single dietary components, such as single nutrients or foods. Individuals, however, eat combinations of foods as meals instead of consuming single nutrients or foods, making it difficult to interpret the effects of dietary factors. Recently, dietary pattern analysis, which captures the overall picture of an individual's diet, has been applied to address the effects of diet on health outcomes. The two most commonly used approaches are factor analysis and cluster analysis, both of which are data-driven methods that do not depend on how the authors define a healthful pattern. Factor analysis gathers food variables based on the degree to which they are correlated with each other. Individuals have scores for each factor, which allows categorization into groups such as quartiles; on the other hand, cluster analysis aggregates individuals into groups (clusters) (11).
Recently, several studies on dietary patterns and diabetes have been reported. In one such study, a prudent dietary pattern was found to be associated with a modestly lower risk of type 2 diabetes, whereas a Western dietary pattern was associated with increased risk of type 2 diabetes in US men (6). Further, a dietary pattern low in staple foods and high in dairy milk was found to be associated with lower incidence of type 2 diabetes in the Shanghai Women's Health Study (12). A 'fat and meat' pattern was found to be associated with diabetes risk in all ethnic groups in a multiethnic cohort (13). A Westernized breakfast pattern characterized by higher consumption of bread was observed to be negatively associated with A1C concentrations in Japanese middle-aged adults, whereas a seafood dietary pattern was shown to be positively associated with Hemoglobin A1C only men (14). The Japanese dietary pattern was shown to be positively associated with impaired glucose tolerance, and a dietary pattern characterized by frequent consumption of dairy products and fruits and vegetables but low alcohol intake was found to be associated with decreased risk of developing glucose tolerance abnormalities (15).
However, there have been few studies that have examined the dietary patterns among patients with diabetes. Since dietary pattern analysis provides patterns of food consumption among target populations, it could be very useful in establishing practical dietary guidelines for diabetics. The goals of nutrition recommendations for diabetics are to achieve and maintain favorable blood glucose levels, lipid profiles, and a healthy body weight in order to prevent chronic diabetic complications.
Thus, the purpose of this study was to identify dietary patterns among adults with type 2 diabetes and explore the associations of the dietary patterns with blood lipid profiles and abdominal obesity for the purpose of lowering the risks of diabetes-associated complications.
MATERIALS AND METHODS
Study population
This study was based on data from The 4th KNHANES among non-institutionalized civilians in the Republic of Korea, which was conducted by the Korea Centers for Disease Control and Prevention. KNAHNES was a nationwide representative study using a stratified, multistage probability sampling design for the selection of household units. It was composed of three surveys; general and health-related questionnaires, health examination, and a dietary survey. The 4th KNHANES was designed as three year-round surveys and each survey had an independent sampling frame. Our data were obtained from the surveys conducted in 2007 and 2008. A total of 14,338 (4,594 in 2007 and 9,744 in 2008) individuals who had participated mainly in both the health examination and dietary survey with general questionnaires were included in this analysis. Among eligible respondents, we included the respondents to those over 30 yr of age who had completed a 24-hr recall in the dietary survey and undergone a health examination with anthropometric measurements.
Definition of diabetes
We used the definition of diabetes diagnosis from the American Diabetes Association, in which diabetes is defined as a fasting plasma glucose ≥ 126 mg/dL and/or using anti-diabetic treatments and/or physician-diagnosed diabetes. The final 680 subjects with diabetes were analyzed; 204 from the 2007 survey and 476 from the 2008 survey.
Diabetes treatment and management
Since the subjects were patients with diabetes, four variables were considered in this study regarding the treatment and management of diabetes. Duration of diabetes was determined based upon how long the patients had diabetes. Treatment was determined based on whether or not they had previously used anti-diabetic medication. For management, we used the definition of a well-controlled patient with A1C < 6.5% reflecting adequate glucose control. We also checked education of diabetes. The subjects were asked whether or not they had received education on diabetes in any setting, including at clinics, community centers, etc, and those who answered once or more were assigned as 'Yes' while others were assigned as 'No'. All of these variables were run as covariates in the models, and both variables of duration of diabetes and treatment were used in the final models.
Health examination
Height, weight, and waist circumference were obtained using standardized techniques and equipment by well-trained examiners. Body mass index (BMI) was calculated as weight divided by the square of height (kg/m2). Blood pressure was measured by standard methods using a sphygmomanometer with the patient in a sitting position. Three measurements were made on all subjects at 5-min intervals; the average of the second and third measurements was used in the analysis. Blood samples were collected in the morning after fasting for at least 8 hr. Fasting glucose, A1C, total cholesterol, HDL-cholesterol, and triglycerides were measured.
Dietary pattern analysis
In this study, dietary data from a 24-hr recall method was used. Those subjects reporting implausible energy intakes (< 700 or ≥ 5,000 kcal per day) were excluded.
To identify dietary patterns, food input variables were generated since we used quantitative dietary data based on 24-hr recall. Individual data from 24-hr recall were first categorized into common food groups based on classification in the Korean Nutrient Database. As grain and its products accounted for almost 50% of the total energy intake, four subgroups were created: white rice, other grains, noodles, and bread. This allowed us to further examine what kind of staple foods the Korean adults consumed. Among vegetables, Kimchi (traditional fermented cabbage) was separated into a single group since it is a commonly eaten traditional side dish and was helpful in identifying dietary patterns. Alcohol was also separated into a single group from the rest of the beverages. The amount of each food group was calculated, and 22 input variables were used.
We used principal components analysis, a form of factor analysis, and the number of factors was determined based on eigen values, scree test, and the interpretability of the derived factors. The obtained factors were linear combinations of the included variables, explaining as much of the variation in the original variables as possible. Four distinct dietary patterns were identified, and factor scores were obtained for each participant. Then, individuals were categorized based upon their factor scores into four groups with quartiles. The subjects in the highest quartile of a pattern were more likely to have that dietary pattern.
Other factors as potential confounders
Socio-demographic variables such as age, gender, education, region, and income were considered, and these data came from the general questionnaire in KNHANES. Education level was combined into three categories: people who had an 'elementary or lower', 'secondary', or 'college or higher' education level. Region was classified into three categories: metropolitan, city (small or middle-sized), and rural areas. For income, household income was assessed by quartiles using national standards but was regrouped into low, middle, and high, as there were few people in the second and third quartiles.
Among health-related questionnaires, smoking and physical activity were used in this study. Smoking status was assessed using the question, 'Do you smoke currently?' and dichotomized into 'Yes' and 'No'. Regarding physical activity, subjects were asked about the intensity as well as duration of exercise. Subjects who were active more than 30 min per session at moderate intensity and performed five or more sessions per week were assigned as 'Yes' for being physical active, whereas others were assigned as 'No'. All of these variables were used as covariates in the models.
Statistical analyses
All statistical analyses were conducted using SAS (release 9.1; SAS, Cary, NC, USA). Dietary patterns were identified using factor analysis based on principle components with varimax rotation (PROC FACTOR). Before factor analysis, all input variables were standardized (PROC STANDARD).
Categorical variables were compared using the chi-square test by quartiles of dietary pattern scores. Continuous variables such as age, nutrient intake, and other dietary behaviors were compared using the generalized linear model based on the quartiles of the dietary pattern scores. Covariates considered as potential confounders were age, sex, BMI, energy intake, educational level, household income, smoking, physical activity, duration of diabetes, and diabetes treatment in all models.
RESULTS
Basal characteristics of study population
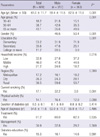
Table 1 shows the demographic characteristics of the subjects. The mean age was 61 yr, and the proportion of females was 53.4%. The proportion of those who had an elementary education level was 53.2%, residing in a rural area 56.5%, and classified as low income 32.8%. The proportion of smokers was 17.1% and of those physically active 14.1%. There were gender differences according to age, education level, income, and smoking status but not physical activity.
Regarding diabetes treatment and management, the mean duration of diabetes was 8.5 yr in this population, and the proportion of subjects who received anti-diabetic treatment was 61.2% and subjects with A1C less than 6.5% was 30.9%. For diabetes education, 191 subjects among the 489 who answered had not received instruction, but about 15.3% of the subjects had received diabetes education at least once or more. There was no gender difference according to diabetic condition.
Factor analysis and dietary patterns
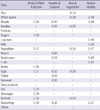
We identified four major dietary patterns by factor analysis in Korean adults with type 2 diabetes, and the factor loadings are presented in Table 2. The first factor was characterized by high consumption of breads, sugars, meats, oil, beverage, and alcohols, such that it was labeled the 'Bread & Meat & Alcohol' pattern. The second factor was characterized by high consumption of noodles, kimchi, fish, and seaweed, such that it was labeled the 'Noodle & Seafood' pattern. The third factor represented the highest loading of rice and considerable high loading of vegetables and egg, but as egg appeared in other patterns, this pattern was labeled the 'Rice & Vegetable' pattern. The last pattern was characterized by high consumption of whole grains, legumes, nuts, vegetables, mushrooms, and fruit, such that it was labeled the 'Korean Healthy' pattern.
General characteristics of subject by dietary pattern
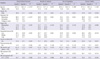
General characteristics across quartiles of the dietary pattern are shown in Table 3. Compared with diabetic subjects in the lowest quartile in the 'Bread & Meat & Alcohol' pattern, those in the highest quartile were more likely to be younger and have a higher level of education and household income. As compared to subjects in the lowest quartile of the 'Noodles & Seafood' pattern, those in the highest quartile were more likely to be younger with a higher level of education and household income. Compared with subjects in the lowest quartile of the 'Rice & Vegetables' pattern, those in the highest quartile were more likely to be male with a higher level of education. Compared with subjects in the lowest quartile of the 'Korean Healthy' pattern, those in the highest quartile were more likely to have a higher level of education and household income. Regarding health-related behaviors, currently smoking was only related to the 'Noodles & Seafood' pattern score. There was no association between physical activity and any of the dietary patterns. These results show that some of the demographic variables showed association with dietary patterns.
Regarding diabetes treatment and management, duration of diabetes, treatment, and management were not associated with any of the patterns, except the 'Bread & Meat & Alcohol' pattern. Only the proportion of those who received treatment was associated with the 'Bread & Meat & Alcohol' pattern, and those in the lowest quartile received more treatment, whereas the other variables such as duration of diabetes and management were not associated.
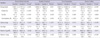
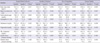
Table 4 shows nutrient intakes according to dietary pattern. Regarding nutrient intake, those in the highest quartile in all of the dietary patterns had significantly higher energy intake than those in the lowest quartile.
The percentage of carbohydrates of the total energy intake was determined for each dietary pattern, and it also affected fat and protein intake. The percent of carbohydrate intake among the highest quartiles of each dietary pattern, the highest was 72.3% in the 'Rice & Vegetables' pattern and the lowest 61.2% in the 'Bread & Meat & Alcohol' pattern. The highest quartiles of the 'Noodles & Seafood' and 'Korean Healthy' patterns were 68%-69%. On the other hand, the percent of fat intake among the highest quartile of each dietary pattern, the highest was 18.4% in the 'Bread & Meat & Alcohol' pattern and the lowest 13.4% in the 'Rice & Vegetables' pattern.
Intake of calcium, iron, and vitamin C increased across the quartiles of each dietary pattern. Among the highest quartile of each dietary pattern, calcium, iron, and vitamin C intake levels were highest in the 'Korean Healthy' pattern, whereas vitamin A intake was highest in the 'Noodles & Seafood' pattern.
Association between dietary pattern and lipid profiles
Table 5 shows obesity indices and metabolic profiles among diabetic subjects according to dietary pattern. BMI and waist circumference were not associated with any of the dietary patterns after adjusting for all potential confounders. Neither fasting blood glucose nor A1C was associated with the dietary patterns.
Regarding blood lipid profiles, serum cholesterol levels in the highest quartile of the 'Bread & Meat & Alcohol' pattern were significantly higher than those in the lowest quartile, whereas those in the highest quartile of the 'Korean Healthy' pattern were significantly lower than those in the lowest quartile. Serum triglyceride levels were slightly increased in the 'Bread & Meat & Alcohol' pattern, but this difference was not significant. On the other hand, serum triglyceride levels were significantly decreased in the 'Korean Healthy' pattern. HDL cholesterol levels were significantly increased across all quartiles in the 'Bread & Meat & Alcohol' pattern, whereas other patterns were not associated with the HDL cholesterol level.
Regarding blood pressure, including both systolic and diastolic, no dietary patterns were associated with blood pressure. Since we confirmed an association between dietary pattern and blood lipid levels, we conducted sub-analysis for subjects without lipid-lowering medicines and found a similar association.
DISCUSSION
In this study, we observed that the dietary patterns were associated with blood lipid profiles in type 2 diabetic subjects. We obtained data from 680 people with type 2 diabetes from the Forth Korean National Health and Nutrition Examination Survey (KNAHNES) and their identified dietary patterns. Even though some dietary patterns were associated with socio-demographic variables, the duration of diabetes or treatment, fasting blood glucose, and hemoglobin A1C levels, which are key variables of diabetes diagnosis and management, were not significantly different according to dietary pattern after adjusting for confounding factors. In the dietary pattern analysis, four patterns were derived: 'Bread & Meat & Alcohol', 'Noodles & Seafood', 'Rice & Vegetables', and 'Korean Healthy'. These patterns were similar to those of other studies for the adult Korean population (16, 17). Cho et al. (16) reported three dietary patterns (Western, Healthy, and Traditional) for 4,984 middle-aged Korean women, and Song and Joung (17) also reported three dietary patterns (Rice & vegetables, Meats & Alcohol, Korean Healthy) for 4,731 Korean adults using data from the third KNHANES. Even though there are methodological differences between these studies, major dietary patterns among Korean adults can be summarized into a rice-oriented pattern, rice-based but various foods-included pattern, and Westernized or meat-rich pattern. We found that diabetics also had similar dietary patterns with entire Korean population.
There have been a few studies on the dietary patterns for diabetes-related risks in Asian populations. According to a prospective Shanghai women study, a fruit-rich dietary pattern reduced total mortality and mortality caused by cardiovascular disease and diabetes, whereas a meat-rich dietary pattern increased the risk of all-cause mortality, and especially mortality caused by diabetes and colorectal cancer (18). This group also reported another study in which a dietary pattern low in staple foods and high in dairy milk was found to be associated with lower risk of type 2 diabetes (12). An additional study on Chinese subjects using national health and nutrition survey data confirmed four distinct patterns in which the prevalence of glucose tolerance abnormalities was higher in 'New Affluence' or 'Western Adopter' dietary patterns compared to traditional patterns such as 'Green Water' or 'Yellow Earth' (19).
A study on Japanese subjects reported that a dietary pattern characterized by lower intake of rice is associated with lower levels of A1C (13). Another study on Japanese men reported that a dietary pattern characterized by high intake of dairy, fruits, vegetables, and starch and low intake of alcohol is inversely associated with glucose intolerance, whereas a Japanese dietary pattern high in refined carbohydrates and low in protein is positively associated with impaired glucose tolerance (14). This implies that high carbohydrate intake accompanied by excessive rice intake is associated with risks of diabetes and cardiovascular disease in Asian populations.
There has been no study on the association of rice intake with diabetes in Korean subjects, but Park et al. (20) reported that Korean women who highly consumed carbohydrates (> 70% of energy) had a 2.5 fold higher risk of diabetes mellitus compared to normal intake (55%-70% of energy, recommended by Korean Dietary Reference Intake). In this study, both the 'Korean Healthy' and 'Noodles & Seafood' patterns showed similar carbohydrate intakes of 68%-69% of energy, however only the 'Korean Healthy' pattern had favorable effects on blood lipid profiles by lowering serum cholesterol and triglycerides. The difference was due to the composition of food items in the dietary patterns.
In terms of diet and risk of type 2 diabetes, Hu et al. (21) insisted that dietary recommendations for carbohydrate intake should focus more on quality rather than quantity alone. Anderson et al., (7) did a meta-analysis of 25 studies, which were mostly conducted on Western populations, and reported that a high carbohydrate-high fiber diet is associated with lower values for fasting and postprandial blood glucose, A1C, and blood lipid indices compared to a moderate carbohydrate-low fiber diet. This has led to a low fat-high carbohydrate diet in combination with regular exercise as the traditional recommendation for diabetes (22).
However, for Asian people, a high carbohydrate diet should be addressed with caution. According to Anderson et al., a majority of the international diabetes community supports 50%-60% of energy from carbohydrates (7). On the other hand in this study the 'Korean Healthy' pattern had 69% of energy from carbohydrates in the highest quartile, showing lower blood cholesterol and triglycerides. Thus, further studies on the specific ranges of carbohydrates as well as quality for Asian populations should be examined.
We found that the 'Bread & Meat & Alcohol' pattern was significantly associated with increased levels of total cholesterol. This pattern was also featured in another Korean study (17), in which the 'Meat & Alcohol' pattern was found to be associated with being male, middle-aged, living in a metropolitan area, currently smoking, and high fat intake. This population may have formed due to the undergoing nutrition transitions in Korea accompanied by rapid economic growth. Recently, Cho (1) claimed that a dramatic increase in gross national income in Korea since 1970 paralleled as a similar trend in the prevalence of diabetes. This rapid increase could have been the result of various artifacts rather than being the consequence of risk factors.
In this study, we found that subjects with diabetes had similar dietary patterns as the general Korean population. In addition, the 'Korean Healthy' pattern can be considered as another typical Korean pattern that includes mixed rice instead of white rice and various side dishes such as legumes, mushrooms, and fresh vegetables. According to Lewis et al. (22), people with chronic diseases generally report better nutrition awareness, but this does not consistently translate into healthy eating behaviors. Thus, more practical dietary strategies are necessary. This study would provide information for planning dietary menu for diabetes.
The strengths of the present study include a national sample with wide ranging socio-demographic and nutrient data. The use of dietary pattern analysis facilitates the interpretation of dietary variables in diabetes-related risks, and our findings may provide useful data for the development of practical dietary guidelines for diabetes management or treatment in Asian populations.
This study also has several limitations. First, the study had a cross-sectional design, which hinders any causal inferences. More observational and intervention studies are thus needed to confirm our findings and develop useful dietary strategies for the management and treatment of diabetes. Second, we defined diabetes based on the criteria of the American Diabetes Association, which may have caused some misclassification of the subjects, in particular with respect to using a single measurement of fasting blood glucose as well as self-reported treatment. This may have attenuated the association between dietary patterns and diabetes-related risks. Third, we considered treatment variables as covariates, but the information was limited since this data came from NHANES. Detailed information about the type of treatment, dose of medicine, and so on should be included in future studies.
Last, we used factor analysis to derive the dietary patterns where subjectivity in nature and reliability has been a criticism in other populations. However, similar dietary patterns were reported for other Korean populations (16, 17), and there have been several studies on the stability of dietary patterns (23, 24).
In summary, determined dietary patterns were associated with blood lipid profiles among Korean type 2 diabetes. The 'Korean Healthy' pattern is associated with favorable blood lipid profiles and consisted of grains, legumes, nuts, vegetables, and fruits. Further studies are necessary to confirm the benefits of the 'Korean healthy' pattern and develop practical dietary guideline for diabetes.
 XML Download