

 PDF
PDF ePub
ePub Citation
 Print
Print


INTRODUCTION
Obesity and depression are common disorders among Korean adults (1). They contribute to substantial morbidity and mortality (2, 3), and the management of these disorders has been a critical challenge for individual patients, physicians and the community at large (4). They can lead to many complications including cardiovascular diseases and type 2 diabetes mellitus (5, 6).
Because of their close comorbid occurrence and mutual influences, recent studies have been giving attention to the topic how obesity can be associated with depression (7). However, findings on the probable connection between obesity and depression have been inconsistent. Atlantis and Baker reported a systematic review of studies on the seeming relationship between obesity and depression with prospective cohort studies and cross-sectional studies (8). Based on their review, results of all prospective cohort studies were consistent and suggested that obesity was associated with a possible occurrence of depression. Most cross-sectional studies from the United States supported a positive association between obesity and depression in women but not in men. In contrast, most cross-sectional studies outside the United States failed to find such associations (8). In Asia, studies revealed similar results that obesity had a positive association with depression (8). However, those studies were performed only on the elderly (9-11) and they used their own criteria in diagnosing obesity and depression (10).
Several factors have been listed to explain the inconsistencies in those finding of the cross-sectional studies. The methodological differences in the diagnosis of obesity and depression among different populations need to be standardized (12). Another reason is some possible ethnic differences of the relationship between obesity and depression (9). However most existing studies on this topic were done on Western populations, and only a few studies have been conducted in Asians (10, 11).
Hence, we investigated the relationship between obesity and depression in the Korean working population in order to determine whether the association in Korean context differs from that had been conducted in previous studies.
MATERIALS AND METHODS
Study participants
This is a cross-sectional study among workers (21-75 yr of age) recruited from a nationwide sample from April to October 2005 in Korea. There were 8,121 participants from 329 companies. A random (cluster) sample of companies was taken in two stages. The first stage was a proportional selection of sample companies based on the Korean Standard Industrial Classification, while the second selection was based on company size according to three groups: companies with below 99 employees, 100 to 299, and over 300. After selecting the companies, the survey participants were subjected under the annual medical screenings until finally coming up with an adequate number of subjects proportional to the total distribution of workers in Korea.
Anthropometric measures
Just before the survey, height and weight of participants were measured during the annual medical check-up provided by their employers. Survey participants were asked to give their height and weight in the questionnaire. Body mass index (BMI kg/m2) was calculated using these two values. The subjects were then categorized into four groups according to BMI: underweight (BMI<18.5), normal (18.5≤BMI<25), overweight (25≤BMI<30), and obese (BMI>30). In the Asia-Pacific context, BMI over 25 is considered obese, but not for Europe or the Unites States, according to the World Health Organization (WHO) 2002 Criteria (13). In the present research, we used the WHO criteria in determine the relationship between obesity and depression. The WHO Expert Consultation recommended that the current WHO BMI cut-off points should be retained as the international classification because the observed risk varied according to the BMI (14).
Socio-demographic and occupational factors
Data including occupational status, monthly household income, educational level, marital status, past medical history, family history of cardiovascular disease, smoking habit, alcohol drinking, and exercise were obtained using the self-reported questionnaire.
Participants were grouped according to the following: age was categorized as below 30, 31-40, 41-50, and above 50 yr old. Educational level was classified into four groups: below middle school, below high school, below college, and above the college. Monthly household income was categorized into four groups: less than 1.25 million Korean won, 1.25 to 2.0 million, 2.0 to 3.8 million, and over 3.8 million. Marital status was divided into three groups: married, never married, and divorced, widowed or separated. Smoking habit was classified into current smoker, exsmoker and never smoked. Alcohol drinking habit was grouped as more than 5 times a week, 3-4 times, 1-2 times, less than 1 time a week, and non-drinker. Exercise status was classified as daily, 5-6 times a week, 3-4 times, less than 3 times, and never. Alcohol drinking habit and exercise status were finally dichotomized as ever (at least once a week) versus never.
Depression measure
The Korean version of the Center for Epidemiologic Studies-Depression scale (CES-D) was used to measure depression. The CES-D is a self-reported questionnaire which consists of 20 questions. Two optimal cutoff points were suggested by Cho et al. : 24/25 as the point which corresponds best to the clinical diagnosis of depression and 20/21 as the point which most effectively detects and covers depressive symptoms during screening (15, 16). A cutoff score of 21 or above is appropriate for epidemiologic purpose in a community setting and a cutoff score of 25 or above is appropriate for clinical diagnosis for depression. With a cutoff score of 25 or above, relationships with the diagnosis of major depression in a community study, which used a structured interview and the Diagnostic and Statistical Manual of Mental Disorders (DSM) criteria, led to a highest kappa value and a sensitivity of 91% (15, 16).
Survey participants with score of 25 or higher on the CES-D were classified as depressed.
Statistical analysis
Age and CES-D scores were presented as mean and standard deviation. To evaluate the relationship between various factors and depression, chi square test was used. Multivariate logistic regression analysis was used, with the BMI groups as independent variable and depression as dependant variable, to evaluate the relationship between obesity and depression. For multivariate logistic regression analysis, BMI groups were compared with normal weight group as reference. To determine probable interactions between sex, BMI groups, and depression (7, 17), a general linear model was established. We found an interaction between sex and BMI groups (P=0.017), and therefore we analyzed our data separately according to gender in multivariate logistic regression analysis. Covariates were age, educational level, monthly household income, marital status, smoking habit, alcohol drinking habit, and exercise status. The crude odds ratios (ORs) were calculated to investigate the unadjusted relationship between obesity and depression, and then two sets of models were fitted. The first model included age, monthly household income, marital status, and educational level to adjust to the well-known risk factors of depression. The second model included alcohol drinking habit and exercise status to adjust to how lifestyle factors affect depression.
RESULTS
Socio-demographic and baseline characteristics of the subjects
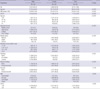
A total of 5,231 male and 2,890 female workers participated in the survey. The mean age was 38.6±9.6 yr. The mean value of the CES-D scores was 11.0±8.87. Among the total number of participants, 23.2% were overweight and 1.6% was obese. About half or 56.8% regularly exercised at least once a week. There were significant distribution difference in all the variables between male and female, except exercise status (Table 1).
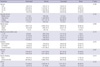
Table 2 shows the socio-demographic and baseline characteristics of the male participants. Only two variables, smoking habit and alcohol drinking habit, were statistically different between the BMI groups: there were more current smokers in the obese group and more alcohol drinkers in the overweight group. The prevalence of depression assessed by CES-D was not different between BMI groups.
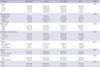
Table 3 shows that there were no statistically different variable among the female BMI groups, except for the smoking habit and the prevalence of depression.
Bivariate analyses
Based on the CES-D assessment (≥25), the prevalence of depression was 10.6% of the total, 9.7% in male and 12.3% in female. The prevalence of depression was statistically different between male and female.
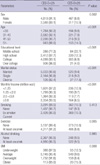
There was lower prevalence of depression in 31-40 yr old age group and those who regularly exercised. On the other hand, there was high prevalence of depression in the female, divorced, widowed or separated, and low educational level groups, and was even higher in the underweight and obese groups. Those who smoke or drink alcohol had no association with depression (Table 4).
Multivariate analyses
Compared to the normal weight women, overweight women had lower OR for depression (OR=0.62, 95% confidence interval 0.45 to 0.84), while underweight women (1.57, 0.97 to 2.54) and obese women (1.29, 0.60 to 2.77) had an insignificantly higher OR for depression. These relationships remained even after covariates were adjusted in Models 1 and 2.
Compared to normal weight men, overweight men (1.04, 0.83 to 1.31), underweight (1.24, 0.84 to 1.82) and obese (1.94, 1.03 to 3.62) had insignificantly higher ORs for depression. However, after covariates in Models 1 and 2 were adjusted, the OR of overweight men turned negative (0.93, 0.72 to 1.20 in Model 1, 0.90, 0.70 to 1.17 in Model 2), but still were not significant. The odd ratios of underweight and obese men for depression remained the same after the adjustments (Table 5).
DISCUSSION
In this study, we investigated the cross-sectional relationship between obesity and depression in Korea. Based on the Korean CES-D, the prevalence of depression in men was 8.9% and 10.9% in women. These values were lower compared to previous survey results. In the sample collected during the National Health and Health Behavior Examination Survey in Korea, the prevalence of depression as measured by the Korean CES-D (above the cutoff of 25) was 6.8% in men and 10.4% in women (18). The prevalence of depression in a study conducted in a non-institutionalized general population using DSM-IV criteria was 20.4% in men and 21.5% in women (19). Such discrepancies between our results and the previous ones might be due to methodological differences in diagnosis and the healthy worker effect.
As our multivariate analyses showed, the relationship between one's body weight and depression depended on BMI status. The overweight group revealed a negative association with depression while the obesity group showed positive association especially in women, although a similar pattern was also identified in men. The overweight women group showed an OR of 0.62, which was substantial without the adjustments. This negative association with depression remained the same after the covariates, such as age, monthly household income, educational level, smoking, alcohol drinking habits, and exercise status, were controlled. The overweight men revealed a crude OR of 1.04. For the adjusted OR in Model 2, however, this value turned into 0.90, which showed similar results with those of the women, while still an insignificant value. These results from our study were similar to those of other studies conducted in Asia (10, 11). The study conducted in China (11) revealed that the overweight women and men had a negative association with depression. In Japan, the results were quite similar with China, but the OR for women decreased with a BMI of over 26 (10). According to a recent systematic review, most cross-sectional studies conducted in the United States support a positive association between obesity (BMI over 30) and depression in women. However, most cross-sectional studies conducted outside the United States did not support such associations (8).
There are several possible explanations that support our results. First, environmental factors such as cultural background and dietary habits may have been contributing factors. East Asian countries such as Korea, China and Japan share similar cultural backgrounds and dietary habits, and their staple food is mostly rice. Carbohydrate, which is the main component of rice, is believed to be a remedy in relieving symptoms of depression through the serotonergic system and as a reason of weight gain when overeaten. Serotonin release is also involved in various functions such as in sleep onset, pain sensitivity, blood pressure regulation, and mood control. Hence, people in these countries have learned to overeat carbohydrates (particularly snack foods, like potato chips or pastries) to make themselves feel better. Second, we may also consider biological mechanisms, such as the jolly fat hypothesis. That hypothesis proposes that overweight people, both male and female, have lower risk for depression and show reduced depressive symptoms due to several possible mechanisms that may include higher consumption of certain nutrients that are helpful in reducing or preventing depressive symptoms (20, 21). They suggested the possible negative emotional effect of food deprivation. On the contrary, dietary habits such as periodic overeating of obese people may sometimes serve as protective mechanism against the experience and display of anxiety and depression (20, 21).
Although we could not draw statistical significance from our data, our results prove that the obese group is positively associated with depression in both men and women. This result is similar with the result of most cross-sectional studies from the United States, which supports a positive association between obesity and depression in women. This, however, is different from the results of most cross-sectional studies outside the United States. Also, the result of most cross-sectional studies from the United States in men failed to find such associations (8). The studies conducted in Asia, they did not separately assess a group with BMI over 30. This means, therefore, that it is difficult to compare our study with previous Asian studies (10, 11). With our analysis using the above overweight group (BMI over 25.0) (Table 3), the OR for depression in women (0.70, 0.51 to 0.97) showed similar results with the results of most cross-sectional studies outside the United States, which showed negative association with depression. Our findings are unique primarily because we separately assessed the association of overweight (25≤BMI<30) and obese (BMI>30) groups, which were defined by the WHO criteria, with depression (14).
One's genetic predisposition was also considered as an important factor that determines how obesity may be related with depression, especially in the obese group with BMI over 30 (6, 22). However, our findings suggest that environmental factors may also contribute to a positive association between obesity and depression. After adjustments were made to factor in the environment, the significance of the association between obesity and depression disappeared. The male obese group showed a statistically significant association with depression (OR=1.94), but after factoring in the monthly household income and educational level, the association became statistically insignificant. Although results from the bivariate analyses of monthly household income and educational level of obese men were not statistically different from those of other BMI groups, it becomes possible that socioeconomic factors serve as confounders. Also, body image might have negative emotional influence on our participants, because the obese population with BMI over 30 is not as prevalent (1.6%) as in other countries.
Our study has several limitations. First, the cross-sectional nature of the study limited our capacity to demonstrate a causal relationship between obesity and depression. However, any reciprocal relationships have not been previously proven; depression did not increase the risk of future obesity (23). Second, most exposures and outcome measures of the study were based on a subjective report and the self-reported questionnaire. Even though the depression was not diagnosed by a physician using DSM-IV criteria, we used a validated measure and defined depression with the cut-off point of 25, which is known to have high specificity for depression (15, 16). Height and weight were also self-reported by the participants and the BMI was calculated based on these values. Just before the participants proceeded to answer the questionnaire, their height and weight were measured objectively as their annual medical screening provided by their employers for legal purpose. This process could decrease any discrepancy between the self-reported data and the measured BMI. Third, there is a possibility of selection bias. To minimize selection bias, we recruited our subjects proportional to industrial classification and company size. However, upon including participants from their work places (24), it is hard to avoid the 'healthy worker effect'. However, as over one-third of the current adult population in Korea belongs to the working group; it is difficult to recruit subjects without the healthy worker effect. Fourth, the small sample size could lead to statistical insignificance. The proportion of obese subjects (BMI over 30) was only 1.6% of the total subjects, and this could lead to a broad confidence interval. If our study included more participants belonging to the obese group, the association of that group with depression might have resulted with much more significance. There is a possibility that being obese (BMI over 30) could also increase the risk of depression for both male and female in Korea. Further prospective studies will be needed to confirm whether indeed being overweight has a protective effect on depression in women and that being obese (BMI over 30) increases the risk of depression in Korea, as well as in other areas in Asia.
Our study also has several strengths. First, the study was based on a wide-scale, nationwide survey, which included respondents belonging within the 21-75 yr old age range. Second, we conducted multivariate analyses according to gender, which allowed us to identify gender-specific patterns of association between obesity and depression (25), and we separately assessed depression is associated with the overweight (25≤BMI<30) and obese (BMI>30) groups, which were defined by the WHO criteria. This analysis, which was based on different body weight groups, provided evidence that the association between obesity and depression may depend on the severity of obesity in Asia.
In conclusion, recently conducted studies demonstrate a significant inverse relationship between depression and being overweight in women.
 XML Download