

 PDF
PDF ePub
ePub Citation
 Print
Print


INTRODUCTION
Hypercalciuria has been known to be associated with renal stone (1, 2), hematuria (3, 4), and bone resorption (5) although long-term effects of hypercalciuria have not been fully elucidated. Thiazides have been adopted as the treatment of choice for hypercalciuria. Thiazides primarily inhibit sodium-chloride cotransporters (NCC) in the distal convoluted tubule and also reduce urinary calcium excretion (6). In addition, several reports demonstrated beneficial effects of thiazides on bone mineral density and fracture (7-9).
The amount of urinary calcium excretion is determined by subtracting reabsorbed calcium from filtered calcium. Most of the filtered calcium is reabsorbed passively in the proximal tubule (PT) and the thick ascending limb (TAL) via paracellular pathway driven by sodium and water reabsorption (10). And less than 15% of calcium is actively reabsorbed in the distal convoluted tubule (DCT) (11).
There are several causes of hypercalciuria, including high salt or calcium diet and vitamin D administration. We previously reported that the down-regulation of transient receptor potential vanilloid 5 (TRPV5), sodium-hydrogen exchanger 3 (NHE3), sodium-glucose cotransporter 1 (SGLT1), and sodium-potassium-chloride cotransporter type 2 (NKCC2) is associated with hypercalciuria and that thiazides decreased calcium excretion by 50% in hypercalciuric rats induced by high salt or high calcium diet (12). It has not been reported whether thiazides have a constant hypocalciuric effect under different settings of hypercalciuria. We postulated that the degree of the hypocalciuric effect of thiazides and the changes of transporters by thiazides would be different depending on the physiologic stimuli inducing hypercalciuria. In this study, severe hypercalciuria was induced by high calcium diet and intraperitoneal injection (ip) of vitamin D3. Vitamin D3 has been known to enhance active calcium absorption in the small intestine and also stimulate calcium reabsorption in the kidneys (13-15).
We assessed the hypocalciuric effect of thiazides and the changes of major transporters regulating urinary calcium excretion in hypercalciuric rats induced by high calcium diet and vitamin D3. To assess the effect of thiazides on the transporters participating in the passive and active calcium reabsorption under severe hypercalciuric condition, the expression of NHE3 and SGLT1 on the PT, NKCC2 on the TAL, and TRPV5 and calbindin-D28K on the DCT was analyzed.
MATERIALS AND METHODS
Experimental protocols and measurement of physiologic variables
All studies were approved by Seoul National University Hospital Animal Care and Use Committee (IACUC No. 06-018). The experiments were performed between March 2006 and February 2007.
In experiment 1, twenty specific pathogen-free male Sprague-Dawley rats (5-6 weeks, 160-180 g; SLC, Shizuoka, Japan) were randomly allocated into 4 different groups: the control group, high calcium diet group, vitamin D group, and high calcium diet with vitamin D group, to find the experimental condition inducing severe hypercalciuria and the adequate dosing schedule of vitamin D3. High calcium diet was given to the high calcium diet group and the high calcium diet with vitamin D group throughout the study period. In the vitamin D group and the high calcium diet with vitamin D group, 0.05 µg of vitamin D3 (calcitriol; 1,25-[OH]2-D3, Yuyu Pharma, Seoul, Korea) was injected intraperitonealy on day 4. Urine samples were collected on day 0, 4, 5, and 7.
In experiment 2, after confirming the effect high dose vitamin D on urine calcium excretion, twenty specific pathogen-free male Sprague-Dawley rats (5-6 weeks, 160-180 g; SLC) were placed in separate metabolic cages 3 days before the beginning of the study. Rats were randomly allocated into 4 groups: the control (N) group, the HCTZ (hydrochlorothiazide, T) group, the high Ca (calcium diet)-vitamin D (CD) group, and the high Ca-vitamin D with HCTZ (CDT) group. All rats were provided with a daily, fixed amount of finely ground regular rat chow (14.7 g/200 g of body weight per day). Drinking water containing 0.8% NaCl and 0.1% KCl was also provided to prevent volume depletion. On day 0, osmotic mini-pumps (model 2ML1, Alzet, Palo Alto, CA, USA) were subcutaneously implanted to all rats under anesthesia with enflurane (Choongwae Pharma, Seoul, Korea). To induce hypercalciuria, rats in the high Ca-vitamin D group and the high Ca-vitamin D with HCTZ group were provided with rat chow containing 0.74 mM of CaCO3 (Sigma, St. Louis, MO, USA) per gram of chow. Rats in the control group and the HCTZ group were provided with regular rat chow containing a 0.05 mM NaCl and 0.22 mM CaCO3 per gram. On days 0 and 4, 0.05 µg of vitamin D3 (calcitriol; 1,25-[OH]2-D3) was injected intraperitonealy to the high Ca-vitamin D group and the high Ca-vitamin D with HCTZ group. From day 0 to day 6, 7 mg of HCTZ dissolved in 1.7% ethanolamine was infused every day through the osmotic mini-pump to the HCTZ group and the high Ca-vitamin D with HCTZ group, whereas 1.7% ethanolamine of equal volume was infused to the control group and the high Ca-vitamin D group during the same period. On day 6, all rats were killed after bilateral nephrectomy and blood sampling under anesthesia using ethyl carbamate.
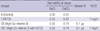
Study protocol is summarized in Table 1. Body weight, water intake, and urine volume were measured daily. Urinary calcium, sodium, and creatinine were measured using the first and last 24-hr urine. Calcium excretion was expressed as the ratio between calcium and creatinine. Serum sodium level and hematocrit were also measured. Quantitative real-time PCR and semiquantitative immunoblotting were performed with the renal tissue samples obtained from experiment 2.
Quantitative real-time RT-PCR
Total RNA was isolated from left kidney using TRIzol® reagent (Invitrogen, Carlsbad, CA, USA). First-strand cDNA (complementary DNA) was reverse-transcribed from RNA using the PCR machine (PTC-200 Peltier Thermal Cycler, MJ RESEARCH, Watertown, MA, USA) and the Reverse Transcription System (Promega Corporation, Madison, WI, USA) according to the manufacturer's protocols.
Quantitative real-time PCR was performed with 1 µL of cDNA and master mix containing 10 µL of TaqMan® 2×PCR Master Mix (Applied Biosystems, Branchburg, NJ, USA), 8 µL nuclease-free water, and 1 µL of probe and primer sets for TRPV5, calbindin-D28K, sodium-hydrogen exchanger 3 (NHE3), sodium-glucose cotransporter 1 (SGLT1), sodium-potassium-chloride cotransporter type 2 (NKCC2), and sodium-chloride cotransporter (NCC) (all from Applied Biosystems, Branchburg, NJ, USA) using the Applied Biosystems 7500 Fast Real-Time PCR System (Applied Biosystems, Foster City, CA, USA). Glyseraldehyde-3-phosphate dehydrogenase (GAPDH) was used as a house keeping gene. Relative quantification was assessed according to the protocols of the Applied Biosystems 7500 Fast Real-Time PCR System.
Semiquantitative immunoblotting
The kidneys were dissected into small pieces and placed in a chilled isolation buffer containing 0.3 M sucrose, 10 mM triethanolamine (Sigma), 1 µg/µL leupeptin (Sigma), and 0.1 mg/µL phenylmethylsulfonylfluoride (Sigma) titrated to pH 7.6. Then the pieces were homogenized at 15,000 rpm with three stokes for 15 sec with a tissue homogenizer (PowerGun 125, Fisher Scientific, Pittsburgh, PA, USA). After homogenization, total protein concentration of the homogenate was measured by Bicinchoninic acid protein assay method (BCA Reagent Kit; Sigma) and diluted to 2.50 µg/µL using the isolation buffer solution. The samples were then stabilized by heating to 60℃ for 15 min after adding 1 volume of 5×Laemmli sample buffer/4 volumes sample.
Initially, "loading gels" were done on each sample set to calculate the exact loading amount that would guarantee equal loading on subsequent immunoblots. Ten micrograms of protein from each sample were loaded into each individual lane and electrophoresed on 12% polyacrylamide-SDS minigels by using Mini-PROTEIN III electrophoresis apparatus (Bio-Rad, Hercules, CA, USA) and then were stained with Coomassie blue dye (0.025% solution made in 4.5% methanol and 1% acetic acid; G-250, Bio-Rad). Selected bands from these gels were scanned with image analyzer (Vilber Lourmat, Marne la Vallée, France) to semiquantitatively determine density with LabWorks version 4.5 software (Ultra-Violet Products, Cambridge, UK) and relative amounts of protein loaded in each lane. Protein concentrations were corrected to reflect these measurements by repeating the process as described above.
For semiquantitative immunoblotting, the proteins electrophoresed on gels were transferred from unstained gels to nitrocellulose membrane (Bio-Rad) using the electroelution method. After being blocked with 5% skim milk in PBS-T (80 mM Na2HPO4, 20 mM NaH2PO4, 100 mM NaCl, and 0.1% Tween-20, pH 7.5) for 30 min, membranes were probed overnight at 4℃ with the respective primary antibodies. Affinity-purified immunoglobulin against TRPV5 (Chemicon International, Temecula, CA, USA) and affinity-purified polyclonal antibodies for calbindin-D28K (Alpha Diagnostic International, San Antonio, CA, USA) were used. The affinity-purified polyclonal antibodies against NKCC2 and NCC were provided by Dr. HM Kwon (University of Maryland, Baltimore, MD, USA), and the antibodies against NHE3 were provided by Dr. MA Knepper (NIH, Baltimore, MD, USA). Affinity-purified polyclonal antibodies against SGLT1 (Chemicon International) were also used. For probing blots, all primary antibodies were diluted into a solution containing 150 mM NaCl, 50 mM sodium phosphate, 10 mg/dL sodium azide, 50 mg/dL Tween 20, and 0.1 g/dL bovine serum albumin (pH 7.5). Then, the membranes were cleaned with PBS-T and probed with secondary antibodies for 1 hr at room temperature. The secondary antibody was horseradish peroxidase-conjugated donkey anti-rabbit IgG (31458; Pierce, Rockford, IL, USA) diluted to 1:3,000 except for calbindin-D28K. The secondary antibody for calbindin-D28K was horseradish peroxidase-conjugated rabbit anti-mouse IgG (31452; Pierce) diluted to 1:5,000. Antibody-antigen reaction sites were viewed with enhanced chemiluminescence system (ECLTM RPN 2106; Amersham Pharmacia Biotech, Buckinghamshire, UK) before exposing to radiography films (Hyperfilm, Amersham Pharmacia Biotech). Band density was measured by densitometry with LabWorks version 4.5 software (Ultra-Violet Products Cambridge, UK) and calculated as a value relative to the average value of the control group.
Statistical analysis
All values are expressed as mean±standard deviation (SD). Mann-Whitney U-test and one-way ANOVA (SPSS software; SPSS Inc., Chicago, IL, USA) were used to compare groups. Band density of immunoblots was standardized by dividing it with the average value of the control group. Thus the mean for the control group was defined as 100%. A P value <0.05 was considered statistically significant.
RESULTS
Urinary excretion of calcium
All rats ate all of the offered rat chow and showed a steady increase in body weight throughout the study period.
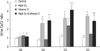
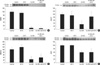
In experiment 1, the greatest level of hypercalciuria was found in the high Ca-vitamin D group (Fig. 1). Vitamin D was injected in the vitamin D group and the high Ca-vitamin D group on day 4. Urine Ca/Cr ratio of the vitamin D group and the high Ca-vitamin D group significantly increased on day 5, but decreased on day 7 compared to day 5, but not compared to day 4.
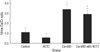
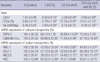
In experiment 2, urine Ca/Cr on day 0 was not different among groups (control vs. HCTZ vs. high Ca-vitamin D vs. high Ca-vitamin D with HCTZ, 0.9±0.18 vs. 0.7±0.32 vs. 0.7±0.12 vs. 0.9±0.33). Changes in body weight, hematocrit, and serum sodium and creatinine concentration did not differ among groups (Table 2). Urine Ca/Cr and sodium levels are summarized in Table 3. On day 6, urine Ca/Cr was significantly increased in the high Ca-vitamin D group (Fig. 2). In the high Ca-vitamin D with HCTZ group, urine Ca/Cr was decreased to about 85% of the high Cavitamin D group (control vs. HCTZ vs. high Ca-vitamin D vs. high Ca-vitamin D with HCTZ, 1.1±0.46 vs. 0.5±0.19 vs. 3.4±0.48 vs. 2.9±0.59).
Results of mRNA expression
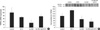
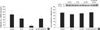
Expression of TRPV5 and calbindin-D28K mRNA significantly decreased in the high Ca-vitamin D group, which increased when HCTZ was administered (Figs. 3, 4). Expression of NHE3, SGLT1, and NKCC2 mRNA was significantly decreased in the high Ca-vitamin D group, which increased when HCTZ was administered. mRNA expression results are summarized in Table 3.
Protein abundance using semiquantitative immunoblotting
Immunoblotting for TRPV5 revealed a significant decrease of protein abundance in both high Ca-vitamin D and high Ca-vitamin D with HCTZ groups (band density [%]; control vs. HCTZ vs. high Ca-vitamin D vs. high Ca-vitamin D with HCTZ, 100.0±19.36 vs. 148.2±5.62 vs. 71.3±16.16 vs. 49.8±15.00; Fig. 3). Protein abundance of calbindin-D28K showed no difference among groups (band density [%]; control vs. HCTZ vs. high Ca-vitamin D vs. high Ca-vitamin D with HCTZ, 100.0±3.69 vs. 88.0±8.23 vs. 95.0±7.29 vs. 102.3±20.70; Fig. 4). Protein abundance of NHE3, NKCC2, and NCC was decreased in the high Ca-vitamin D group and was not changed by HCTZ. In the high Ca-vitamin D with HCTZ group, HCTZ increased protein abundance of SGLT1 which was decreased in the high Ca-vitamin D group (Fig. 5).
DISCUSSION
In our experiment, high calcium diet and vitamin D3 decreased protein abundance of TRPV5, NHE3, SGLT1, and NKCC2, resulting in severe hypercalciuria and the expression of TRPV5, NHE3, and NKCC2 was not restored by HCTZ administration. These results support that hypercalciuria is caused by dysregulation of several stages of calcium transportation in the kidneys (16) and the hypocalciuric effect of HCTZ is attenuated in severe hypercalciuric condition induced by high calcium diet and vitamin D3.
Several previous reports described the regulation of TRPV5 and TRPV6 by vitamin D3 (15, 17-20) and estrogen (17, 21). Hoenderop et al. reported that TRPV5 is an important target of active vitamin D3 and is positively controlled by vitamin D3 through experiments using vitamin D-deficient diet (15) and 25-hydroxyvitamin D3-1α-hydroxylase knockout mice (19). Renkema et al. showed that hypervitaminosis D plays a crucial role in maintaining normocalcemia in TRPV5 knockout mice (20). In this study, male rats were used to minimize the effect of estrogen on TRPV5 expression and high calcium diet with vitamin D was administered to elucidate the effect of supraphysiologic vitamin D3 on the hypocalciuric effect of thiazide. High calcium diet was used to ascertain that all rats have the same concentration of 1,25-(OH)2-D3 after calcitriol ip, because high calcium diet itself would suppress the endogenous production of vitamin D3 and abolish the blood level variation of endogenous vitamin D3 (22). Under physiologic conditions, increased calcium is regulated via a negative feedback mechanism that eventually leads to suppression of 1α-hydroxylase activity which in turn decreases calcium reabsorption and expression of calcium transport proteins (17).
When high calcium diet and supraphysiologic vitamin D3 were administered concomitantly, severe hypercalciuria was induced and TRPV5 expression was suppressed in protein levels. Concomitant administration of high calcium diet and vitamin D3 also decreased protein abundance of NHE3, SGLT1, NKCC2, and NCC. This suggests that both active calcium reabsorption via TRPV5 and passive calcium reabsorption driven by solvent drag via sodium transporters are impaired in severe hypercalciuric condition induced by high calcium and vitamin D3.
Our study revealed a different hypocalciuric effect of thiazide with regard to various physiologic conditions. In the HCTZ group, HCTZ increased protein abundance of TRPV5 and decreased urinary calcium excretion by 51.4% compared to the control group. However, in the high Ca-vitamin D with HCTZ group, HCTZ decreased urinary calcium excretion by 15% compared to the high Ca-vitamin D group and did not affect the protein abundance of TRPV5. HCTZ increased the protein abundance of TRPV5 and subsequently decreased urinary calcium excretion by 50% in the hypercalciuric rats induced with high calcium diet in our previous study (12). The amount calcium in the high calcium diet was the same in our current and previous studies. Therefore, the administration of high dose vitamin D3 seems to attenuate the hypocalciuric effect of HCTZ by inducing persistent down-regulation of TRPV5.
There have been several distinct hypotheses concerning the hypocalciuric effect of HCTZ. Nijenhuis et al. suggested that extracellular volume contraction was a critical determinant of HCTZ-induced hypocalciuria and the expression of Ca2+ transporters was decreased under the HCTZ treatment, which is not concordant with our results (23). However, much higher dose of HCTZ compared to the dose of HCTZ in our study was utilized in their study and high dose of HCTZ might reduce distal convoluted tubule (DCT) density itself resulting in the decrement of Ca2+ transporters because a similar dose of HCTZ was reported to induce apoptosis in the DCT cells (24). There was a report showing that enhanced passive calcium reabsorption is more important for HCTZ-induced hypocalciuria than active calcium reabsorption using TRPV5 knockout mice (25). Lee et al. proposed that HCTZ induces hypocalciuria through different mechanisms depending on volume status (26). They reported that HCTZ-induced hypocalciuria seems to be achieved through the increased expression of TRPV5 under euvolemic condition and this is consistent with our previous report. In our previous report, we suggested that TRPV5 is a critical determinant of the hypocalciuric effect of chronic HCTZ treatment (12). There were also a report demonstrating the essential role of TRPV5 in calcium homeostasis using TRPV5-null mice (27), and another report showing that the gatekeeper function of TRPV5 is the rate-limiting step in active calcium reabsorption using single- and double-knockout mice lacking TRPV5 and calbindin-D28K (28).
Our current data showed that HCTZ did not affect protein abundance of TRPV5 in high calcium diet and vitamin D-induced severe hypercalciuric rats, resulting in small reduction of urinary calcium excretion. In this study, the rats were provided with drinking water containing 0.8% NaCl and 0.1% KCl to prevent volume depletion, and measured data such as weight gain, hematocrit, and serum sodium concentration showed no difference among groups, reflecting a comparable volume status. Our results imply that the attenuation of HCTZ's hypocalciuric effect is caused by persistently decreased protein abundance of TRPV5 after HCTZ administration in high calcium diet and vitamin D-induced hypercalciuric rats. And increased protein abundance of SGLT1 by HCTZ seems to be responsible for the small reduction of urinary calcium excretion.
There were some discrepancies between mRNA expression and protein abundance of transporters, probably resulting from negative feedback by protein abundance, post-transcriptional mechanisms, or from the time difference between mRNA expression and protein production. We performed a preliminary study with immunohistochemistry of NKCC2 and NCC and there was no difference in the expression of NKCC2 and NCC between groups. These discrepancies between protein abundance measured with immunoblotting and immunohistochemistry may be due to the difference in sample preparation, since immunoblotting was performed with protein samples made from whole kidney tissue whereas immunohistochemistry was performed on a piece of renal section.
In conclusion, we demonstrated that concomitant administration of high calcium diet and high dose vitamin D3 induces severe hypercalciuria by decreasing protein abundance of TRPV5 and major sodium transporters participating in passive calcium reabsorption. We also revealed that the hypocalciuric effect of HCTZ is attenuated in high calcium diet and vitamin D-induced hypercalciuric rats, probably caused by persistently decreased TRPV5 protein abundance. Our data suggest that the hypocalciuric effect of HCTZ may vary depending on the type of physiologic stimuli.

 XML Download