

 PDF
PDF ePub
ePub Citation
 Print
Print


INTRODUCTION
Decreased tissue response to insulin, a characteristic of type 2 diabetes, occurs early in the development of this disease. Although many studies have been conducted, both in vitro and in vivo on insulin resistance, the factors causing this condition still remain unclear. However, it is likely that both genetic and environmental factors, such as diet and physical activity, are involved (1). Dietary factors, such as high-fat or high-sucrose diets, have been implicated in the development of hepatic and peripheral tissue insulin resistance in rats (2, 3). More recently, the composition of these diets has been considered as an important factor in the impairment of insulin action. It is classically assumed that refined sucrose per se causes and exacerbates insulin resistance, whereas equal amount of starch does not. High-sucrose fed rats have been known to be more resistant to insulin than are high-starch fed animals, due to the effects of a high-sucrose diet on the liver, which becomes markedly resistant to the suppression of glucose production by insulin (4). This has been determined in a series of hyperinsulinemic euglycemic clamp studies (5-7). The marked decrease in insulin-stimulated muscle 2-deoxyglucose (DG) uptake was also shown in rats fed on a high sucrose diet, as compared to rats fed a high-starch diet, when both groups received a bolus injection of 2-DG during a hyperinsulinemic clamp (8). In contrast, there was little or no difference in skeletal muscle 2-DG accumulation between high-sucrose and high-starch groups in other study, using very similar diets and methodology (4). Thus, the effect of carbohydrate composition on insulin resistance has not been clearly determined yet. Rodents fed a high-fat diet rapidly developed impaired intracellular glucose metabolism within 4 weeks (9). These animals also showed visceral obesity, whole-body and skeletal muscle insulin resistance, hyperinsulinemia, hyperglycemia, and hyperlipidemia (10-12). Some scientists reported that the types of fat in a diet may affect insulin resistance in animals (13, 14). Of particular interest in this regard is a study demonstrating that the administration of fish oil results in the reversal of insulin resistance induced by high-fat feeding in rats (3, 15).
These reports suggested that differently composed diets may induce insulin resistance in different ways; however, the direct effects of these diets on insulin resistance in specific tissues, particularly skeletal muscles are not clear. In this study, therefore, we assessed insulin resistance using in vitro skeletal muscles to evaluate: 1) whether the compositions of carbohydrate or fat in diet differentially affect insulin resistance in skeletal muscles; 2) if so, what are the related factors; and 3) what is a more conclusive factor among dietary compositions and calorie intake in the development of insulin resistance?
MATERIALS AND METHODS
Materials
The 2-DG was obtained from American Radiolabeled Chemicals (St. Louis, MO, USA); and D-[1-14C]mannitol was obtained from NEN Life Science Products (Boston, MA, USA). Insulin was purchased from Novo Nordisk (Seoul, Korea). All other reagents were obtained from the Sigma Chemical Company (St. Louis, MO, USA).
Animal experiments
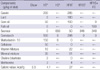
Male (~50 g) Sprague-Dawley rats were used in this study. Experiments were designed to evaluate the effect of; 1) compositional change in the diet of carbohydrate on muscle insulin resistance, 2) increased sucrose content in the diet of carbohydrate on muscle insulin resistance induced by high-fat diet, and 3) compositional change in the diet of fat on muscle insulin resistance induced by high-fat high-sucrose diet. Therefore, three independent experiments were conducted and each experiment included chow diet group as control. Rats were fed following diets: rat chow, high-starch (HT), high-sucrose (HS), high-fat high-starch (HFHT), high-fat high-sucrose (HFHS), and HFHS with fish oil (HFHS+FO) diets, for a period of 4 weeks. The same diet formulas were used as described in previous studies (3, 7) and the details of the composition of diets are presented in Table 1. Animals had free access to food and water. The body weight of each animal was recorded once a week and the calorie intake was assessed twice a week. Access to food was discontinued after 6:00 PM on the day prior to the experiment. Rats were anesthetized by intraperitoneal injections of pentobarbital sodium (50 mg/kg body weight), and blood samples were drawn from the tail vein to measure the concentrations of glucose, insulin, and triglyceride in plasma. Then, the epitrochlearis and soleus muscles were excised to examine the insulin resistance of fast-twitch white and slow-twitch red muscles. Before incubation, the soleus muscle was split longitudinally into strips, each having an average weight of 20-25 mg. After muscle dissection, the epididymal, mesenteric and retroperitoneal fat-pads were excised and weighed to measure visceral fat mass. We certify that all applicable institutional and governmental regulations concerning the ethical use of animals were followed during this research and approved by Animal Care and Use Committee of Yeungnam University (Protocol number YUMC-2005-005).
Measurement of 2-DG transport activity
In order to allow recovery from the dissection and splitting procedures, muscles were incubated for 30 min at 35℃ in a shaking incubator, in 2 mL of oxygenated Krebs-Henseleit buffer (KHB), supplemented with 8 mM glucose, 32 mM mannitol, and 0.1% bovine serum albumin (BSA). After a 30 min recovery period, the epitrochlearis muscles and soleus strips were incubated for 60 min at 35℃, in 2 mL of oxygenated KHB containing 8 mM glucose, 32 mM mannitol, and 0.1% BSA, in the presence or absence of a maximally effective concentration of insulin (2 mU/mL) before the measurement of 2-DG transport activity. The muscles were incubated at 30℃ for 20 min in 2 mL KHB, containing 4 mM 2-[1,2-3H]-DG (1.5 Ci/mL), 36 mM [14C] mannitol (0.2 Ci/mL), 0.1% BSA, and insulin if it had been present in the previous incubation. Extracellular space and intracellular 2-DG concentration (mol/mL intracellular water/20 min) were determined according to the technique described previously (16).
Analytical procedures
Glucose concentration was determined in plasma obtained from the tail vein, using the glucose oxidase method, with a YSI Glucose Analyzer. Plasma insulin and leptin were measured via radioimmunoassay. Serum triglyceride concentrations were measured using a kit obtained from the Sigma Chemical Co. (St. Louis, MO, USA).
Statistical analysis
Values are expressed as means±SE. The significance of differences among groups was evaluated by one-way analysis of variance (ANOVA). When ANOVA revealed significant differences, post-hoc analysis was conducted via the Newman-Keuls multiple range test. Differences with P values <0.05 were considered statistically significant.
RESULTS
Roles of diet composition and calorie intake in high-carbohydrates diet
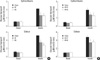
It has been classically assumed that refined sucrose per se causes and exacerbates insulin resistance, whereas an equal amount of starch does not. These effects of carbohydrate composition, however, are controversial. Therefore, we first compared the effects of HT and HS diet on insulin action. Table 2 shows the body weight and calorie intake of rats in each group after 4 weeks: fed chow, HT, and HS diet. Body weights in the HT and HS groups were not found to be significantly different from the chow diet group, in spite of ~8% higher (P<0.01) total calorie intakes in the HT and HS groups than in the chow diet group. To determine the effects of these diets on insulin action, the insulin-stimulated glucose transport rates in the epitrochlearis and soleus muscles in vitro were measured using 2-DG as a tracer. Both HT and HS diets resulted in the significant (P<0.01) reduction of the insulin-stimulated glucose transport rate by ~40% in the epitrochlearis muscle as compared with the chow diet group (Fig. 1A). Similarly, HT and HS diet significantly reduced (P<0.01) the glucose transport rate in the soleus muscle by ~30% and ~35%, respectively (Fig. 1A). These results show that both HT and HS diets induce insulin resistance in the epitrochlearis and soleus muscles, and there is no significant difference in the glucose transport rate between HT and HS diet groups.
We next examined whether the HT and HS diets in the presence of high fat differentially affect insulin action. Rats were fed chow, HFHT and HFHS diet for 4 weeks. Body weights were not found to be significantly different among all groups in spite of ~8% higher (P<0.01) calorie consumption in the HFHT and HFHS groups, as compared with the chow diet group (Table 2). The HFHT and HFHS diets resulted in the reduction (P<0.01) of insulin-stimulated glucose transport rates in the epitrochlearis by 30% and 35%, respectively, as compared with the chow diet group. As for the soleus muscle, there was ~25% reduction (P<0.01) (Fig. 1B). These results suggest the development of insulin resistance in the epitrochlearis and soleus muscles by the HFHT and HFHS diets. However, the effect of HFHS diet on insulin action was not significantly different from that of HFHT diet. Therefore, these results indicate that sucrose per se had no effect on insulin-stimulated muscle glucose transport compared with the starch regardless of the presence or absence of high fat in diet. These results suggest that calorie intake may be a more important factor in inducing insulin resistance of skeletal muscles rather than carbohydrates composition in diet.
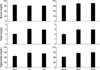
Next, we analyzed visceral fat accumulation and blood variables in the HT, HS, HFHT, and HFHS diet groups to identify the related factors in causing insulin resistance. The visceral fat pad mass represents the total of epididymal, mesenteric and retroperitoneal fat-pad mass. The percentage of visceral fat pad mass to body weight in the HT, HS, HFHT, and HFHS groups were significantly (P<0.01) increased to 137, 131, 167, and 170%, respectively compared with the chow diet group (Fig. 2). Plasma glucose concentrations also significantly increased in HFHT and HFHS groups compared to chow group whereas these values were not significantly different among chow, HT and HS groups (Fig. 3). Plasma insulin concentrations were significantly (P<0.01) elevated to ~150% in all these four groups compared with the chow diet group (Fig. 3). Plasma triglyceride concentrations also significantly (P<0.01) increased in all HT, HS, HFHT, and HFHS groups to 128, 122, 127 and 135%, respectively (Fig. 3). These results indicate that visceral fat mass, plasma insulin and triglyceride concentrations may be related to the induction of muscle insulin resistance in rats fed high-carbohydrates with high calorie intake.
Roles of diet composition and calorie intake in high-fat diet
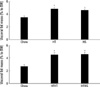
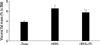
To confirm the supposition that fat composition may affect insulin resistance, we conducted another series of experiments. Rats were fed chow, HFHS, or HFHS+FO diets. Body weights among all groups were not found to be significantly different, in spite of ~11% higher (P<0.01) calorie intake in the HFHS and HFHS+FO diet groups than in the chow diet group (Table 3). The HFHS diet group showed a marked reduction (P<0.01) in insulin-stimulated glucose transport by ~30% and ~40% in the epitrochlearis and soleus muscles, respectively. The addition of fish oil to the diet partially improved (P<0.05) these values (Fig. 4), suggesting that fat content in the diet may indeed alter the degree of insulin resistance in skeletal muscles.
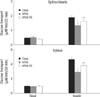
As shown earlier, HFHS diet significantly increased (P<0.01) visceral fat accumulation by ~170% compared with the chow diet group, and the addition of fish oil reduced (P<0.01) this value to 150% (Fig. 5).
Plasma glucose concentrations were found to be rather similar among groups, whereas plasma insulin concentration increased (P<0.01) to ~170% in HFHS diet group, and this value decreased (P<0.05) to ~140% with FO in the diet (Fig. 6). Plasma triglyceride concentration was also elevated (P<0.01) by 30% in the HFHS group, and FO supplement reversed (P<0.01) this increase (Fig. 6). These data suggest that fat composition, visceral fat mass, plasma triglyceride, and plasma insulin concentrations may be relevant to the induction of muscle insulin resistance in rats fed high-fat with high calorie intake.
DISCUSSION
Consistent with the previous studies (5, 8), our present results demonstrated that rats fed high-sucrose or high-starch diets exhibited similar body weight gains and visceral fat accumulation. This is fairly unsurprising as these diets were designed to have equal caloric densities and animals took similar amount of calorie from these diets during this study. Both the high-sucrose and the high-starch fed rats accumulated ~35% more visceral fat in 4 weeks than the chow-fed controls. This difference is likely due to the lower caloric density of the chow diet, which resulted in -8% lower average energy intake. In contrast, recent study (17) showed that high-sucrose diet group gained significantly higher body weight and visceral fat compared with high-starch diet group in spite of equal calorie densities of these diets. In that study, however, the calorie intake in high-sucrose group was also significantly higher than in high-starch group. Therefore, these data suggest that the amount of calorie intake may an important determining factor in the accumulation of visceral fat.
We also showed that both the high-sucrose and high-starch diets induced resistance to insulin stimulated glucose transport in skeletal muscle with a similar degree, but the reduction of glucose transport rate in these diet groups was significant as compared to chow diet group. Furthermore, this study provides evidence that highly refined high-sucrose and high-starch diets exert similar effects with regard to plasma insulin and triglyceride concentrations.
Next, we examined whether sucrose per se has detrimental effect on high-fat diet induced insulin resistance. The rats fed with high-fat high-sucrose diet exhibited similar body weight gains and visceral fat accumulation compared with high-fat highstarch diet. Both high-fat high-sucrose and high-fat high-starch fed groups accumulated ~70% more visceral fat over 4 weeks than the chow-fed controls. This difference is most likely attributable to the lower caloric density of the chow diet, which resulted in a ~8% lower average energy intake and a higher energy expenditure. Muscles in both the high-fat high-sucrose and high-fat high-starch groups were severely insulin-resistant, as compared to those observed in the chow fed animals. However, there was no difference in this regard between the high-fat high-starch and high-fat high-sucrose groups. Our results also exhibited that both high-fat high-sucrose and high-fat high-starch diets have similar effects on plasma glucose, insulin and triglyceride concentrations in rats. In agreement with our results, a recent study reported that insulin resistance assessed by hyperinsulinemic euglycemic clamp and plasma glucose, insulin, and triglyceride concentrations in healthy humans was not significantly different between two high sucrose diet groups received 25% and 10% of total energy intake from sucrose (18). In other animal studies, in which rats were pair-fed isocaloric high-sucrose and high-starch diets, the high sucrose-fed male rats exhibited significantly more hepatic and peripheral insulin resistance than did high-starch fed animals, when evaluated by hyperinsulinemic euglycemic clamp procedures (2, 5, 6). These differences among the results obtained by human and animal studies including ours might be due to, in part, the different calorie densities of sucrose in the diet (19) or different methodology employed to detect insulin resistance such as in vivo hyperinsulinemic clamp versus in vitro model. Since high-sucrose and high-starch diets induce similar degrees of insulin resistance in muscle, it seems reasonable to conclude that the additional inhibitory effects induced by high-sucrose diets on glucose transport must be mediated by other mechanisms such as humoral factors (16).
Our present results are showing that the severe insulin resistance in skeletal muscles of high-fat fed rats occurred within 4 weeks, during which time visceral fat accumulation increases by ~70%, before the development of gross obesity. The accumulation of visceral fat was diminished by the substitution of corn oil with fish oil. The addition of fish oil also attenuated insulin resistance of skeletal muscles as other reports (3, 19), and decreased plasma insulin and triglyceride concentrations. Improved insulin resistance by fish-oil supplementation would be from decreased visceral fat accumulation (3) and/or decreased muscle triglyceride content (20, 21). This means that fat composition in a diet may exert carbohydrate-independent effects on muscle insulin resistance.
Although the underlying mechanism for the alteration in muscle insulin resistance induced by different fat composition in diet is not clear, visceral fat mass, muscle triglyceride content, plasma insulin and triglyceride may be related. Recent report suggested that the development of diabetes is associated with chronic inflammation (22) involving the secretion of various cytokines, such as resistin (23), TNFα (24) and IL6 (25) from adipocytes. Therefore, it is possible that visceral obesity increases the level of proinflammatory cytokines resulting in insulin resistance. The present study has also provided evidence that the muscle insulin resistance is closely related to the visceral fat mass.
In conclusion, fat type in diet is an important determinant of insulin action in muscle whereas carbohydrate type has no significant effect. In high carbohydrate diet, the amount of calorie intake appears to be a more important factor in developing insulin resistance than carbohydrate composition. Thus, these findings indicate that fat composition and carbohydrate composition in diet have different effects on muscle insulin resistance. Visceral fat mass and the levels of plasma insulin and triglyceride may be contributing factors in the induction of muscle insulin resistance in rats fed both high-carbohydrates and high-fat diets.


 XML Download