

 PDF
PDF ePub
ePub Citation
 Print
Print


INTRODUCTION
Paraquat (1,1'-dimethyl-4, 4'-bipyridium dichloride, PQ) is one of the most widely used herbicides in the world. In humans, intentional or accidental ingestion of PQ is frequently fatal, resulting from significant lung injury (1). Over the past 30 yr, several methods for modifying the toxicity of PQ have been investigated including prevention of absorption from the gastrointestinal tract (2, 3), removal from the bloodstream (4, 5), prevention of accumulation in the lungs (6, 7), scavenging oxygen free radicals (8, 9), and prevention of lung fibrosis (10, 11). Unfortunately, most of these methods have not been effective; and the clinical outcome is determined by the degree of exposure to PQ. PQ mainly accumulates in the lung where it is retained even when the blood levels start to decrease. Subsequent redox cycling and the generation of reactive oxygen species (ROS) trigger the lung injury (12, 13). This is the reason why intentional or accidental PQ ingestion frequently causes death by respiratory failure (12).
There are many methods available for evaluation of the severity of lung injury in acute PQ intoxication, such as arterial blood gas analysis (aBGA), high-resolution computed tomography (HRCT) of the lung (14). Also there are some markers for alveolar destruction in acute PQ intoxication, such as ethane in exhaled breath (15), and plasma surfactant levels (16).
We previously reported that HRCT of the lung obtained 7 days after PQ ingestion was the best way to evaluate the fully developed acute PQ lung injury (14). The initial pathology of the lung is alveolitis, which develops into ground glass opacities (GGOs) in HRCT. The mortality rate is strongly associated with the plasma PQ levels as well as the amount of PQ ingested (17-19).
Considering the significant association of the PQ level with clinical outcome and the fact that respiratory failure is the main cause of death, the extent of the lung injury might be related to the plasma PQ levels. Nevertheless, the correlation of the extent of the lung injury with plasma PQ levels and clinical outcome is unknown. To determine the association of the development of GGOs with plasma PQ levels and clinical outcome, we analyzed the results of lung HRCT scans obtained in patients with acute PQ intoxication and attempted to determine the factors that distinguished the survivors from those that did not survive.
MATERIALS AND METHODS
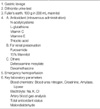
This study was approved by ethics committee of Soonchunhyang University Cheonan Hospital and received a written consent from the patients and/or their family. From January to November 2007, 250 patients (143 males and 107 females) with acute PQ intoxication were admitted to the Institute of Pesticide Poisoning (IPP), Soonchunhyang University Cheonan Hospital. Standardized medical emergency procedures were conducted, which were summarized Table 1. Of 250 patients 119 (68 males and 51 females) were enrolled in this study. The inclusion criteria were patients who swallowed PQ and had acute PQ intoxication confirmed at the IPP with the dithionite urine test and/or plasma PQ levels. All of the enrolled patients had HRCT, 7 days after the PQ ingestion. The patients that died prior to 7 days were excluded from the study. HRCT was not done in 131 patients who were dead or hopelessly discharged within 7 days after PQ ingestion. As we described in a previous report (20), the survivor was defined as the patient who remained alive longer than 4 weeks after discharge.
The mean age of the subjects was 43.3±12.2 yr. The ingestion amount (mean; 25.0±23.9 mL of 23% PQ; in Korea, most PQ products are a 23.0% solution) was determined by the reported mouthfuls ingested (one mouthful; 20 mL). The plasma PQ level of the subjects in the emergency room was 0.57±1.72 µg/mL retrospectively.
The time interval between PQ ingestion and arrival to the IPP was 21.2±30.3 hr.
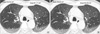
Measurement of GGOs area on HRCT (Fig. 1)
All HRCT scans were obtained 7 days after PQ poisoning using an eight-detector (LightSpeed Ultra, GE Healthcare) or 64-detector (LightSpeed VCT, GE Healthcare, U.S.A.) row scanners. The scanning parameters were 120 kVp, 200 or 300 mA, beam width 10 or 20 mm, and a pitch of 1.675 or 1.375. The 1.25 mm thin-section computed tomography (CT) scans with 5 mm intervals were acquired using retrospective reconstruction of raw data with a lung algorithm. HRCT images were available at a picture archiving and communication systems (PACS) with appropriate lung (window width, 1500, window level, -650) window settings on the monitors (four monitors, 2,048×2,560 matrix, 8-bit viewable gray, 500 cd/m2).
Two radiologists (specialzed in chest radiology) assessed the CT scans retrospectively. Decisions on the CT findings were reached by consensus. GGO is defined as hazy increased opacity with preservation of bronchial and vascular margins. The areas of GGOs were measured at five levels (at the levels of the top of aortic arch, aortopulmonary (AP) window, left upper lobe (LUL) bronchus, right inferior pulmonary vein, and the top of left diaphragm ) using the area measurement tool of the PACS. To calculate the extent of the lung injury, the sum of the area of GGOs at the five levels were divided by the sum of the areas of the total lung at the respective levels. Sometimes, it is difficult to differentiate GGOs from consolidation. In this study, if the area of focal consolidation is located within the boundary of GGO, it was regarded as area of GGOs. If the area of consolidation was located outside the area of GGO, this area was not included in the area of GGO.
Statistics
Data are presented as mean±SD and range of distribution when the distribution of data was unusually wide. Comparison of the parameters was performed with the t-test; but the Mann-Whitney test was applied for the time lag after PQ ingestion, estimated ingestion amount (mL), area with GGOs on HRCT (%), aspartate minotransferase (AST), alanine aminotransferase (ALT), amylase, and lipase because of the unusually wide distribution of the raw data.
RESULTS
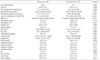
Of 119 subjects, 102 survived and 17 died of acute PQ intoxication. There was no difference between the survivors and those who did not survive by age (42.4±12.3 yr vs. 44.6± 11.0 yr, P=0.488) or gender (male/female: 58/44 vs. 10/7, P=0.880). The WBC count was higher in those that did not survive than those survived (17,336.5±5,283.6 µL vs. 10,942.6 ±4,452.2 µL, P<0.001, Table 2). The estimated ingestion amount of PQ was lower in the survivors than in the dead (19.4±11.3 mL vs. 59.2±44.7 mL, P<0.001). Between the survivors and those that did not survive there was no significant difference in the interval between PQ ingestion and arrival to the emergency room, (22.1±31.9 hr vs. 16.2± 18.2 hr, P=0.45). However, the plasma PQ levels were significantly higher in those that did not survive than the survivors (2.6±4.0 µg/mL vs. 0.2±0.4 µg/mL, P=0.02).
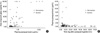
The area of the lung with GGOs was 2.03±6.44% in the survivors and 73.0±29.93 in those that did not survive (P<0.001). The area of GGOs was zero in 40 out of 102 survivors and it was larger than 80% in 9 out of 17 patients that did not survive. Eight subjects (3 survivors and 5 non-survivors) had between 20-40% GGOs. No patients survived when the amount of GGOs was larger than 40%. In contrast, all patients with GGOs smaller than 20% survived (Fig. 2).
DISCUSSION
Plasma PQ levels are known to be an excellent prognostic indicator for patient outcome (17-19). However, at the bedside, it is difficult to predict survivors even when the PQ levels are known. Recently, we published an analysis of our clinical observations, which showed an association between plasma PQ levels and clinical outcome in 375 patients with acute PQ intoxication (20). Based on the information from the plasma PQ levels it was hard to predict who would survive because many patients died even at low PQ levels. Therefore, better predictive measures are needed for patients presenting with acute PQ intoxication. Because lung injury is the main cause of death after acute PQ intoxication, the lung abnormalities would be a better predictive factor.
The initial pathology of PQ intoxication is an alveolitis, which is later shown as GGOs in HRCT. In diagnosing the lung injury caused by PQ, HRCT is employed as a sensitive and specific tool. We evaluated the severity of the lung injury by measuring the extent of involved lung. The results of this study showed that there were no deaths when the area of GGOs was smaller than 20% of the total lung volume. In addition, there were no survivors when the area of GGOs was larger than 40% of the total lung volume. When 20% and 40% of the total lung volume was affected, some patients died and others survived.
For those patients who died within 7 days before they took the HRCT, we presume that GGO might have developed across their entire lungs. The GGO-inflicted patches were distributed unevenly across the area. There was no such GGO area in the 40 cases out of 119 survivors, more than 80% of such inflicted area in the 9 cases out of the 17 non-survivors. Eight cases were transitional between 20-40% of GGO trace in the lung. In these transitional cases, 3 cases survived and 5 did not.
In conclusion, given the fact that the minimum fatal PQ level can be very low in practice (Fig. 2), the area of GGO in the lung is an additional useful predictor for the survival, especially when the PQ level is low.
 XML Download