

 PDF
PDF ePub
ePub Citation
 Print
Print


INTRODUCTION
Upstream stimulatory factor 1 (USF1) is a transcription factor belonging to the basic helix-loop-helix leucine zipper family. It is known to regulate the expression of several genes involved in glucose (1) and lipid metabolism, such as those encoding apolipoproteins (2, 3), hepatic lipase (4), and glucokinase (5) in the liver and fatty acid synthase (6), acetyl-CoA carboxylase (7), and hormone-sensitive lipase (8) in the adipose tissue.
The upstream transcription factor 1 (USF1) gene is located on chromosome 1q22-23. In linkage studies, it was found to colocalize with the familial combined hyperlipidemia (FCHL) and type 2 diabetes loci (9, 10). USF1 polymorphism is reported to be associated with FCHL in Finnish (9) and Mexican families (11). There are several studies on the association between USF1 and metabolic abnormalities, such as hyperlipidemia, diabetes, and cardiovascular disease, in various populations (9-15). However, the association between USF1 and metabolic abnormalities remains debatable.
In a study involving the European population (15), the two common USF1 single nucleotide polymorphisms (SNPs), rs2073653 (306A>G) and rs2516840 (1748C>T), showed an association with the effect of body mass index (BMI) on low-density lipoprotein (LDL) cholesterol levels only in young males whose fathers had a proven myocardial infarction before the age of 55 yr but not in the controls who were age-matched and recruited irrespective of family history. In Korean population, no study on the association between USF1 SNPs and dyslipidemia or BMI has been performed.
In the present study, we attempted to examine the association between USF1 SNPs and dyslipidemia or BMI in the general Korean population. Therefore, we selected two common USF1 SNPs (rs2073653 and rs2516840) that showed an association with the effect of BMI on LDL cholesterol levels in the European Atherosclerosis Research Study II (15). Furthermore, we divided the subjects into 3 groups (premenopausal females, postmenopausal females, and males) due to the different levels of obesity and blood lipids by gender (female vs. male) and menopausal state (17-19).
MATERIALS AND METHODS
Subjects
From January 2003 to April 2004, 275 Korean adults were recruited at the Eulji University Hospital, and ethics approval was obtained from the Institutional Review Board of this hospital.
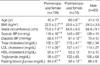
Of the subjects, 139 were premenopausal females; 76 were postmenopausal females; and 60 were males. The mean ages of the pre- and postmenopausal females were 40 (range, 33-47 yr) and 60 yr (range, 54-66 yr), respectively. The mean age of the male subjects was 41 (range, 28-54 yr). None of the subjects had renal or liver disease, diabetes, or cardiovascular disease, except hypertension. None of them was taking medication that could affect blood lipid, glucose, or thyroid metabolism or obesity. Based on their menstrual history, all the postmenopausal females had no menstrual bleeding for more than 1 yr. They all had undergone menopause naturally and were taking neither estrogen nor estrogen and progestin combined pills. The clinical profiles of the subjects are summarized in Table 1.
We divided the subjects into 3 groups (pre- and postmenopausal females, and males) for analysis. To perform a case-control study by using the chi-square test including genotypic, allelic, and haplotype frequencies, the subjects were divided into the case and control groups for each parameter (BMI, total blood cholesterol, LDL cholesterol, triglycerides, and high-density lipoprotein (HDL) cholesterol levels). The lipid levels of the subjects in the control group were as follows. Total blood cholesterol <200 mg/dL, LDL cholesterol <100 mg/dL, triglycerides <150 mg/dL, and HDL cholesterol ≥40 mg/dL in males and 50 mg/dL in females. The BMI level of the subjects in the control group was <25 kg/m2. The lipid levels of the subjects in the case group were as follows: total blood cholesterol ≥200 mg/dL, LDL cholesterol ≥100 mg/dL, triglycerides ≥150 mg/dL, and HDL cholesterol <40 mg/dL in males and 50 mg/dL in females. The BMI level of the subjects in the case group was ≥25 kg/m2.
Measurements
Anthropometric parameters, including body weight, height, and waist circumference, were measured in all the subjects. BMI was calculated as the weight divided by the square of the height (kg/m2). The circumference of the waist was measured midway between the margin of the lower rib and the iliac crest. Blood pressure was measured after the subjects sat in a chair for at least 10 min. Measurements were performed at the Eulji University Hospital clinical laboratory. Following a 12-hr overnight fast, a blood sample was collected in the morning for the assessment of blood biochemistry and lipid levels and for genotyping. By using routine laboratory techniques, the levels of total cholesterol, triglycerides, HDL cholesterol, and LDL cholesterol were measured from serum samples.
Genotyping
Blood was collected from the subjects by venipuncture and stored in EDTA Vacutainer tubes at -70℃. DNA was extracted using a G-spin Genomic DNA Extraction Kit (iNt-Ron, Daejeon, Korea). We examined the two USF1 polymorphisms, rs2073653 (306A>G) and rs2516840 (1748C>T), as described previously (15). We designed specific primers as following sequences; 5'-CAGCTTCTGTTGGGAATGCCG-3'and 5'-AAAAGACGACGGACAAACACCA-3' for rs2073653 genotyping, and 5'-GGCTGAAAGGGCTAGAATAGG-3'and 5'-CCTGGTCCCCTCCTCTAAAA-3'for rs2516840 genotyping. Polymerase chain reaction (PCR) was performed in a 40 µL reaction volume comprising 50 mM Tris (pH 8.3), 16 mM (NH4)2SO4, 1.75 mM MgCl2, 2.5 mM of each dNTP, 2 U HiPi thermostable DNA polymerase (Elpis-Biotech Inc., Daejeon, Korea), 0.6 µg genomic DNA, and 10 pM of specific primers. Amplification was performed in a MBS 0.2G thermocycler (Thermo Electron Corporation, Waltham, MA, U.S.A.). For rs2073653 genotyping, PCR was carried out at 95℃ for 10 min, followed by 30 cycles at 95℃ for 30 sec, 58℃ for 30 sec, and 72℃ for 30 sec. Final extension was done at 72℃ for 10 min. And for rs2516840 genotyping, PCR was performed at 95℃ for 10 min, followed by 30 cycles at 95℃ for 45 sec, 58℃ for 45 sec, and 72℃ for 45 sec. Final extension was done at 72℃ for 10 min. The amplified products were electrophoresed on a 2% agarose gel in 0.5× TBE running buffer and were visualized using ethidium bromide for size estimation. Each PCR product was incubated with 1 U restriction enzyme (MspI) for 20 hr. The restricted fragments were electrophoresed on a 3.5% agarose gel in 0.5×TBE running buffer and were visualized using ethidium bromide.
Statistical analysis
Chi-square tests were performed to estimate the Hardy-Weinberg equilibrium in all 3 groups. In linkage disequilibrium (LD) tests, the values of the LD coefficient (D') and squared correlation coefficient (r2) were calculated. To test the allelic and genotypic differences among the phenotypes in the pre- and postmenopausal female groups and the male group, a case-control association study was performed using the chi-square test. The haplotype frequencies and the differences in the haplotype distribution were examined. All these tests were conducted using SNPAlyze 5.0.4 (Dynacom, Chiba, Japan). In addition, we examined the differences in age, BMI, fasting blood glucose levels, and blood lipid levels (as continuous variables) among the rs2073653 and rs2516840 genotypes via analysis of variance (ANOVA) or the Student t-test by using the Statistical Package for the Social Sciences software (SPSS, Korean version 12.0). The related data were represented as mean±standard deviation (SD). p<0.05 was considered to be statistically significant.
RESULTS
To investigate the relationship between USF1 SNPs and dyslipidemia or obesity, we divided the subjects into 3 groups comprising premenopausal females (n=139), postmenopausal females (n=76), and males (n=60). As shown in Table 1, these 3 groups exhibited different clinical characteristics depending on the gender and menopausal state. Postmenopausal females have increased BMI, waist circumference, blood pressure, and levels of total cholesterol, LDL cholesterol, triglycerides, and fasting blood glucose, compared to premenopausal females. In this study, compared to the males who were of a similar age as the premenopausal females, the postmenopausal females showed increases in most parameters, except waist circumference, levels of HDL cholesterol and triglycerides. Compared to the premenopausal females, the male subjects had increased BMI, waist circumference, blood pressure, and fasting blood glucose but decreased HDL cholesterol levels.
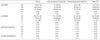
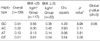
The genotypic and haplotype frequencies and the LD between rs2073653 and rs2516840 are shown in Table 2. In all the subjects, the frequencies of the minor alleles of rs2073653 and rs2516840 were 0.48 (A allele) and 0.14 (T allele). In all 3 groups, the genotypic distribution did not deviate from the Hardy-Weinberg equilibrium for the two polymorphisms (data not shown). LD analysis revealed a D' value of higher than 0.5 but not higher than 0.25 at the r2 between the two polymorphisms in all 3 groups. We also estimated 4 haplotypes and their frequencies. The frequencies of the haplotypes were 0.52 (GC), 0.34 (AC), 0.14 (AT), and 0.01 (GT).
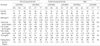
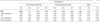
As continuous variables, we analyzed the age, BMI, and levels of fasting blood glucose and lipids such as total cholesterol, LDL cholesterol, HDL cholesterol, and triglycerides according to the genotypes of rs2073653 and rs2516840 (Table 3). For 3 genotypes of rs2073653, the results did not reveal any statistically significant differences in the analyzed factors in all 3 groups. Because the TT genotype in rs2516840 is rare, we analyzed only two genotypes (CC and CT) of rs 2516840 by using the Student t-test. For this SNP site, we could not detect any statistically significant difference in the analyzed factors in all 3 groups (Table 3).
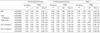
In the case-control analysis, there was no significant difference in the genotypic or allelic frequencies for rs2073653 or rs2516840 between the case and control groups, which were divided based on the BMI, and the levels of total cholesterol, triglycerides, LDL cholesterol, and HDL cholesterol, in any of the 3 groups (Table 4).
The GC haplotype for rs2073653 and rs2516840 revealed a significant difference between the case (BMI ≥25 kg/m2; n=22) and control (BMI <25 kg/m2; n=117) groups among the premenopausal females (χ2=4.23, p=0.04); however, there was no association of the other haplotypes between the case and control groups (Table 5) and no association between the GC haplotype and the lipid levels in the premenopausal females (Table 6). In the postmenopausal female group and the male group, the frequencies of all the haplotypes were not significantly different between the case and control groups in terms of the BMI, as well as in the lipid levels (Table 6).
DISCUSSION
In the present study, we recruited subjects based on the population to which they belonged; the subjects were without coronary heart disease, ischemic stroke, type 2 diabetes mellitus, renal disease, or liver disease. We attempted to investigate an association between the USF1 SNPs and BMI or blood lipid levels.
It is known that the USF1 polymorphisms rs2073653 and rs2516840 demonstrate ethnic differences with regard to their genotypic and allelic frequencies among populations (http://www.ncbi.nlm.nih.gov/SNP/snp_ref.cgi?rs=2073653, http://www.ncbi.nlm.nih.gov/SNP/snp_ref.cgi?rs=2516840). In this study, the minor allelic frequencies of rs2073653 and rs2516840 were found to be 0.48 and 0.14, respectively; however, for the Caucasian population, these frequencies have been published as lower than 0.15 and higher than 0.29, respectively (15). Therefore, these polymorphisms may be useful in determining the ethnic differences in the USF1 gene function. This is the first report of a study on USF1 polymorphisms in a Korean population.
It is well-known that females become substantially obese and dyslipidemic after menopause (17-19). As shown in Table 1, the 3 groups in this study exhibited different levels of obesity, blood pressure, and blood lipid levels due to differences in gender (female vs. male) and menopausal state (premenopause vs. postmenopause). These data are consistent with those presented in previous reports (17-19). However, in previous USF1 association studies (12-14), the female subjects were not divided into subgroups based on their menopausal state. Therefore, in this study, we examined the association of USF1 SNPs with BMI and with blood lipid levels in 3 different groups (pre- and postmenopausal females, and males).
Several previous studies regarding the association between USF1 and metabolic disorders, such as hyperlipidemia and type 2 diabetes mellitus, have been performed in subjects ascertained for these traits, e.g., FCHL studies involving Finnish and Mexican families and a type 2 diabetes study involving Chinese families (9, 11, 13). The present study is population-based and not family-based.
A French Caucasian population case-control study has reported the absence of an association with regard to genotype and haplotype between 8 USF1 SNPs (rs3516837, rs1556259, rs2516838, rs2073653, rs2774276, rs2516841, rs2073658, and rs3737787) and type 2 diabetes (12). It also reported that USF1 SNPs were not associated with the plasma levels of glucose and lipids in normoglycemic subjects (12). A Chinese study reported that USF1 SNPs (rs3737787, rs2516841, and rs2516839) and haplotype were associated with type 2 diabetes mellitus in family-based cases; however, there was no such association in population-based type 2 diabetic cases (13). In addition, this Chinese study reported that the USF1 haplotype was not associated with blood lipid levels in family-based cases (13). These results were consistent with the negative association result between USF1 SNPs and blood lipid levels or fasting blood glucose levels obtained in this study.
Our Korean population-based subjects demonstrated no association between USF1 SNPs (rs2073653 and rs2516840) and BMI, lipid levels, or fasting blood glucose levels. However, the occurrence of the GC haplotype with rs2073653 and rs2516840 differed significantly between the case (BMI ≥25 kg/m2) and control (BMI <25 kg/m2) subjects among the premenopausal females but not among the postmenopausal females and males.
Komulainen et al. reported that USF1 SNPs such as rs2516839 was associated with BMI in females with coronary heart disease or ischemic stroke but not in males and the subcohort normal control females (14). In the present study, we did not investigate this SNP rs2516839. It will be needed to examine the association between USF1 SNP rs2516839 and BMI in our study subjects. Komulainen et al. implied a female-specific risk effect of USF1 and studies for the sex-specific cardiovascular disease risk genes in different populations (14). There has also been a report that in MCF-7 breast cancer cells, USF1 and the estrogen receptor (ER) alpha may interact at the ER alpha minimal promoter as components of a multi-protein complex of transcription factors (20). These studies suggest that USF1 might affect estrogen function. However, the suggestion remains to be verified.
In conclusion, two common USF1 SNPs (rs2073653 and rs2516840) are not associated with dyslipidemia or BMI in the general Korean population, and we propose that occurrence of the USF1 GC haplotype with rs2073653 and rs2516840 may be associated with BMI in premenopausal Korean females and has a female-specific effect. The relatively small sample size and cross-sectional design should be considered as limitations of the present study. A prospective study involving a large number of dyslipidemic and obese subjects that will investigate other USF1 polymorphisms including rs2516839 SNP is required to reveal the association between USF1 and dyslipidemia or obesity in the Korean population.
 XML Download