

 PDF
PDF ePub
ePub Citation
 Print
Print


INTRODUCTION
Regional body fat distribution has an important influence on metabolic and cardiovascular risk factors. Many prospective studies have shown that increased abdominal fat accumulation is an independent risk factor for coronary artery disease, hypertension, stroke, and type 2 diabetes mellitus (T2DM) (1-3).
In 1988, Reaven described what has now become known as insulin resistance syndrome (also called metabolic syndrome) (4). Since then, the definitions have been expanded to include a cluster of interrelated cardiovascular risk factors including central adiposity, hypertension, dyslipidemia, and disturbances of fibrinolysis, with abnormalities of insulin metabolism at the core.
Many people with metabolic diseases, such as DM, hypertension, and atherosclerosis, have normal weights in the clinical setting. Ruderman et al. stated that there are many nonobese people with a condition called metabolic obesity, which indicates a higher risk of developing metabolic diseases because of insulin resistance due to abdominal obesity (5). For this reason, it was recommended that these individuals control their diets and exercise during the early stage of abdominal obesity to alleviate visceral obesity and prevent subsequent development of metabolic diseases. Therefore, it is implied that overall obesity determined by body mass index (BMI) cannot be the sole indicator of increased risk for metabolic disorders, and has limitations in evaluating insulin resistance.
Many studies support the idea that fat accumulated in the viscera, unlike subcutaneous fat, has an important role in metabolic activity (6). In fact, it has been proven that visceral fat leads to insulin resistance and hyperinsulinemia, and is closely related with hyperlipidemia and hypertension, which promote atherosclerosis. This suggests that visceral obesity is equivalent to metabolic obesity (2, 7).
Patients with T2DM are at high risk for coronary heart disease, cerebrovascular disease or stroke, and peripheral vascular disease. Their risk for these disorders is 2 to 6 fold higher than that in persons without diabetes. These macrovascular diseases are common causes of morbidity and mortality among people with diabetes. In recent years, non-invasive methods have been developed to measure the intima-media thickness (IMT) of the carotid artery, coronary artery calcification (CAC) and ankle-brachial pressure index (ABPI) as an index for atherosclerosis (8, 9).
Thus, the aim of this study was to investigate whether general and abdominal obesities were associated with atherosclerosis in Korean T2DM patients.
MATERIALS AND METHODS
Subjects
This study was comprised of 530 patients (male:female=319:211, mean age 56 yr) with T2DM at our affiliated hospitals
and clinic from December 2002 to February 2005. The study protocol adopted was approved by the Yonsei University College of Medicine Ethical Committee and informed consent was obtained from all patients. The subjects were classified into four groups, according to BMI: 1) the under-weight (UW) group (BMI <18.5 kg/m2), 2) the normal-weight (NW) group (18.5-22.9 kg/m2), 3) the over-weight (OW) group (23-24.9 kg/m2), and 4) the obese (OB) group (25 or more kg/m2).
Methods
Hypertension was defined as systolic blood pressure (SBP) ≥140 mmHg or diastolic blood pressure (DBP) ≥90 mmHg, and/or reported treatment with antihypertensive medications in the past 2 weeks. SBP and DBP values were classified as stage 1 hypertension criteria by Joint National Committee (JNC) 7 report 2003.
Measurement of anthropometric parameters
Body weight and height were measured in the morning, with participants wearing light clothing. BMI was calculated as body weight in kilograms divided by height in meters squared (kg/m2). Waist circumference was measured with a soft tape, midway between lowest rib and iliac crest, with standing position. Hip circumference was measured over the widest part of the gluteal region, and waist-to-hip ratio (WHR) was calculated accordingly. Body fat percentage was evaluated by dual-energy radiography absorptiometry (QDR 1500, Hologic, MA, U.S.A.).
Measurement of insulin resistance
To evaluate insulin resistance in all individuals, a short insulin tolerance test was performed and assessed by Kitt. With the subject at rest, 0.1 U per kg of body weight of a 100 times diluted short-acting human insulin (Humulin-R, Eli Lilly, IN, U.S.A.) was administered via the vein, and a blood sample was obtained from the opposite vein 0, 3, 6, 9, 12, and 15 min. Each blood sample was immediately centrifuged and its glucose concentration determined. The insulin sensitivity index (ISI, %/min) was derived by linear regression from the rate of fall of the log glucose value between 3 and 15 min. T1/2 was calculated when the baseline blood glucose level reached 50% of its initial value, and the ISI was calculated from the equation:
ISI=Kitt (rate constant for plasma glucose disappearance)=0.693/t1/2*100 (%/min)
Measurement of biochemical profiles
Blood was sampled from all of the subjects after fasting for more than 10 hr. Plasma glucose concentrations were measured with a standard glucose oxidase reference method (747 automatic analyzer, Hitachi, Tokyo, Japan). HbA1c was analyzed using high performance liquid chromatography (Variant II, Bio-Rad, CA, U.S.A.). Serum C-peptide concentrations were determined by an enzyme chemiluminescence immunoassay (ECIA, DPC, LA, U.S.A.).
The serum total cholesterol and HDL-cholesterol were measured using a direct enzymatic method (747 automatic analyzer, Hitachi). Serum triglyceride (TG) levels were measured by an enzymatic colorimetric method (747 automatic analyzer, Hitachi), and LDL-cholesterol was calculated using the Fridewald's equation. Serum free fatty acid (FFA) concentrations were determined by colorimetry. Fibrinogen was measured in citrated plasma by a modified clot-rate assay (Pacific Hemostasis Assay Set, Humlersville, NC, U.S.A.).
Measurement of coronary artery calcification
The amount of calcium deposition in the coronary artery was measured using electron beam computed tomography (EBT) (Imatron Ultrafast CT, General Electric, WI, U.S.A.). In order to get an EBT image during the diastolic phase, 3 mm thick imaging slices of the heart were obtained from the lower margin of the main pulmonary artery to the diaphragm, after gating of the Electrocardiogram according to 80% of the R-R interval. The score of calcification in the right and left coronary artery was measured. The resultant score of CAC was calculated as the density/pixel (0.5 mm2) using the method of Agatston et al. (10).
Measurement of intima-media thickness
IMT was measured using high-resolution B-mode ultrasound (Toshiba SSA 270A, Tokyo, Japan) with an electric linear transducer (7.5 MHz) according to the method of Pignoli et al. (11). All measurements were blindly evaluated by the same experienced physician who had no information about the patients. Plaque in the common carotid artery was defined by high echogenicity with a postechogenic shadow or more than 1.3 mm of IMT according to the Multicenter Isradipine Diuretic Atherosclerosis Study (MIDAS) (12).
Measurement of ankle-brachial pressure index
Brachial blood pressure and ankle blood pressure were measured using Plethysmography (Modulab, Life Science, CT, U.S.A.). The ankle-brachial pressure index (ABPI) was calculated automatically.
Measurement of regional fat distribution by computed tomography
The abdominal adipose tissue area and midthigh muscle area were quantified using computed tomography (Tomoscan 350, Phillips, NJ, U.S.A.). Adipose tissue was defined as having a density of -150 to -50 Hounsfield units (13), and was divided into visceral fat tissue (the inner portion) and subcutaneous fat tissue (the outer portion), according to its position relative to the peritoneal membrane. The visceral fat area/subcutaneous fat area (VSR) was calculated as the ratio of visceral fat area to subcutaneous fat area. Measurements of skeletal muscle area (Hounsfield units, -49 to 100) from the middle of the femur yielded visceral fat area/thigh muscle area ratios (VMRs).
Statistical analysis
Descriptive statistics are presented as mean values±SD. Comparisons between the groups were tested using one way Analysis of Variance (ANOVA) or independent sample t-tests or chi-Square tests, as appropriate. We used the linear-by-linear association method to analyze the effect of BMI on variable metabolic parameters. Statistical analyses were conducted using SPSS for Windows, version 11.0 (SPSS Inc., Chicago, IL, U.S.A.), and p<0.05 was set as the level of significance.
RESULTS
Clinical and biochemical characteristics according to BMI
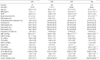
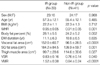
Among the 530 patients, 47 patients (8.9%), 184 patients (34.7%), 154 patients (27.4%), and 154 patients (29.1%) belonged to the UW, NW, OW, and OB groups, respectively. There was no significant difference in age, duration of DM, SBP, DBP, or HbA1c levels between the different BMI groups (Table 1). Additionally, WHR and body fat content increased significantly as BMI increased (0.82±0.11, 0.89±0.16, 0.93±0.10, 0.97±0.16, for WHR, respectively, p=0.021 and 21.2±5.2%, 23.2±5.4%, 27.4±4.8%, 31.5±5.5%, for body fat content, respectively, p=0.027).
There were no differences in the percentage of patients with a history of taking antihypertensive drugs, smoking history, or presence of microvascular (nephropathy, neuropathy, retinopathy) or macrovascular (atherosclerosis) complications of DM among each group. SBP increased significantly as BMI increased (p=0.044), although DBP did not differ significantly between the groups. Total cholesterol level was not different between the groups. However, serum TG level was significantly lower in the UW group. Additionally, HDL-cholesterol was considerably higher in the UW group compared with the remaining groups. Significant differences in FFA levels were observed when patients were categorized into groups depending on their BMI (p=0.026). Moreover, there were considerable differences in serum fibrinogen levels among groups (p=0.037). There was no difference in 24-hr urinary albumin excretion between the groups. Significant differences were seen in fasting serum C-peptide levels between OB group and the others, but no difference was found between the UW, NW and the OW group. There was no notable difference in insulin resistance (ISI) between groups, with ISI values of 2.45±2.10, 2.31±2.11, 1.97±1.90, and 1.89±2.22%/min, respectively. In addition, if an ISI of 2.5%/min is taken to be the standard value for insulin resistance, insulin resistance was observed more frequently in patients with higher BMIs (p=0.042) (Table 1).
We compared the visceral fat area, subcutaneous fat area, and midthigh muscle area for 80 subjects that were matched for sex, age, and BMI, by separating the NW or OW subjects according to their insulin sensitivity. The insulin resistant subgroup (ISI<2.5%/min, N=39) had a larger visceral fat area (p<0.0001), a larger subcutaneous fat area (p=0.05), and less midthigh muscle area (p=0.027) than the non-insulin resistant subgroup (ISI ≥2.5%/min, N=41). Therefore, the patients with insulin resistance had a higher VSR (p=0.040) and VMR (p<0.0001) than patients without insulin resistance (Table 2).
Clinical and biochemical characteristics according to WHR as an estimate of abdominal obesity
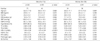
In the NW and OW group, the male subjects had 0.95 of the median value of WHR, whereas female subjects had 0.91 of the median value. Subjects with abdominal obesity, according to the median value of their WHR, were grouped together. There was no difference in age, BMI or the duration of diabetes between these groups in either male or female subjects. However, the group with higher WHR had a higher body fat percentage in both male subjects (p=0.004) and female subjects (p=0.011). Both SBP and DBP were not significantly different between the two groups, but subjects with higher WHR had a higher prevalence of hypertension (for male, p=0.009 and for female, p<0.05) There were no significant differences in total cholesterol between the two groups. However, serum TG level was higher in both male and female patients with higher WHR than in patients with lower WHR (p=0.028 in males; p=0.039 in females). Moreover, HDL-cholesterol levels were significantly lower in both male and female patients with higher WHR (p<0.0001 in males; p=0.015 in females). No differences were observed in serum HbA1c levels between the two groups, but serum FFA levels were considerably increased in male and female patients with higher WHR (p=0.043 in males; p=0.046 in females). Serum fibrinogen concentrations were also higher in male and females patients with higher WHR (p=0.000 in males; p=0.048 in females). ISI was significantly lower in male and female patients with higher WHR (2.01±1.84 vs. 2.78±1.95%/min, p=0.039, in male patients; 2.02±1.57 vs. 2.68 ±1.68%/min, p=0.049, in female patients) (Table 3).
The degree of atherosclerosis according to WHR as an estimate of abdominal obesity
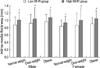
In the NW, OW and the OB groups, male subjects with abdominal obesity had a greater IMT than those without abdominal obesity (1.01±0.21 vs. 0.87±0.21 mm, p=0.012; 1.04±0.31 vs. 0.92±0.24 mm, p=0.008; 1.08±0.22 vs. 0.96±0.21 mm, p=0.006, respectively). However, there were no differences in IMT between the NW, OW, and OB groups (Fig. 1). Similarly, female subjects with abdominal obesity had a greater IMT in NW, OW, and OB group (0.94±0.17 vs. 0.84±0.16 mm, p=0.0025; 1.00±0.33 vs. 0.86±0.34 mm, p=0.007; 1.05±0.22 vs. 0.90±0.17 mm, p<0.001, respectively). However, there were no significant differences between the NW, OW, and OB groups (Fig. 1).
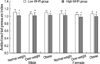
In terms of ABPI, male subjects with abdominal obesity had a lower level of atherosclerosis than those without abdominal obesity in NW, OW, and OB group (1.01±0.08 vs. 1.11±0.07, p=0.004; 1.01±0.09 vs. 1.06±0.05, p=0.024; 1.03±0.05 vs. 1.10±0.05, p<0.001, respectively). However, there was no difference in atherosclerosis in male subjects between each groups (Fig. 2). Similarly, female subjects had a lower level of atherosclerosis in the NW, OW, and OB group (1.02±0.07 vs. 1.07±0.08, p=0.008; 0.98±0.06 vs. 1.04±0.07, p=0.002; 0.99±0.06 vs. 1.06±0.07, p<0.001, respectively) but no difference was found between each groups (Fig. 2).
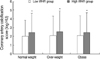
Lower CAC scores, as measured by EBT, were found in subjects with abdominal obesity than in those without abdominal obesity, in the NW group (2.47±2.16 vs. 1.99±1.86 logHU, p<0.001), the OW group (3.53±2.39 vs. 2.10±2.21 logHU, p<0.001), and the OB group (2.45±2.25 vs. 2.12±2.35 logHU, p<0.001). However, there was no difference in CAC scores between the groups (Fig. 3).
DISCUSSION
When compared to Caucasian T2DM patients, Korean patients with T2DM have a lower prevalence of obesity according to BMI (14). In this study, more than 70% of the subjects had a BMI within or below the normal range. However, 60% of the group with a normal BMI (20-25 kg/m2) had insulin resistance. When classified according to insulin resistance, there was no difference in BMI between the subjects with and without insulin resistance. This may be a characteristic of Korean T2DM patients. Huh (15) measured the fasting insulin level in Koreans within a range of fasting plasma glucose from 4.44 to 11.10 mM/L, and found that over-weight subjects had a peak level of insulin of 100.5 pM/L at 7.77 mM/L of fasting blood glucose, and normal weight subjects had their peak level of insulin of 57.4 pM/L at 5.83 mM/L of fasting blood glucose. These Korean insulin levels are half as much as those reported for Caucasians (16, 17). Therefore, it has been suggested that Koreans are at increased risk of developing diabetes despite their mild degree of insulin resistance, possibly due to decreased insulin secretion capacity of their β-cells, due to ethnic or environmental factors.
Hales et al. (18) have suggested the thrifty phenotype hypothesis, which postulated that malnutrition (especially the deficiency of protein) during the embryonic and infant period causes impairment in the development of the endocrine pancreas and β-cell insulin secretion. Subjects were prone to develop diabetes if they developed insulin resistance due to abdominal obesity in the adult period. The incidence of diabetes has increased in Korea, as the number of patients with abdominal obesity increases, due to rapid economical development, improved food standards as well as increased alcohol consumption, overeating, and sedentary lifestyles. Such developments support the thrifty phenotype hypothesis. Further studies regarding the effect of environmental factors on insulin resistance and insulin secretion are needed to elucidate the pathogenesis of T2DM in Korea.
In our study, insulin resistance was measured by the short insulin tolerance test. The euglycemic-hyperinsulinemic clamp is the standard technique for evaluation of insulin sensitivity in humans (19), but its complexity limits its use in clinical practice. Alternatively, the short insulin tolerance test represents a simple and inexpensive approach for the evaluation of in vivo insulin sensitivity in humans (20). It has been validated against the clamp and is largely used in clinical studies (21). Subjects with less than 2.5%/min of ISI were considered to have insulin resistance, according to the findings of a previous study, which was performed to evaluate the validity of short insulin tolerance test and to investigate the cut-off value of insulin resistance in Koreans by comparing to the euglycemic clamp test (22).
It is known that the characteristic features of dyslipidemia in metabolic syndrome are an increased level of TG and a decreased level of HDL-cholesterol, with little change in the levels of total cholesterol and LDL-cholesterol (4, 23). In this study, there was no difference in total cholesterol, but a significant difference in TG and HDL-cholesterol between the insulin-resistance groups.
The final manifestations of metabolic syndrome are coronary heart disease, cerebrovascular disease, and peripheral artery disease due to atherosclerosis. The concept of cardiovascular risk factors arose from the Framingham Heart Study, a landmark study in cardiovascular disease epidemiology that established older age, male sex, diabetes, hypertension, dyslipidemia, and smoking as the major risk factors for coronary heart disease (24). Carotid IMT was closely associated with coronary artery disease and cerebrovascular disease (25), and has been proved to be a marker of generalized atherosclerosis. It is already known that an inverse relationship exists between the ABPI and cardiovascular diseases (26) and that the ABPI can be a marker for generalized atherosclerotic disease (27). CAC, a marker of atherosclerosis, can be quantified non-invasively and accurately by EBT (28). A direct relationship exists between CAC and both histological and in vivo intravascular ultrasound measures of atherosclerotic plaque. CAC predicts future CAD end points in asymptomatic and symptomatic adults, while CAC quantity is an independent predictor of angiographically defined CAD after controlling for established CAD risk factors (29). Many established CAD risk factors, such as male sex, older age, smoking, abnormal lipid levels, and high blood pressure are related to CAC quantity (30). In this study, there were no differences in IMT, ABPI, or CAC levels between the NW and OW groups, but a significant difference in IMT was found according to abdominal obesity. Furthermore, ABPI as a valid index of atherosclerosis was lower and CAC score was higher in patients with abdominal obesity than those without abdominal obesity.
BMI is useful, albeit crude, population-level measure of overweightness and overall obesity (31, 32). Body weight and height are simple to measure and have been widely included in clinical and population health surveys. However, BMI does not distinguish between the weight of fat and muscles or body frame. Moreover, abdominal fat mass can vary considerably within a narrow range of total body fat or BMI, and WHR and waist circumference provide additional information on the nature of obesity. These anthropometric measures have been associated with abdominal fat mass as measured by computed tomography or magnetic resonance imaging (32) and are economically and easily obtained. Thus, WHR and waist circumference have been recommended for the assessment of abdominal obesity in population-based studies (32). In many population studies, however, abdominal obesity has not been assessed or has been measured by the participants themselves. Furthermore, there is a lack of consistency in the selection and cut-off points for the anthropometric indicators of abdominal obesity (31, 33).
The present study indicates that abdominal obesity is associated with atherosclerosis in T2DM patients and appears to provide additional information beyond BMI in predicting atherosclerosis. Therefore it is important to control abdominal obesity and insulin resistance in T2DM patients.
 XML Download