

 PDF
PDF ePub
ePub Citation
 Print
Print


INTRODUCTION
Uncoupling proteins (UCPs) are located within the inner mitochondrial membrane, and function as proton channels (1). Whereas mitochondria utilize energy derived from fuel combustion to create a proton electrochemical gradient across the mitochondrial inner membrane, UCPs uncouple proton gradient from ATP synthesis (2). The UCP family has been characterized in human, and most studies were conducted on three major members including UCP1 (MIM 113730), UCP2 (MIM 601693), and UCP3 (MIM 602044) (1). The expression and activation of UCPs is normally mediated by the sympathetic nervous system, and is controlled by norepinephrine. Due to their significant roles in energy metabolism, many association studies have been conducted regarding the associations of UCP polymorphisms with metabolic phenotypes, including metabolic rate, energy expenditure, exercise efficiency, body mass index (BMI) and diabetes (3-7). Among UCP family members, UCP1 is expressed primarily in brown adipose tissue (BAT), and has been reported to be responsible for thermogenesis (2).
Recently, the results of some animal studies have provided some clues regarding the relationship existing between respiratory uncoupling and blood pressure (8, 9). The uncoupling agent, dinitrophenol, has been demonstrated to induce smooth muscle contraction (10), a hallmark of blood pressure elevation. UCP1 is expressed primarily in brown adipose tissue, and periaotic brown adipose tissue is known to be present in both rodents and humans, in amounts sufficient to alter the temperature of the aortic blood (11, 12). Bernal-Mizrachi et al. demonstrated that UCP1 expression in the aortic smooth muscle cells of transgenic mice increased the generation of aortic superoxide, coupled with a 46 mmHg increase in tail cuff systolic blood pressure (SBP), and a 21 mmHg increase in diastolic blood pressure (DBP) (8). The relationship between UCP1 and blood pressure regulation was also suggested by the finding that blood pressure-regulatory hormones also modulate the expression of UCP1. Kraus et al. reported that aldosterone, a mineralcorticoid hormone that regulates blood pressure, also modulated the expression of UCP1 in brown adipocytes (13). Porter et al. also determined that angiotensin II, one of the principal regulators of blood pressure, increased UCP1 mRNA expression in brown adipose tissue (14).
Until now, however, the relationship of UCP1 with blood pressure in human is not clear. In this study, the effects of genetic polymorphisms of UCP1 on blood pressure were analyzed in a population consisting of 832 Korean female subjects.
MATERIALS AND METHODS
Subjects
The 832 female subjects who participated in this study were recruited from a women's health and obesity clinic in the Kirin Medical Foundation (Seoul, Korea). Mean age and BMI were 27.9 yr and 25.9 kg/m2 respectively. Female subjects over 50 yr old with high possibility of menopause were only 2.2% of the total subjects (n=18), and exclusion of them caused no significant effects on the results. Individuals who were taking anti-hypertensive, anti-hyperlipidemic or anti-diabetic medications were excluded from this study. Individuals with hypertension but were not taking medicines at the time of blood pressure measurement were included in the study, and then they were advised for appropriate medical care.
The general characteristics of the subjects are listed in Table 1. The SBP and DBP of each of the subjects were measured after at least 10 min of resting. Body fat mass was measured via bio-impedance analysis, using a commercial device (Inbody 2.0, Biospace Co., Seoul, Korea). Genomic DNA was obtained with the informed consent of all participants, and the protocols of this study were approved by the Institutional Review Board. Genomic DNAs from each subject were extracted from whole blood, using the Accuprep™ Genomic DNA Extraction Kit (Bioneer Co., Daejeon, Korea), in accordance with the manufacturer's instructions.
Genotyping
The genotyping of genetic polymorphisms was conducted via the TaqMan method. Primer Express (Applied Biosystems, Foster City, CA, U.S.A.) was employed in the design of both the polymerase chain reaction (PCR) primers and the TaqMan probes. The relevant primer information was listed in Table 2. One allelic probe was labeled with FAM dye, and the other with VIC dye. PCRs were run in TaqMan Universal Master Mix (Applied Biosystems) with PCR primer concentrations of 900 nM and TaqMan probe concentrations of 200 nM. Reactions were conducted in a 384-well format, in a total reaction volume of 5 µL, using 20 ng of genomic DNA. The plates then were positioned in a thermal cycler (PE 9700, Applied Biosystems) and heated for 2 min at 50℃ and 10 min at 95℃, followed by 40 cycles of 95℃ for 15 sec and 60℃ for 1 min. The assay mixtures were then transferred to a Prism 7900HT (Applied Biosystems), in which the fluorescence intensity in each well of the plate was determined.
Statistical analysis
Hardy-Weinberg equilibrium tests were utilized in order to determine whether or not individual genetic polymorphisms were in equilibrium at each locus within the population. |D'| and r2 were evaluated in order to measure linkage disequilibrium between all single nucleotide polymorphism (SNP) loci (15), and haplotypes and their frequencies were inferred using the algorithm, HapAnalyzer (http://hap.ngri.go.kr). Association analyses were performed using general linear model procedures, in which were included the effects of the UCP1 genetic polymorphism, age, and BMI. Age and BMI-adjusted analysis of covariance (ANCOVA) was conducted in order to assess the independent effects of the UCP1 polymorphisms on blood pressure. Statistical significance was established at a level of p<0.05. All analyses were conducted using the SAS system for windows, version 8.2 (SAS Korea, Seoul, Korea).
RESULTS
In this study, genetic polymorphisms in UCP1 gene were evaluated with regard to their association with blood pressure in a population composed of 832 Korean women. Sixty five male subjects were also recruited, and their numbers were not enough for parametric statistical analyses. Because the number of male subjects was less than 8% of the number of female subjects, the statistical analyses were confined to female subjects for the controlling of the sex-related physiological factors. Inclusion of male subjects in statistical analyses showed similar results (data not shown).
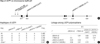
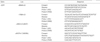
Among the 37 UCP1 polymorphisms listed in the NCBI database (http://www.ncbi.nlm.nih.gov/projects/SNP/), four SNP found in promoter and exon regions were selected for genotyping of all 832 subjects. The gene map of UCP1 and locations of the selected SNPs are shown in Fig. 1A, and characteristics of them were summarized in Table 3. The genotypic distributions of four selected SNPs were all determined to be in Hardy-Weinberg equilibrium (HWE) (p>0.05). As shown in Fig. 1B, four common haplotypes with frequencies more than 0.05 were constructed from four selected SNPs of UCP1. Among them, UCP1-ht1[AAGA] was tagged by -3954A>G with a frequency in excess of 95%. Likewise, UCP1-ht2[GGGA] and UCP1-ht4[GAAT] were tagged almost completely by -1766A>G and +6537A>T, respectively. These tagged haplotypes were not analyzed further, as their effects were almost identical to their tagging SNPs.
Four SNPs and UCP1-ht3[GAGA] haplotype were further analyzed with regard to their association with SBP and DBP after adjusting for age and BMI in the 832 Korean female subjects. UCP1-ht3 evidenced a significant association with SBP (Table 4). The SBP distributions were as follows: 114.63±0.50 mmHg (n=553) among UCP1-ht3 non-carriers; 117.36±0.75 mmHg (n=248) among heterozygotes; and 112.98±2.11 mmHg (n=31) among homozygote (p=0.005 in codominant model). Similar associations were determined to exist between UCP1-ht3 and DBP. The DBP distributions were as follows: 71.84±0.42 mmHg among UCP1-ht3 non-carriers; 73.80±0.62 mmHg among heterozygotes; and 69.98±1.77 mmHg among homozygote (p=0.013 in the codominant model) (Table 5). As five independent statistical tests were conducted in Table 4, the significance level is 0.05/5=0.01 after Bonferroni correction, which is the most conservative method of multiple comparison correction (16). The results showed that the association of UCP1-ht3 with SBP is highly significant: significant even after multiple comparison correction (p<0.01).
As blood pressure was closely associated with obesity phenotypes, the observed associations between UCP1-ht3 and blood pressure might have been mediated by its effects on obesity phenotypes, in spite of the fact that BMI had been adjusted for in the statistical analyses. In order to ascertain this, the BMI and body fat mass of all subjects were compared with regard to UCP1-ht3 (Table 6). Our findings indicated that UCP1-ht3 had no statistically significant effect on either BMI or fat mass among the subjects. This suggests that the association of the UCP1-ht3 with blood pressure may be independent on its effects on obesity phenotypes.
DISCUSSION
The association pattern of UCP1-ht3 with blood pressure can not be explained by classical mendelian inheritance, because heterozyote showed higher blood pressure than UCP1-ht3 homozygote. Another form of inheritance was suggested which is neither dominant nor recessive and in which only heterozygote is affected (17). In this situation, homozygosity for the normal allele and the mutant allele give a normal phenotype. Only heterozygote produces an abnormal phenotype because the two alleles, when present together, interact to produce a harmful effect. Pedigree studies provided possible evidences for the harmful interaction of two alleles in human diseases (18). UCP1 polymorphism study conducted on Japanese males suggested similar two allele interaction. It was reported that AG heterozygote of the A-3826G polymorphism of UCP1 has higher risk than AA and GG homozygote suggesting a harmful interaction of two alleles in UCP1 heterozygote (19). Even though more study should be conducted to get clear evidence of the two allele interaction, our results suggest that heterozygosity of UCP1-ht3 haplotype was associated with elevated blood pressure in Korea female subjects.
The findings of this study should be interpreted within the context of its limitations. The subjects of this study were young females, and our findings might not be appropriate for extrapolation to general population. However, the significant associations observed in this study provide some evidence of the involvement of UCP1 in the blood pressure of human.


 XML Download