

 PDF
PDF ePub
ePub Citation
 Print
Print


INTRODUCTION
Many people with metabolic syndrome have a low-grade inflammation that may place them at risk for the development of cardiovascular disease. In view of its emerging epidemic nature and impact, the early identification of those at high risk of developing metabolic syndrome would help prevent associated cardiovascular complications. Several epidemiological studies have already noted a relationship between some components of metabolic syndrome and leukocytes (1-4). Moreover, leukocyte count has been positively associated with elevated cardiovascular mortality, mainly due to coronary heart disease and ischemic stroke (5-9), and it has been considered to be a marker of inflammation associated with the initiation and development of atherosclerosis. If the leukocyte count is an independent risk factor of metabolic syndrome, then it is important to consider the role of the constituent cell types involved. However, few systemic evaluations have investigated the relation between metabolic syndrome and differential leukocyte counts (10-13).
In this study, we investigated the relationship between total and differential leukocyte counts and the frequencies of diabetes, hypertension, dyslipidemia, obesity, and metabolic syndrome, after adjusting for clinical and biochemical factors.
MATERIALS AND METHODS
Subjects
The medical records of the 15,654 subjects (age, median 46, range 14-90 yr; 8,380 men and 7,274 women) who visited our Center for Health Promotion for a medical check up between January 2002 and December 2003 were investigated. Since routine medical checks are not covered by the Korean medical insurance system, we suspect that most of our study subjects were members of the upper-middle economic class. Subjects meeting any of the following criteria were excluded; a positive test for hepatitis C virus antibody, a positive test for hepatitis B virus surface antigen, a history of current antidiabetic/antihypertensive/antilipid medication, or an abnormal white blood cell (WBC) count (<3,800 or >10,000/µL). Subjects were classified into tertiles with respect to total and differential leukocyte counts. Diabetes was defined as a fasting plasma glucose ≥7.0 mM/L; hypertension as a systolic blood pressure ≥140 mmHg and/or a diastolic blood pressure ≥90 mmHg; dyslipidemia as a serum LDL-cholesterol low density lipoprotein-cholesterol-C (LDL-C) ≥4.2 mM/L and/or triglyceride ≥2.46 mM/L and/or HDL-cholesterol high density lipoprotein-cholesterol-C (HDL-C) <1.16 mM/L; obesity as a body mass index ≥25 kg/m2 (14, 15). The presence of metabolic syndrome was determined using the definition provided by the Third Report of the National Cholesterol Education Program Expert Panel on the Detection Evaluation, and Treatment of High Blood Cholesterol in Adults (16), as:- three or more of the following abnormalities: body mass index (BMI) ≥25 kg/m2; triglyceride ≥1.7 mM/L; HDL-C <1.04 mM/L; fasting plasma glucose (FPG) ≥6.1 mM/L; systolic blood pressure (SBP) ≥130 mmHg, and diastolic blood pressure (DBP) ≥85 mmHg. However, obesity according to the Expert Panel guidelines was not used as a criterion; instead, BMI was used, because waist circumference measurement was not available. The inclusion of BMI as a criterion is in line with the definition of metabolic syndrome recommended by the Japan Society for the Study of Obesity (17). This study was approved by the Internal Review Board (IRB) of the Samsung Medical Center.
Assay methods
Height and weight were measured with subjects wearing light clothing but no shoes in the morning; blood pressure was measured using a mercury sphygmomanometer on the right arm with subjects in a sitting position after a 5-min rest. BMI was calculated as weight in kilograms divided by height in meters squared. Information on lifestyle factors including alcohol consumption, cigarette smoking, household income, and educational background were obtained by trained nurses. Questions about alcohol intake included items about alcohol consumption frequency per week, and the type of alcoholic beverage; weekly alcohol intake was calculated and converted to daily alcohol consumption. Subjects were classified as non-drinkers or current drinkers when they consumed on average < 180 or 181 to < 360 g of alcohol/week, respectively. Heavy alcohol drinking was defined as ≥360 g/week of alcohol. Blood samples were obtained in the morning after an overnight fast. Plasma glucose was measured in duplicate by the hexokinase method using an autoanalyzer (Hitachi, Tokyo, Japan), which had an interassay coefficient of variation of 1.6%. Standard liver testing, total cholesterol, HDL-C, LDL-C, triglycerides, and uric acid were measured using an autoanalyzer (Hitachi, Tokyo, Japan), as were WBC counts (Sysmex, Kobe, Japan). Plasma fibrinogen was assessed using Clauss method (reagent kit from Dade Behring, Newark, NJ, U.S.A.). Hepatitis B virus surface antigen (HBsAg) and Hepatitis C virus antibody (anti-HCV) were measured using commercially available immunoradiometric assay kits (both from Riakey, Goyang, Korea).
Statistics
Data are expressed as means±SD. Analysis of variance (ANOVA) or χ2 tests were used to compare variables between tertile groups. Logistic regression analysis was used to obtain the odds ratios for diabetes, impaired fasting glucose, hypertension, dyslipidemia, obesity, and metabolic syndrome after adjusting for age, gender, smoking, alcohol intake, educational background, and household income. Statistical analyses were performed using SPSS/PC+ (SPSS, Inc., Chicago, IL, U.S.A.), and differences were considered statistically significant at a p level of <0.05.
RESULTS
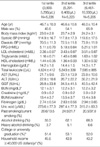
The clinical characteristics of study subjects according to total leukocyte count are presented in Table 1. Univariate analyses showed that the following increased with increasing total leukocyte count; BMI, systolic and diastolic BP, fasting plasma glucose, lipid profile, serum aspartate aminotransferase (AST), serum alanine aminotransferase (ALT), gamma-glutamyl transferase (GGT), fibrinogen, uric acid, and a male gender, heavy alcohol drinking, and current smoking. Age, HDL-C, and household income decreased with increasing total leukocyte counts.
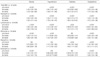
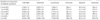
Logistic regression analyses showed that the frequencies of obesity, hypertension, diabetes, and dyslipidemia increased as total leukocyte, neutrophil, and lymphocyte counts increased after adjusting for age, gender, smoking, alcohol intake, educational background, and household income (Table 2). Total and differential leukocyte counts increased with increase in numbers of components of metabolic syndrome (Table 3).
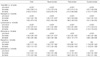
Because smoking was identified as a major determinant of leukocyte count, we performed a subgroup analyses to further examine this feature. It was found that in all three smoking subgroups total and differential leukocyte counts were independently associated with the presence of metabolic syndrome, with the exception of basophil counts in past-smokers and current smokers (Table 4).
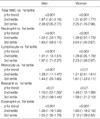
Men had higher total leukocyte counts and higher alcohol consumption and smoking frequencies than women. We performed logistic regression analyses to determine the odd ratios of the presence of metabolic syndrome with respect to total and differential leukocyte counts in both genders (Table 5). In both men and women, all differential and total leukocyte counts were significantly associated with the presence of metabolic syndrome after adjusting for the above mentioned variables.
To determine which component of the differential leukocyte count was more strongly related to metabolic syndrome, we performed logistic regression analyses using the individual differential leukocyte counts as covariates. The calculated odds ratios (95% CI) of metabolic syndrome (for highest versus lowest count quartiles) were: 1.76 (1.53-2.02) for neutrophils, 1.96 (1.71-2.25) for lymphocytes, and 1.59 (1.38-1.83) for eosinophils. However, monocyte and basophil showed no significant difference.
DISCUSSION
Our analysis demonstrates that leukocyte count, even within its normal range, is closely related to the presence of the components of metabolic syndrome after adjusting for age, gender, smoking, alcohol consumption, educational background, and income. Our results are consistent with previous findings concerning the significance of the relationship between total leukocyte count and metabolic syndrome (18-20), and with its components, namely, obesity, high blood pressure, and high serum triglyceride (21, 22).
Although several studies previously revealed these associations, these studies have usually involved a relatively small numbers of subjects, and the exclusion criteria adopted were insufficient. Unlike other studies, subjects positive for hepatitis C virus antibody and/or hepatitis B virus surface antigen, which are prevalent in Korea, were excluded, as were subjects with a recent history of antidiabetic, antihypertensive, or antilipid medication because of the possibility that these drugs could have affected leukocyte counts.
The mechanism of the relationship between leukocyte counts and cardiovascular disease has not been clarified. As cytokines are potent inducers of leukocyte differentiation, we speculated that an activated cytokine system might lead to elevated leukocyte levels. Furthermore, activated differentiated leukocytes can produce more cytokines. There is a possibility that hormones such as cortisol or insulin, which are known to be increased in metabolic syndrome, then stimulate leukocyte propagation (23-25). Some data are available on the association between differential leukocyte counts and coronary heart disease. Prentice et al. were the first to analyze differential leukocyte counts, and found that elevated neutrophil and eosinophil counts were both related to the development of coronary heart disease, and further suggested a similar relationship for monocyte count (26), and this relationship between coronary heart disease and monocyte counts was confirmed by Olivares et al. (11). Caerphilly and Speedwell found significant increases of neutrophil and eosinophil count in men who developed ischemic heart disease during follow-up (27), and the Atherosclerosis Risk in Communities study found that those in the highest quartiles for monocyte and granulocyte counts had a higher rate of cardiovascular disease mortality than those in the lowest quartiles (9).
Tanigawa et al. reported that total leukocyte and total lymphocyte counts, and more specifically, memory cell counts are elevated in middle-aged men with clustered features of metabolic syndrome (28). To the best of our knowledge, this is the first report to find significant associations between differential and total leukocyte counts and metabolic syndrome after adjusting for age, gender, smoking, alcohol intake, educational background, and household income. The reason for the differences between our results and those of Tanigawa et al. are uncertain. The first possibility concerns sample size differences, as the larger sample size used in the present study, compared to that of Tanigawa et al. (15,654 vs. 439), would have enabled us to detect smaller differences. The second possibility concerns the compositions of study subjects. Our study included both men and women in the range of age 14-90 yr, whereas Tanigawa et al. included only middle-aged men.
The present study has several limitations. This is a cross-sectional study, thus we only observed the association between leukocyte count and metabolic syndrome and could not determine the causal relationship. Although our study was relatively large in scale, the possibilities of using differential leukocyte counts as risk markers for metabolic syndrome require prospective study. Another limitation of the present study is that insulin resistance, a key component of metabolic syndrome, was not measured, and thus no direct relationship between insulin sensitivity and leukocyte counts was demonstrated. Moreover, we used BMI alone as a parameter of obesity, and waist circumference or some other parameter of obesity that more accurately reflects insulin resistance or atherogenicity would have been more preferable because obesity is a major determinant of leukocyte count. In addition, because this was not a population-based study, our results are limited in terms of their meaningfulness in the Korean population. In view of the fact that subjects with a college or university graduation constituted 52.2% of the study population and 44.2% had a relatively high income (household income ≥40,000 US dollars/yr), it is apparent that our study subjects represented the upper socioeconomic Korean class.
In conclusion, the results of the present study suggest that even within normal ranges, total leukocyte count and all differential leukocyte count examined are independently associated with the presence of metabolic syndrome. Future prospective studies are required to determine which differential leukocyte counts are most associated with metabolic syndrome development.
 XML Download