

 PDF
PDF ePub
ePub Citation
 Print
Print


INTRODUCTION
Prostate cancer is the most common malignancy in males in the United States and Canada (1), and the estimated number of prostate cancer in 2006 was more than 200,000 (2). Several modalities are applied for the treatment of prostate cancer including radical prostatectomy and external radiation therapy. The treatment techniques used in external radiation therapy are well described in the literature (3).
For patients with disease confined to the gland, there has been a renewed interest in brachytherapy (4-6) following the advent of ultrasound image-guided seed implants (7-9) and more recently computerized tomography (CT)-guided (10, 11) and magnetic resonance (MR)-guided (12, 13) implants. In such a procedure, on the order of 100 radioactive sources are permanently placed within the prostate gland in such a manner as to deliver the prescribed dose to the prostate. Evaluation of the implant is then carried out some time after the implant to allow edema to subside and the seeds to reach their final location.
The success or failure of prostate brachytherapy may depend on the accurate definition of the target and localization of the radioactive sources. Traditionally, post-implant dosimetry has been carried out using multiple planar films of the prostate to reconstruct the three-dimensional seed locations and calculate dose distributions (14). Such a technique requires a significant effort on the part of the planner to correlate seed projections from one film to the other. Once the correlation is determined, the seed location may be calculated knowing the geometric relationship between the planar films. Dose distributions relative to the location of the seeds may then be calculated and plotted, but it is hard to correlate the dose to soft tissue anatomies of interest: prostate, urethra, and rectum.
Recent efforts have presented methods for post-implant dosimetry using CT images and MR images (15-17). These techniques offer the ability to both reconstruct source positions and relate dose distributions to the anatomy seen on individual slices of the scans. Sources are digitized off the axial slices, but a single source may appear on more than one axial slices. Signals from a seed that appear on multiple slices are removed either by hand or by a semiautomatic algorithm. Calculated dose distributions may then be overlaid on the CT slices. Additionally, the contours representing the anatomy may also be digitized in order to allow for some quantitative measure of the dose distributions to structures of interest. In all these approaches to reconstruct seed location for post-implant dosimetry, a considerable amount of time is required of the planner to digitize and correlate sources and contours.
An automatic seed extraction algorithm from CT, which eliminates any need for digitization, has been developed and successively used to localize seed for prostate brachytherapy (18). However, it has a limitation in accurately defining the prostate volume. An MR image is better in visualizing the prostate gland but poor in localizing the seeds. Thus, it is necessary to develop a method to localize seeds in MR images in order to enhance post-implant dosimetry (19, 20).
The work reported here builds on earlier studies in which optimized MR scanning sequence was used to identify prostate implant sources (13). The present work tried to extend these efforts by developing a semi-automatic seed extraction algorithm from MR images. The algorithm determine x, y, and z coordinates of the seed centers from MR images and register their locations to the patient anatomy. The extracted seed coordinates were then compared to seed locations obtained from CT images for verification.
MATERIALS AND METHODS
Six patients with T1cNxM0 prostate cancer, who had received real-time MR imaging (MRI)-guided interstitial prostate I-125 brachytherapy from Brigham and Women's Hospital were enrolled into this study. Four weeks after the real time MRI-guided seed implants, MR and CT scans were acquired to calculate the final dose distribution. Seeds were extracted from both CT and MR images and radiation dose was calculated based on the sources extracted from each image set. The number of sources extracted from CT and MR images and the prostate volume receiving 100% of the prescribed dose were compared.
Seed localization on CT
Axial CT images were acquired and transferred to a work-station. The images were thresholded and scanned for contiguous voxels to extract the seeds implanted in prostate. After this operation, the number and size of voxles were obtained. If the voxel size was larger than the size of a seed, it was considered as a blob containing more than one seed and thus broken into a smaller group of voxels. The result returned a number of sources dependent on the CT data and three parameters: minimum CT numbers for thresholding, and the minimum and maximum number of voxels associated with a source.
Seed localization algorithm on MR image
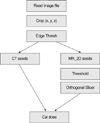
Seed extraction software was written and implemented in the AVS (Application Visualization System) software system (AVS Inc., Waltham, MA, U.S.A.). The AVS allows the users to write their own functions and combine them into executable flow networks. For the seed extraction technique, 10 modules were written in C to test the feasibility of the seed extraction technique and one module was used in the final application (Fig. 1). First, the Read image file module read the MR image to workstation, and the target and adjacent structures were outlined on each MR-scan by a radiation oncologist. Then the anterior-posterior (x), superior-inferior (y), and lateral (z) dimensions of the target and seeds were determined and this area was set as a region of operation. The crop module zeros all the pixels located outside of the region of operation. The images were then thresholded to eliminate bony structures and soft tissues. This was done by assigning zero values to all the pixels that had an MR value less than a threshold value (thresh). In the MR_2D seed module, the program searches for pixels whose values were not zero and count the number of pixels of an object. If the size of an object was smaller than the minimum seed size (blobmin) or greater than the maximum seed size (blobmax), the program set zero values to the object. The program calculates average MR values of each candidate object, and if the average MR value of the object was smaller than a value (avein) and the average MR value outside the object was greater than a value (aveout), then the program considered the object as a candidate seed. In addition, if the aveout value was smaller than a value (avethresh2) then the program calculates the difference: (aveout)-(avein) and if the average difference was smaller than a value (avediff), it eliminated the object from candidate seeds. Then, the program searched for connected objects by rastering the process image voxel by voxel. In this step, objects were considered to be the same objects if the objects were located within specified distance on two or three continuous slices. When a voxel whose size was greater than the size of a value (blob3D), it was eliminated from the image. Finally, based on the distribution of each object, a maximum size of a seed was determined and if the size of an object was greater than the size of a seed (blobcut), it was cut into 2 or 3 seeds. Once the desired number of seeds had been found, the program output the coordinates of each seed and the number of seeds found.
Post-implant dosimetry
Once the location and number of seeds were identified, the centers of all the seeds extracted from MR images were registered to CT images. Three-dimensional registration was performed by identifying the same seeds on CT and MRI. Then the prostate volumes receiving prescribed dose were calculated using a dose engine that uses radial dose approximation.
RESULTS
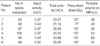
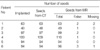
Seed information and prostate volumes as determined by MRI are summarized in Table 1. Forty eight to one hundred nine I-125 seeds were implanted to deliver the prescribed dose. Seed activities ranged from 0.32 mCi to 0.44 mCi, and the total activities at the time of implantation ranged from 21.12 mCi to 40.89 mCi. One patient received a total dose of 77 Gy and five patients received a total dose of 137 Gy. The prostate volumes determined from MR images ranged from 26 cc to 60 cc.
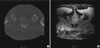
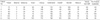
Fig. 2 is the post-implant CT and MR images of a patient. Seeds were depicted as white dots on CT and signal void on the T2-weighted MR image. Parameters to extract seeds from MR images for the patients and the number of extracted seeds are listed in Table 2. Threshold values were determined manually by visually checking the image and varied from 74 to 130. The variation of the minimum pixel size of a candidate seed in 2-dimensional slice was small (between 2 and 3), and the maximum size of a candidate seed varied from 30-53. The variations of the other parameters that gave the desired number of seeds were large as shown in Table 2. The bottom image in Fig. 2 shows the seeds extracted from MR and CT images. The numbers of implanted seeds were similar to the number of seeds extracted from MR images in all cases. Although the number of extracted seeds was same as the number of implanted, the algorithm still had a limitation due to the image quality. The algorithm recognizes false seed as a seed and misses actual seed. In order to define the number of noise and missing seeds, the MR seed coordinates of the seeds were determined and the location of each seed was compared with that of the seeds on CT. The numbers of false seed as well as missed seed are summarized in Table 3. In some cases, the algorithm recognizes two seeds as one seed, thus the number of missing seeds are not same as the number of false seeds. There was no missing seed in two patients, and one and two missing seeds were found in three and one patients, respectively. In most cases (5/6), one to two false seeds were found and three false seeds were found in one patient.
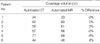
Once the seeds were extracted, prostate volumes receiving 100% of prescribed dose were calculated using the seeds coordinates obtained from CT and MR images (Table 4). The average difference in prostate volume receiving 100% of prescribed dose was 2.3%, ranging from -4 to 3%. The maximum extent of the volume receiving the prescribed dose were 0.3, 0.6, and 0.2 cm in x, y, and z directions, respectively.
DISCUSSION
We developed a semi-automatic seed extraction algorithm from MR and tested the efficacy of the method in this study. Post-implant MRI images of six patients with prostate cancer who received real-time MRI-guided interstitial prostate I-125 brachytherapy were acquired. Seed extraction algorithm was written to extract the implanted seeds from MR images, and the radiation dose was calculated based on the extracted seed information. The algorithm requires nine parameters as an input. These include thresh, blobmin, blobmax, avein, aveout, avethresh2, avediff, blob3D, and blobcut. Bony structures as well as soft tissues are eliminated from the 2D axial MR images by setting a thresh value. The minimum and maximum seed sizes are used to select candidate seeds and eliminate the objects that are included after the thresh process. The blobmax parameter is an important value in obtaining the desired number of seeds. In post-implant MR image, a seed is characterized by void signal surrounded by edema that appears as bright signal. The average signal intensities inside and outside of an object is calculated to eliminate false seed further. Once the candidate seeds are extracted from the axial MR images, 3D-operation is performed. A signal source that appears on more than one axial slice is considered as a single or multiple seeds depending upon the seed size in 3D. If the size is smaller than the blob3D parameter, it is regarded as seed, and if it is bigger than the blob3D parameter, it is regarded as a false signal and it is the signal from blood vessel. Finally, the 3D objects are extracted from MR image, and the seeds are extracted from the image. The number of extracted seeds is strongly dependent on the blobcut parameter. Based on the blobcut parameter, an object is divided into two to three seeds, and the algorithm outputs number of seeds extracted and the coordinates of each seed. There was no unique choice of parameters that will extract the desired number of seeds. Thus the parameters of a patient have to be determined by inspecting the patients' image properties.
The coordinates of seeds extracted from CT image by automatic seed extraction algorithm was also obtained and the MR images were fused to CT images for easy comparison of the two images and dose calculation. The resultant seed distributions from MR images were then compared to CT derived distribution by matching the same seeds and calculating percent volume receiving 100% of the prescribed dose. The agreement between seed locations and signal on both CT and MR slices are shown in Fig. 2. They clearly fall on the location of the high signal points associated with the seeds on CT image and fall on the location of signal void on MR image.
The semi-automatic seed localization method made it possible to extract more than 90% of the seeds with either less than 8% of noises or 3% of missing seeds. Most of false seeds originated from either artery or anatomic structures whose signal intensities and sizes are in the same range as seed. In addition, a seed is missed if it is located close to an anatomic structure, which appears as a large void on MR image.
A semi-automated, accurate, and effective seed extraction method from MR images was developed for real-time MR guided prostate implant. This method was tested using actual patient data and showed that it is possible to identify I-125 seeds from MR images automatically. This method has several advantages over the CT-based post-implant dose calculation method. First, it is possible to calculate the radiation dose in real time, since the locations of the implanted seeds are identified and calculated during MR-guided prostate implant process. Second, the radiation dose to prostate is modified by adding more seeds in the cold area resulting homogeneous dose distribution in the target volume. Third, the need to use CT image can be minimized. As a consequence, exposure to unnecessary radiation can be reduced and the time spent to fuse the two different imaging modalities can be saved.
 XML Download