

 PDF
PDF ePub
ePub Citation
 Print
Print


INTRODUCTION
Thyroid goiters are very common medical problems; however, the mechanism by which they develop are not fully understood. In about 4.1% of patients with goiter and in areas with endemic thyroid goiter up to 20% develop thyroid carcinomas. This prevalence is as high as that reported in patients with thyroid nodules (1, 2). Therefore, elucidation of the mechanism of goitrogenesis may be very important for the prevention and improved treatment of goiter. Many growth factors are thought to be involved in goitrogenesis; elevated thyroid stimulating hormone (thyrotropin, TSH) levels are considered to play an important role in goitrogenesis.
TSH is the major regulator of thyroid hormone synthesis and secretion. It is best known for actions that are mediated by cyclic 3, 5'-adenosine monophosphate (cyclic AMP). However, it regulates many other signaling pathways via expression of a number of genes. These pathways regulate iodide uptake and de novo synthesis and release of thyroid hormone and cell proliferation (3-5). TSH has been shown to stimulate cell cycle progression and proliferation in cooperation with insulin or insulin-like growth factor-1 (IGF-1) in various thyrocyte culture systems including rat thyroid cell lines (FRTL-5) and in primary cultures of rat, dog, sheep, and human thyroid cells (1, 2, 6, 7). In FRTL-5 cells, it is well-known that a 12- to 24-hr pre-incubation with TSH strongly amplifies DNA synthesis when insulin or IGF-1 is added to the culture (3-5). Thyrocytes have been observed to respond differently depending on the growth factor added or pre-conditioning. Therefore, pre-conditioning with TSH may play an important role in the regulation of cell proliferation initiated by other growth factors.
In order to better understand the genes involved we cultured rat thyrocytes and examined the genes regulated by TSH, IGF-1, and insulin using the microarray technology. cDNA microarrays are known to be powerful tools for the study of hormonal effects on cellular metabolism and gene regulation on the genomic scale; this technique enables simultaneous measurement and comparison of the expression levels of thousands of genes (8). We anticipate that this study may provide important information regarding the underlying mechanism involved in goitrogenesis.
MATERIALS AND METHODS
Cell culture
A fresh subclone of FRTL-5 rat thyroid cells was obtained from the Interthyr Research Foundation (Dr. Kohn, Ohio University, OH, U.S.A.). The doubling time of these cells was 36±6 hr when cultured in the presence of TSH; they did not proliferate in the absence of TSH. Cells were grown in 6H medium, which consisted of Coon's modified F-12 medium supplemented with 5% calf serum, 1 mM nonessential amino acids, and a mixture of six hormones: bovine TSH (10 U/L), insulin (10 mg/L), hydrocortisone (0.4 mg/L), human transferrin (5 mg/L), glycyl-L-histidyl-L-lysine acetate (10 µg/L), and somatostatin (10 µg/L). Prior to the experiments and after the cells were about 80% confluent, the cells were grown for seven days in 5H medium depleted of TSH. Then they were grown in 3H medium (hydrocortisone, human transferrin, and glycyl-L-histidyl-L-lysine acetate) for 24 hr prior to treatment with TSH, insulin, or IGF-1.
TSH, insulin, and IGF-I were purchased from Sigma Chemical Co. (St. Louis, MO, U.S.A.). All tissue culture reagents were purchased from Life Technologies (Gaithersburg, MD, U.S.A.), and all other materials were from Sigma, unless otherwise indicated.
Microarray analysis
Total RNA from FRTL-5 cells was extracted using the Trizol reagent (Invitrogen, San Diego, CA, U.S.A.), according to the protocol described by the manufacturer and quantified by spectrophotometry (Beckman, Fullerton, CA, U.S.A.).
Gene expression chips (GeneTrack® cDNA microarray RSVC321, GenomicTree, Tajeon, Korea) containing 5,000 rat genes were used to investigate changes in gene expression. The list of genes on the chips is available at the internet address www.genomictree.com. For the microarray hybridizations, RNA was labeled with one of the fluorescent dyes Cy3 or Cy5 (Amersham Bioscience, Piscaraway, NJ, U.S.A.). Labeled Cy3 and Cy5 cDNA probes were cleaned with a Qiaquick nucleotide removal kit (Qiagen). The purified probes were dried and resuspended in 40 µL of hybridization buffer containing 5×sodium chloride, sodium citrate buffer (SSC), 10% sodium dodecyl sulphate (SDS), 20 µg Cot-1 DNA (Gibco BRL), 20 µg poly A RNA (Promega, Madison, WI, U.S.A.), and 20 µg yeast tRNA (Gibco BRL). Hybridization was performed at 65℃ overnight. Then the microarray slide was washed with distilled water and spin-dried.
Fluorescent intensities of the printed cDNA targets were measured using a GenePix Pro 3.0 microarray scanner (Axon Instruments, Foster City, CA, U.S.A.), and the log ratios of fluorescent intensities within each of the slides were adjusted for data normalization (9). Images were analyzed using GenePix Pro 3.0 (Axon Instruments, Foster City, CA, U.S.A.) and gene expression pattern clustering (hierarchical clustering and SOM) was performed using the programs Cluster version 2.12 and TreeView version 1.50.
Data analysis
Data acquisition was performed with GenePix Pro 3.0 software (Axon Instruments). Each gene had six ratio values, and statistical analysis was performed using the t-test. Normalized and averaged fluorescence ratios of genes were used to calculate the increase and decrease of expression in treated samples compared with control samples. The expression of a gene was considered changed when the difference between means was significant (p<0.05).
RESULTS
TSH-induced gene expression
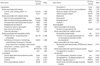
TSH treatment for 24 hr increased expression of some genes. Those that were up-regulated and down-regulated by thyrotropin are listed in Table 1. The expression of genes for brain-enriched guanylate kinase, ATPase Na+/K+ transporting beta 1 polypeptide, activity-dependent neuroprotective protein, cholecystokinin, calnexin, and bone morphogenetic protein 6 was more than doubled; the expression of genes for nucleoside phosphorylase, microtubule-associated protein, and prostaglandin E receptor 4, 2, 3-oxidosqualene was reduced by more than half.
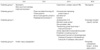
Changes of gene expression by TSH according to time
We treated the cells with TSH for 6, 12, 24, and 48 hr and observed gene expression and its variation, according to time. The features of gene expression change are presented in Table 2. The presence of a cluster group was categorized according to the gene expression pattern by clustering analysis. Gene expression was noted to be increased at each of the times analyzed and thereafter normalized. Genes in group 1, 2, 3, and 4 had maximum expression at 6, 12, and 24 hr, and at 24 and 48 hr.
As noted in Table 2, TSH appears to stimulate a different gene expression pattern in thyrocytes according to time; the effects may be at their maximum within 24 hr and thereafter decrease with time.
Insulin or IGF-1 induced changes of gene expression
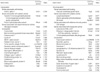
We also observed changes in the gene expression pattern with insulin or IGF-1 treatment for 24 hr. Table 3, 4 show the up- and down-regulated expression with insulin and IGF-1, respectively. Genes for actinin, the glucagon receptor, Cca3 protein, brain-enriched guanylate kinase-associated, orosomucoid 1, and bone morphogenetic protein 6 were upregulated more than twofold by IGF-1; genes for vascular endothelial growth factor, tropomyosin isoform 6, synuclein, gamma, ribosomal protein L5, ferredoxin 1, syntaxin 5a, and the mismatch repair protein were downregulated by more than half. Insulin upregulated the genes for ras-related GTP-binding protein raga, casein kinase II, alpha 1 polypeptide, ATPase, H+ transporting, lysosomal accessory protein 1, tubulin, beta 5, and cholecystokinin, and downregulated genes for calcium-independent alpha-latrotoxin receptor homolog 2, and ribosomal protein L37.
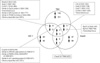
Comparison of the effects of treatment with TSH, insulin or IGF-1 on gene expression
We evaluated whether the effects of TSH, insulin and IGF-1, on thyrocyte proliferation, were active in one pathway or provided additive effects from other pathways. Therefore, we compared gene expressions patterns with maximum changes within 24 hr with TSH, insulin, or IGF-1. Fig. 1 shows the common genes identified. However, there were no common genes up- or down-regulated by all three growth factors, thyrotropin, IGF-1, and insulin.
DISCUSSION
For thyroid cells TSH, through adenylate cyclase activation and cyclic AMP accumulation, induces both cell proliferation and the expression of differentiation characteristics (10). TSH contributes to the regulation of thyrocyte differentiation by modulating thyroid gene levels (11). Recently, a number of genes have been identified that are regulated by TSH. Genes encoding the sodium iodide symporter (NIS), pendrin, thyroglobulin, and thyroid transcription factor-1 (TTF-1) are examples of such genes (11).
In our study, cDNA microarray studies have revealed that a number of genes are modulated by TSH in cultured rat thyrocytes. TSH has been shown to induce different gene expression patterns in thyrocytes according to time; the effect may be maximized within 24 hr and thereafter decreases. In addition, expression of 27 genes (20.5%) out of 132 showed an increased gene activity, which reached its maximum within 6 hr after TSH treatment; most of these genes had apoptosis regulator activity, catalytic activity, or transporter activity. The increased expression of 87 genes (65.9%) was normalized within 24 hr after TSH treatment; however, the genes that play a role in catalytic activity or signal transducer activity showed maximum expression at 48 hr. Most of the genes (123 of 132 genes, 93.2%) showed increased expression within 24 hr. There were no differences observed in the expression patterns in comparisons between groups with different functional activity.
Genes that were upregulated had expression that was more than doubled within 24 hr in the majority of cases. Therefore, our investigation focused on these genes. Of these, genes for cytochrome c oxidase, subunit VIIIa, activity-dependent neuroprotective protein, demethyl-Q 7, acyl-coA oxidase, ATPase Na+/K+ transporting beta 1 polypeptide, cyclin D1, glucagon receptor, cholecystokinin, beta subunit, and bone morphogenetic protein 6 were upregulated by TSH. Among these genes, we searched for information on cellular proliferation; especially among the genes that demonstrated the most up- and downregulated activity. Bone morphogenetic protein (BMP), a member of the TGF-β superfamily, is well known as a multifunctional regulator of cell growth, differentiation, and apoptosis; it plays an important role during development. It is thought to play a pivotal role in endochondral bone formation (12). BMP-2 and BMP-4 control the expression of pituitary transcription factors; blockade of these signals results in arrest of pituitary gland development and absence of all pituitary endocrine cell types. Therefore, absence of pituitary TSH results in a dysfunctional thyroid gland (13).
For BMP-6, there is relatively little information; its upregulation by TSH may have similar effects on the pituitary and the thyroid gland. Recently, it has been shown that BMPs transduce their signals directly through the SMAD family of proteins; however, they have also been reported to interact with the MAPK and Erk pathways. In one study, Kraunz et al. reported that BMP3b and BMP6 were epigenetically inactivated in lung cancer (14). Suzuki et al. (15) reported that BMP-2, -4, -6, -7, and TGF-β1 suppressed TSH receptor mRNA expression in thyrocytes, TSH-induced cAMP synthesis, and TSH-induced IGF-1 expression. They suggested that an aberrant BMP system present in adenomas might be involved in the development of thyroid follicular lesions. From this information we may cautiously infer that BMP6 may play a role via MAPK or Erk pathways in the development of thyroid goitrogenesis or carcinogenesis. To confirma further studies on BMP6 are needed.
Previous reports on the glucagon receptor do not support a role in the growth of the thyroid even though it is expressed in the thyroid (16). However, it has been shown that in hypothyroid conditions glucagon receptor mRNA expression is increased. In addition, hyperthyroidism is associated with an increase in glucagon-binding sites in rat hepatocytes, and thyroid hormone has been shown to enhance the lipolytic response in rat adipocytes to glucagons (17). Increase in glucagon-binding sites leads to activation of the G-protein and elevation of cyclic AMP levels in target tissue. Therefore, it is possible that this gene may play a role in thyroid proliferation via the cyclic AMP- protein kinase A pathway (18).
Cholecystokinin (CCK) has been shown to exert a stimulatory effect on follicular thyroid cells manifested by an increased epithelium/colloid volume fraction ratio (19). Application of selective antagonists of CCK receptor subtypes has demonstrated that CCK acts through the CCK1 receptor subtype at the level of pituitary TSH. The model of endogenous hormone action reveals that thyroid CCK1 is responsible for thyroid growth. However, to date, functional studies have failed to demonstrate any convincing effects of cholecystokinin on basal or TSH-stimulated thyroid hormone secretion (20).
It would be very informative if we could get the expression of other genes, such as cyclin D1 (21, 22), insulin receptor substrate 1 (23), c-myc, c-fos, or c-june etc. (6, 24), which are known to be associated with the growth of thyrocytes, but unfortunately we could not confirm the expression of those genes because of insufficient DNA chip information.
It is well known that thyrocyte proliferation is synergistically activated by TSH and insulin/IGF-1 (4, 6, 25). Therefore, we investigated differential gene regulation after stimulation with TSH, insulin, and IGF-1. We observed the presence of a few genes co-regulated by TSH, insulin, or IGF-1. Genes for bone morphogenetic protein 6, glucagons receptor, and cyclin D1 were upregulated by both TSH and IGF-1; the gene for cytochrome P450, 2c37, was downregulated, by both. In addition, genes for cholecystokinin, glucuronidase, beta, demethyl-Q 7, and cytochrome c oxidase, subunit VIIIa were upregulated by both TSH and insulin, and genes for ribosomal protein L37 and ribosomal protein L4 were downregulated by both growth factors. However, there were no genes identified that were regulated by all three, TSH, IGF-1, and insulin.
These findings suggest that TSH, IGF-1, and insulin induce the proliferation of thyrocytes through distinct signaling cascades; each plays their respective roles and provides additional influence on the synergistic regulation of cell proliferation. Genes for mitogen activated protein kinase 1, thyroid stimulating hormone receptor, insulin-like growth factor 2 modulated by insulin, and genes for cyclin D1, and vascular endothelial growth factor modulated by IGF-1 are known to play a role in thyrocyte growth regulation (21-23). However, the function of other genes observed to be modulated by insulin or IGF-1 remains unknown.
For FRTL-5 thyroid cells, a 24-hr pre-incubation with TSH shortens the G1 phase and strongly amplifies DNA synthesis in response to the addition of insulin or IGF-1 (5). The continuous presence of TSH is not required during cell cycle progression triggered and supported by insulin/IGF-1 (4, 25). A number of investigators (4, 7) have reported that TSH pretreatment potentiates IGF-1-dependent tyrosine phosphorylation of the insulin receptor substrate (IRS)-2, the activation of phosphatidylinositol 3-kinase (PI3K), and the phosphorylation and upregulation of shc, an adaptor molecule of the IGF-1 receptor, which activates MAPK pathways. As reported by other investigators (6, 10, 26), triggering of mitogenesis of thyrocytes by TSH requires the presence of insulin or IGF-1. All of these findings suggest that TSH, through cAMP, IGF-1 and insulin, mutually modulate thyrocyte growth.
In addition, Kimura et al. (6) reported that for FRTL-5 cells the effects of TSH via cAMP exerts potentiating effects on the PI3K and MAPK pathways activated by insulin/IGF-1, and suggested that the different relative effects of TSH and insulin/IGF-1 on the intracellular signaling cascades were consistent with their relative effects on proliferation. They (6) also investigated the change of gene expression and reported that genes such as c-myc, cyclin D1, c-fos, and c-june were stimulated by TSH and also induced by insulin/IGF-1 in FRTL-5 cells and human thyrocytes. The same findings for c-fos and c-myc were also reported by Yoo et al. (24).
In summary, genes increase their expression with TSH and are activated by insulin or IGF-1, which may result in synergistic effects on thyrocyte growth by TSH and insulin or IGF-1.
Our results were insufficient, based on the genetic information from the cDNA microarray used, for a clear conclusion. Newer DNA chip technology is superior in quality and will be used for subsequent studies. In addition, we compared results with samples treated with TSH and insulin or IGF-1. However, results for samples treated with insulin or IGF-1 with or without TSH pre-treatment are required for analysis of a synergistic effect. However, we can conclude that TSH, insulin, and IGF-1 synergistically and independently induce cell proliferation.
As noted above, although a number of genes are involved in thyroid regulation their function is not well-known and more research is needed to improve our understanding. The results from this study suggest that TSH, insulin, and IGF-1 have no common signal pathway; these growth factors appear to have an additive role on the thyroid and complement one another.
 XML Download