

 PDF
PDF ePub
ePub Citation
 Print
Print


INTRODUCTION
According to the Taiwan Department of Health, the cumulative death rates from coronary artery disease, stroke, and diabetes are 152 cases per 100,000/yr, which nearly equals the death rate from malignancies. These 'modern diseases' are a huge burden, not only to the patients themselves, but also to their families and society. This alarming trend is not unique to Taiwan, and has been reported to occur in many other parts of the world. Therefore, the prevention and early detection of coronary heart disease and diabetes has become a major public health issue. The well-known risk factors for these diseases include excess body weight, hypertension, hyperlipidemia, and hyperglycemia. Indeed, the clustering of these risk factors was first noted in 1966 (1). In 1988, Reaven introduced the term Syndrome X, which consisted of hyperinsulinemia, hypertension, dyslipidemia, hyperglycemia, and resistance to insulin-mediated glucose uptake (2). He suggested that insulin resistance (IR) plays an important role in the etiology and clinical course of patients with diabetes mellitus, hypertension, and coronary heart disease (3). In 1998, the World Health Organization (WHO) also recognized the importance of this clustering and further defined the clinical characteristics of the 'metabolic syndrome' (MetS) (4). However, such criteria are not practical for routine clinical use because one of the major criteria, IR, requires measurement by a hyperinsulinemic euglycemic clamp. Therefore, the National Cholesterol Education Program Adult Treatment Panel III (ATP III) provided a simpler definition in 2001, in the hope that it could be used even in general practice (5). It had been shown that patients with MetS, as defined by either WHO or ATP III criteria, have more severe IR as compared to the general population (6, 7). However, the cut-off values of these diagnostic criteria were originally determined arbitrarily, have never been stratified according to a weighted clinical effect, and may vary in different ethnic groups. Moreover, it is unknown which of the five clinical characteristics amongst the ATP III criteria, if any, is related to more severe IR.
In the current study, we measured IR directly by an insulin suppression test (IST). Subjects were placed into quartiles based on the level of each of the MetS clinical characteristics. Then, the steady state plasma glucose (SSPG) level resulting from the IST was compared between the different quartiles representing one clinical characteristic as well as between all the different clinical characteristics. Furthermore, factor analysis (8, 9), a multivariate statistical tool, could reduce a considerable number of inter-correlated variables to a smaller set that accounts for most of the variances between the data. By this mean, a set of dimensions (sometimes called factors) which are not easily observed in the original variable could be identified. Therefore, it was also used to investigate which of MetS factors are related to IR (SSPG levels).Thus, we are able to determine the severity of IR between the quartiles representing each clinical characteristic, but also determine which clinical characteristic of MetS was associated with the most severe IR when compared with other clinical characteristics within the Chinese population.
MATERIALS AND METHODS
Subjects
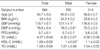
Five hundred sixty four subjects, 250 males and 314 females aged 20-75 yr, were enrolled during routine health evaluations at the Tri-Service General Hospital between 1995 and 1999. The demographic data derived from the subjects are shown in Table 1. Subjects with a history of diabetes, hypertension, hyperlipidemia, or other significant medical or surgical diseases were excluded. Subjects who were placed on medications which affect insulin sensitivity were also excluded from the study.
The study was approved by the Hospital Ethics Committee, and the nature, purpose, and potential risks of the study were explained to the patients before obtaining their consent to participate. Since Reaven suggested that the upper 25% in the general population are IR, we divided our subjects into four groups regarding each of five clinical characteristics of the MetS and then evaluated the IR in each quartile (2).
Laboratory evaluation
The ability of insulin to dispose of a glucose load was estimated by modification of the IST, as described by Shen et al. (10). After an overnight fast, intravenous catheters were introduced in the arms of each subject. One catheter was used for the administration of a 180 min infusion of somatostatin (250 µg/hr), insulin (25 mU/m2/min), and glucose (240 mg/m2/min). The other arm was used for the collection of blood samples. Blood was collected every 30 min initially, and then at 10 min intervals from 150-180 min of the infusion, to determine the steady state plasma insulin (SSPI) and SSPG concentrations for each individual. The SSPI concentrations were comparable in all individuals, thus the SSPG concentrations provided the measure of efficacy of insulin in promoting disposal of the infused glucose load.
Plasma was separated from blood within 1 hr and stored at -30℃ until analyzed. The samples obtained at -5 and 0 min were analyzed for fasting plasma glucose (FPG), fasting plasma insulin (FPI), and lipid levels. Plasma glucose levels were determined using the glucose oxidase method (YSI 203 Glucose Analyzer; Scientific Division, Yellow Spring Instrument Company, Inc., Yellow Spring, OH, U.S.A.). Insulin levels were measured by a commercial solid phase radioimmunoassay kit (11; Coat-A-Count Insulin Kit; Diagnostic Products Corporation, Los Angeles, CA, U.S.A.). The intra- and inter-assay coefficients of variance for insulin were 3.3% and 2.5%, respectively. Both triglyceride (TG) and total cholesterol (TC) levels were measured using the dry, multilayer analytical slide method in the Fuji Dri-Chem 3000 analyzer (Fuji Photo Film Corporation, Minato-Ku, Tokyo, Japan). Serum high density lipoprotein cholesterol (HDLC) concentration was determined by an enzymatic, cholesterol assay method following dextran sulfate precipitation.
Statistical analysis
Analysis was performed using SPSS for Windows, version 10.0 (SPSS; Chicago, IL, U.S.A.). Data were tested for normal distribution using the Kolmogorov-Smirnov test and for homogeneity of variances with Levene's test. Continuous variables are expressed as the mean±SEM. Independent Student's t-test was used to evaluate gender-based physical and metabolic differences. The one-way ANOVA with the Bonferroni method as a post hoc test was also applied to compare differences between the clinical characteristics in each quartile. Since age was considered as the confounding covariate, each variable of interest (i.e., body mass index [BMI], TG, HDLC, FPG, and blood pressure) was first adjusted for age by employing the analysis of covariance. The derived residuals (adjusted variables) were then again used for analyses after the unadjusted data were examined. All statistical tests were two-sided and p-values less than 0.05 were considered to indicate statistical significance. Furthermore, exploratory factor analysis was conducted to examine the relationships among the variables which constituted MetS. Principle factor analysis was employed to transform the original variables into a new set of components which are independent of each other. Then number of components to be retained was based on Scree plot analysis (factors above the break in the curve were retained) and eigenvalue criteria (1.0). Such two modalities have been adopted to identify the minimum number of components (8, 12, 13). Varimax rotation was used to obtain a set of independent and interpretable factors. The resulting factor pattern was interpreted using factor loadings of ≥0.4. We only put the factors of the MetS and SSPG into the model.
RESULTS
As expected, the male subjects in the current study had higher blood pressures and lower HDLC levels than the female subjects. The other MetS clinical characteristics measured did not differ significantly between male and female subjects (Table 1).
We further divided the male and female subjects into quartiles according to the measured levels of each MetS clinical characteristic, with subjects in the upper quartile having the highest levels and those in the lower quartile having the lowest levels. In the current study, we used two different methods to evaluate the importance of IR with respect to the MetS. First, we compared the SSPG quartiles within individual MetS clinical characteristics. Then, since there were six mean SSPG values derived from each clinical characteristic (i.e., BMI, systolic blood pressure [SBP], diastolic blood pressure [DBP], FPG, TG, and HDLC), we further compared the SSPG values derived from all clinical characteristics.
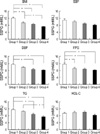
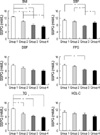
The results of comparisons of the four quartiles for males and females are shown in Fig. 1, 2, respectively. In males, the upper quartiles from the BMI and FPG clinical characteristics had the highest SSPG levels as compared to the other three quartiles. The upper quartiles of the DBP and TG clinical characteristics were only greater than the lower two quartiles. In females, the SSPG levels in the upper quartile of the BMI and TG clinical characteristics were significantly greater than the other lower three quartiles. While the SSPG levels were highest in the SBP and FPG clinical characteristics, they were only higher than the third quartile (Fig. 2).
In order to evaluate which of the highest quartiles representing any of the MetS clinical characteristics had the highest SSPG levels, we further compared the upper quartiles of the BMI, SBP, DBP, FPG, HDLC, and TG clinical characteristics. No significance was found with respect to gender (Fig. 3), except the SSPG level was greater in the upper quartile of the BMI clinical characteristic than in the upper quartile of the HDLC clinical characteristic (12.37±0.47 vs. 9.52±0.52 mM/L, respectively) in males (Fig. 3).
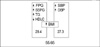
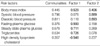
Finally, Table 2 displays the results of factor analysis of core metabolic variables among the study subjects. Fig. 4 graphically depicts the same results with the percentage of variance explained by each factor. A two-factor solution, which was supported by the retention criteria described in the method, was obtained. These factors could be interpreted as 1) a "insulin resistance" factor, with a positive loading of BMI, FPG, TG, SSPG and an inverse loading of HDLC, and 2) a "blood pressure" factor with a positive loading of BMI and both the SBP and DBP. The two-factor solution explained about 56% of the total variance in these subjects (28.4% factor 1 and 27.3% factor 2).
DISCUSSION
The data herein showed that, in general, the trend of higher SSPG levels was associated with more MetS clinical characteristics (Fig. 1, 2). However, only the BMI, FPG, and TG in both males and females, DPB in males, and SBP in females had significantly higher SSPG levels in the upper quartile as compared to the lower quartiles. These results suggested that among the five clinical characteristics of the MetS measured, BMI, FPG, and TG might be best related to IR and therefore, are the first clinical characteristics to be detected as abnormal. Similar findings have been reported by others. For example, Cheal et al. found that among all the MetS clinical characteristics, BMI and TG were best correlated with SSPG (14). By using factor analysis to evaluate the relationships between MetS clinical characteristics and IR, Meigs et al. also arrived at the same conclusion. Thus, he further suggested that IR should be the central focus in assessing the MetS (8).
The significant effect BMI had on IR in our study was not surprising. It has been long-recognized that IR is clearly associated with obesity, whether generalized or central (15-17). The detrimental influence of central adiposity on IR is thought to be mediated by intra-abdominal fat deposition, in which hypertrophied adipocytes are resistant to anti-lipolytic action of insulin. As a consequence, elevated levels of free fatty acids may induce IR in the peripheral tissues and liver (18). Also, the preponderance of enlarged fat cells, as occur in abdominal obesity, may increase the risk of glucose intolerance and hypertriglyceridemia and thus account for the metabolic derangements (19, 20).
It is interesting to note that the relationships between IR and some of the MetS clinical characteristics were affected by gender. In our study, for example, the upper quartile of DBP in males had significantly higher SSPG levels than the lower three quartiles. In contrast, instead of DBP, the SSPG was higher in the upper quartile of SBP in females. These results suggested that the relationships between blood pressure and SSPG were less consistent in our study. It is difficult to meaningfully compare this finding with other reports, since most of the other reports adjusted both sex and age when discussing the relationships between blood pressure and IR (17, 21, 22). Other than blood pressure, the relationships between IR and HDLC were also different between the genders. Fig. 1, 2 show that the levels of SSPG did not differ between any quartiles representing the HDLC clinical characteristic. However, as illustrated in Fig. 3, when comparing the upper quartiles of all the MetS clinical characteristics, the upper quartile of the HDLC clinical characteristic had the lowest SSPG level, but was only significant in males. It is well-recognized that IR is related to high TG and low HDLC (23, 24); however, most of these reports showed that gender had no effect on the relationships involving IR. Nevertheless, some reports did demonstrate a gender effect. For example, Mykkanen et al. found that IR was more strongly related to HDLC in males than females, as evidenced by the intravenous glucose tolerance test (24). This unique finding was further confirmed in another study conducted in subjects with morbid obesity. The correlations between IR and TG or HDLC were stronger in males than in females (25). These data are consistent with the findings reported herein. Since both HDLC and SBP were shown to be related to SSPG levels in males, our data further imply that males might be more prone to develop MetS when in middle age, as suggested by Cook et al. (26). At present, there are two possibilities to explain the metabolic differences which existed between males and females in our study. First, IR may be increased by sex hormones (27). This in turn will further increase the risk of cardiovascular disease and diabetes (28, 29). Second, male subjects tend to have more upper truncal adiposity (i.e., a higher waist-to-hip ratio [WHR]) than female subjects. In the current study, since we observed differences between each MetS clinical characteristic, we did not adjust the effect of BMI on other risk factors, which is a departure from other studies (23-25).
It is generally agreed that there is a positive correlation between blood pressure and IR. Using the euglycemic insulin clamp, this relationship has been repeatedly demonstrated in many different studies (17, 21, 22). For instance, Ferrannini et al. reported that male gender, age, and IR were independently associated with SBP, whereas DBP was related to age, IR, and FPI, but not to the BMI (17). They also found that DBP had a higher correlation with IR than SBP (r=0.34 and 0.18, respectively). However, the same conclusion was not always reached in studies involving other ethnic groups (30) and the relationships did not exist when adjusted for body fat content (31). The discrepancies of these results may be due to the fact that blood pressure per se is not clustered with IR. Other possibilities such as the different ethnic groups or the methods used to measure adiposity might also play a role. In the Ferrannini et al. study, and as done herein, BMI was used to quantify adiposity. At the same time, Toft et al. used WHR and suggested that in subjects with the same BMI, changes in WHR may still influence the results of variables associated with insulin sensitivity because the accumulation of visceral fat leads to altered insulin clearance (31). In the Peiris et al. study, the clearance rates of insulin were similar between obese and non-obese subjects (32); however, it was inversely correlated with the WHR in obese subjects. Therefore, Peiris et al. pointed out that WHR is better associated with diminished insulin clearance than BMI (32).
It has been shown that the homeostasis model assessment of IR (HOMA-IR; 33, 34), which is calculated from FPG and FPI, is a useful surrogate for IR in healthy and diabetic subjects. It has proven to be highly correlated with the gold standard, the euglycemic hyperinsulinemic clamp (33). At present, it is generally recognized that one of the main underlying pathophysiologies of glucose intolerance is IR. However, in subjects who already have IR, due to the compensatory increased secretion of the insulin, the FPG may persist within the normal range. That is why the study done by Hollenbeck and Reaven showed that there was no relationship found between FPG and IR (35). On the contrary, the correlation between FPI and IR was significant in normal glucose tolerance subjects. Surprisingly, in our study, the SSPG seemed to be higher as the FPG increased. This finding suggested that even in the early stages before MetS develops, FPG is already elevated in subjects with an elevated IR.
The results of the factor analysis are similar to most of the other studies. In these studies, usually there are three to four factors being identified; the "insulin resistant factor", "obese factor", "lipid factor", and/or "blood pressure factor" (8, 9, 13, 36-39). To the present, one of the most important studies using factor analysis to explore the relationship between IR and other common risk factors for cardiovascular diseases was published by Hanley et al. (40). Instead of SSPG, they have used the intravenous glucose tolerance test to evaluate insulin sensitivity (SI). They have also identified two factors in the IGT and NGT subjects: the "metabolic factor" (comprising BMI, waist, SI, TG, and HDLC); and the "blood pressure factor". The only differences are FPG was not loaded in factor 1 and BMI was not loaded in factor 2. It could be noted that the clustering patterns in our study were not only similar to Hanley's study (40) but also to the most of other studies with different severities of impaired glucose metabolism and ethnic groups (13, 36, 38, 39). The clustering of the SSPG, BMI, FPG and TG could further confirm that the IR is more correlated with lipids profile and BMI, but less with the blood pressure. BMI is loaded in both factor also suggested its importance in the MetS.
It should be noted and emphasized that this was a hospital-based cohort study. A population-based study should be conducted to further confirm our findings. However, the purpose of this study was to observe the relationships between IR and MetS, thus, this drawback should not affect the conclusions drawn from the present study. Our data suggested that adiposity, higher FPG, and hypertriglyceridemia are more strongly associated with IR in Chinese subjects and the importance of these clinical characteristics should be reemphasized. This conclusion could also be supported by the results of factor analysis. When considering each of the MetS clinical characteristics, subjects with a higher BMI may have the highest IR.

 XML Download