

 PDF
PDF ePub
ePub Citation
 Print
Print


INTRODUCTION
Prader-Willi syndrome (PWS) is a contiguous gene syndrome that results from the non-expression of paternal alleles at the PWS locus; it is characterized clinically by uncontrollable hyperphagia, results in morbid obesity with the associated somatic and psychological problems (1-3). Several studies have confirmed that plasma ghrelin levels are markedly elevated in PWS adults (4, 5) and children (6, 7). Because ghrelin acutely stimulates food intake and GH secretion in rodents and humans, and because its chronic administration to rodents causes obesity (8-12), it is possible that the increased appetite in PWS might be due to the ghrelin level enhancement. However, a direct anorexigenic effect of ghrelin, in its physiologic range, has not been demonstrated in either rodents or humans to date. The study of anorexigenic hormones is of interest because appetite is also regulated by negative signals (13). Moreover, the response patterns of hormones to meals have not been examined in detail in patients with PWS.
Peptide YY (PYY), an anorectic peptide, is secreted postprandially from the distal gastrointestinal tract. Moreover, PYY3-36, the major form of circulating PYY, binds to the hypothalamic NPY Y2 receptor (Y2-R) with a high affinity, and has been shown to reduce food intake in rodents and humans (14-17). It has been reported that endogenous PYY levels are low in obese subjects, suggesting that PYY deficiency may contribute to the pathogenesis of obesity (18). Cholecystokinin (CCK) is an important feedback signal that controls meal size; it is released from intestinal endocrine cells both locally and into the plasma in response to the intraluminal presence of nutrient digestion products. CCK acts to coordinate the digestive process in both an endocrine and a paracrine/neurocrine manner by stimulating pancreatic and gallbladder secretions, inhibiting gastric emptying, and by modifying intestinal motility. In addition, CCK also plays a major role in satiety (19).
Insulin is a physiological and dynamic modulator of plasma ghrelin and glucose levels, and possibly mediates their effect on nutritional status (10). Moreover, it has been reported that insulin has an inhibitory effect on ghrelin secretion that is independent of plasma glucose levels, although these molecules may have additional effects (20, 21).
In this study, the 24-hr PYY, CCK, insulin and ghrelin profiles of children with PWS (n=4) were compared with those of age, gender, and BMI matched controls (n=4); the responses of these hormones to meals were evaluated.
MATERIALS AND METHODS
Subjects
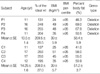
Four PWS patients (n=4, mean body mass index (BMI)=39±5.9 kg/m2, mean fat %=58.4±5.9%) and four age, gender and BMI matched controls (n=4, mean BMI=39±5.7 kg/m2, mean fat %=51.2±3.7%) were enrolled in the present study. Patients with diabetes mellitus (fasting plasma glucose >126 mg/dL with a 2-hr post-prandial glucose value of >200 mg/dL) were excluded. The patient clinical characteristics are detailed in Table 1. Informed consent was obtained from all participants or parents, as appropriate. The study design was reviewed and approved by the Samsung Medical Center Institutional Review Board.
For controls, several middle and high schools located in the southern part of Seoul were recruited. We explained the purpose of the study to teachers, and a written study protocol was sent to all parents. Of 23 volunteers, four controls were selected on the basis of age, sex, and BMI. All study subjects were males. We explained the purpose and methods of the study, and informed consent was obtained from all parents.
Experimental design
For this 24-hr study, all subjects were admitted to the Pediatric Ward at the Samsung Medical Center; they ate a standard hospital diet [meals served at 7:30 AM, 12:00 PM, and 18:00 PM, total calories 2100 calories consisting of 60% carbohydrate (310 g), 20% protein (100 g) and 20% fat (50 g)] and were allowed to sleep (lights-off) between 11:00 PM and 7:00 AM. During the remainder of the day, lights were on and sleeping and snacking were not allowed. Blood was drawn to measure hormones through an indwelling venous cannula and was collected in EDTA and SST tubes every hour for 24 hr without the addition of aprotinin. After taking a baseline sample, which was collected at 7:00 AM before breakfast, a total of 23 additional samples were collected at hourly intervals from each patient. Samples were stored at 4℃ during the collection period, centrifuged for plasma within two hours of collection, and stored at -70℃ until assayed.
Hormonal assay
Plasma immunoreactive ghrelin was measured in duplicate using a commercial ELISA kit (Phoenix Pharmaceuticals, Belmont, CA); the inter- and intra-assay coefficients of variance were <10%. The lower and upper detection limits for this assay were 0.75 ng/mL and 100 ng/mL.
Plasma immunoreactive PYY was measured in duplicate using a commercial ELISA kit (Peninsula Laboratories, Inc.); inter- and intra-assay coefficients of variance were <10%, and the assay detection range was 0-25 ng/mL. The antibody against human PYY(3-36) exhibited 100% cross-reactivity with full-length PYY.
CCK was measured by radioimmunoassay using synthetic CCK8 (sulphated) [Bachem] as a standard, antibody code R7 (3) (final dilution 1:100,000); the intra-assay CVs were 8.2 and 6.6% at 5 ng/L and 15 ng/L, respectively, and the inter-assay CVs were 13.3 and 11.5% at 5 ng/L and 15 ng/L, respectively, with a lower detection limit of 1.5 ng/L.
Serum insulin was measured using a commercially available immunoradiometric assay kit (BioSource Europe S.A.) with a detection limit of 1 µIU/mL and intra- and inter-assay coefficients of variation of <10%.
Statistical analysis
All values are expressed as means±SE. Repeated measures of ANOVA was used to compare the 24-hr hormone profiles of the two groups. Increments or decrements in areas under the curve (AUC) for each hormone profile (from 7:00 AM to 10:00 AM) were calculated using the trapezoid method after subtracting the basal AUC from the calculated AUC, and Mann-Whitney test was used to compare them between the two groups. p values of <0.05 were regarded as statistically significant. All statistical analyses were performed using SAS version 8.2 (SAS Corporation, Cary, NC).
RESULTS
The characteristics of the study subjects are detailed in Table 1. The PWS and control groups did not differ significantly with respect to age, % of ideal body weight, BMI, BMI percentile, or in terms of percent body fat as determined by a dual energy absorptiometry (DEXA).
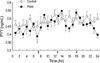
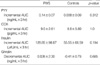
Twenty-four hour PYY levels are illustrated in Fig. 1. Repeated measures of ANOVA of PYY levels showed no significant difference between the two groups (p=0.06). There was no significant group×time interaction (p=0.68). Therefore, the PYY levels were similar in the two groups over 24 hr; their PYY responses to meals were also similar, and increases in the AUC of PYY after breakfast (7 AM-10 AM) were not significantly different in comparisons between PWS (0.14±0.14 ng/mL×3 hr) and controls (0.008±0.18 ng/mL×3 hr, p=0.31) (Table 2).
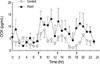
Fig. 2 shows the 24 hr CCK profiles. Repeated measures of ANOVA of the CCK profiles identified a significant difference between the two groups (p=0.0051) but without a significant group x time interaction (p=0.9311). These results indicate that the mean CCK levels were elevated over 24 hr, but that the CCK response to meals was not different in comparisons between the two groups. In addition, increments in AUC of CCK after breakfast (7 AM-10 AM) were not significantly different (Table 2). We interpreted these results to mean that although there was an elevation in the mean CCK levels over 24 hr, the CCK response to meals was not significantly different in comparisons between the two groups.
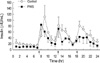
Twenty-four hour insulin levels are shown in Fig. 3. The repeated measures of ANOVA of the insulin levels demonstrated a significant difference between the two groups (p= 0.013), but there was no significant difference between the two in terms of group×time interaction (p=0.85). These data show that insulin responses to meals were similar in the two groups; however, the levels of insulin over 24 hr were relatively lower in the PWS patients. Increments in the AUC of insulin after breakfast (7 AM-10 AM) were similar in the two groups (Table 2).
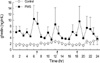
In addition, we measured the 24-hr ghrelin levels; they were higher in PWS than in controls (p=0.0007). However, no significant difference was found in terms of the group×time interaction (p=0.89) or between decrements in the AUC of ghrelin after breakfast (7 AM-10 AM, Table 2). These results show that ghrelin suppression after meals was similar in the two groups (Fig. 4).
DISCUSSION
Our results show that the response pattern of CCK, PYY, insulin and ghrelin to meals in PWS patients was not different from that of controls. In addition, we demonstrated that only insulin levels decreased (p=0.013), while the other hormone levels either increased or did not change. Therefore, reduced mean levels of insulin as well as elevated mean levels of ghrelin were the major results in the PWS patients.
It has been repeatedly reported that plasma ghrelin is elevated in both adults and children with PWS, which is in contrast to the ghrelin levels found in other causes of obesity, where ghrelin levels have been shown to be decreased (4, 22). Based on rodent and human studies elevated ghrelin levels might be associated with an increase in appetite, (8-11) although the direct orexigenic effects of ghrelin, in its physiologic range, have not been demonstrated in rodents or humans. However, studies showing an increased appetite in PWS are insufficient without an understanding of the effects of anorexigenic hormones; this is because appetite is also negatively influenced by several hormones. Thus, if anorexigenic hormones are reduced, the increased appetite associated with PWS could be explained by another mechanism. However, these hormones fluctuate widely after meals. Thus, a single determination of hormone levels in a given day is not adequate for understanding appetite-related hormonal changes in PWS.
CCK levels in PWS have been reported several times. One report emphasized a significant increase in serum CCK levels during meals in PWS patients, indicating that a failure of peripheral CCK release in response to food intake does not explain the impaired satiety response in PWS (23); however, two additional reports did not find CCK elevation in PWS (24, 25). In our study, hourly CCK monitoring data suggested that CCK secretion in response to a meal was similar in PWS patients and in controls. However, we did note an elevation in serum CCK levels in PWS. These results showed that in PWS the failure of peripheral CCK release, in response to food intake, cannot explain the impaired satiety response. Our data suggest that anorexigenic hormones may potentially influence the gastrointestinal tract peripherally and appetite centrally. Recently, we reported that gastric emptying in PWS was not elevated, and that actually it tended to be delayed, despite the presence of higher ghrelin levels, which generally promote gastric emptying (26). CCK may potentially delay gastric emptying; however, further evidence is needed to confirm this.
Batterham et al. reported that the gut hormone fragment peptide YY3-36 reduces appetite, food intake, and plasma ghrelin levels when infused into both normal weight and obese subjects (18, 27). Endogenous PYY levels were depressed in obese subjects, and the fasting PYY levels were found to correlate negatively with BMI (26).
Moreover, plasma PYY levels in PWS were reported to be lower than those of similarly aged individuals without PWS; however, other reports did not confirm this (28, 29). In the present study, we observed that these hormones fluctuate widely according to meal times; however, we found no significant difference between the PWS patients and controls in regard to the PYY levels. Our data shows that PYY response to meals and basal PYY levels are similar in PWS patients and normal controls; this suggests that a failure to secrete PYY in response to food is not an explanation for the impaired satiety response observed in PWS. Our data are consistent with the recent observation that there is no deficiency of the anorexigenic intestinal hormone PYY in PWS (29).
As for insulin, we observed lower insulin levels in PWS than in controls over the 24-hr monitoring period. This finding is consistent with previous reports, which found that insulin resistance is lower in PWS subjects, and that insulin sensitivity is higher than in obese controls (30-33). Unfortunately, we did not measure the 24-hr serum glucose profile, which is a limitation of this study. However, because fasting and post-prandial two-hour glucose levels were normal in all subjects and standard hospital diet was served to all of them, this limitation may not have influenced our results.
Recently, it was reported that deficits in insulin and glucagons, during fetal and postnatal life, are prominent findings in the TgPWS deletion mouse model, and that a pancreatic defect may be the primary lesion (34). Consistent with these findings is the presence of type 2 diabetes in PWS, which may partly result from the lowered insulin levels observed compared to the expected levels for the degree of increased body mass index (35-37). In addition, this model showed that increased plasma ghrelin levels occurred in the postnatal TgPWS mice and appeared to begin at the onset of severe hypoglycemia; this suggests that the hyperghrelinemia, observed in PWS, might be a physiological adaptive mechanism of increased eating in response to hypoglycemia (32). However, insulin alone is insufficient to lower the ghrelin levels to control levels, i.e., the ghrelin baseline in PWS was almost always higher than in controls. Therefore, elevated ghrelin levels may be explained by at least two mechanisms, i.e., by insufficient insulin levels and by an adaptive response to hypoglycemia during the postnatal period. However, the precise mechanism of hyperghrelinemia in PWS remains to be determined.
In conclusion, our results suggest that the response pattern of hormones to meals in PWS patients parallels that of normal controls. In addition, a decrease of the insulin level over 24 hr, in spite of obesity and elevated ghrelin levels, suggests that the baseline insulin level, not the insulin response to meals, may be the important abnormality in PWS.
 XML Download