

 PDF
PDF ePub
ePub Citation
 Print
Print


INTRODUCTION
Bronchial asthma is the most common chronic respiratory disorder, and is characterized by the hyper-responsiveness of the tracheobronchial tree to a multiplicity of stimuli. The prevalence of bronchial asthma is rising in many industrialized parts of the world, and air pollution may be a cause of this increasing prevalence (1).
Air pollution plays a major role in the pathogenesis of asthma, and many studies have revealed that air pollutants such as ozone (O3), nitric oxides (NOx), sulfur dioxide (SO2), carbon monoxide (CO), particulate matter (PM), and environmental tobacco smoke (ETS) produce adverse effects on the symptoms and pulmonary function of both asthmatic and non-asthmatic subjects. In addition, increased levels of these air pollutants have been associated with increased emergency department admissions (2-4).
Ozone is known to cause allergen-induced inflammation by initiating a Th2 response or by exacerbating airway inflammation in patients who are already sensitized to an allergen (5-7). Ozone is a by-product of atmospheric reactions that require nitrogen oxide, volatile organic compounds such as hydrocarbon, and ultraviolet light. Automobile exhaust is the most significant source for outdoor nitrogen dioxide (5). Thus, ozone is elevated in urban areas with a heavy traffic volume and substantial amount of sunlight. Studies on the association between the ozone concentration and the clinical manifestations of asthmatics have been performed, but the ozone concentrations have all been measured in specific downtown area locations where one would logically predict a higher ozone concentration. In addition, with the expansion of automobile traffic, the modern boundary of higher ozone concentrations is not limited to a specific area but is much broader, beyond the limits of downtown air monitors. Thus, ozone concentrations measured by air monitors in downtown areas may not reflect the actual ozone concentration to which asthmatics are exposed and cannot adequately explain the changes in symptoms and lung function parameters of patients with asthma.
Developing regions often face critical air pollution problems because of rapid growth in traffic volume and population density. Recently, the midsection of Korea has become increasingly urbanized, and some regions have begun to face air quality problems. Using a passive ozone sampler, we measured the individual levels of ozone exposure of asthmatics in two medium-sized cities in Korea and evaluated the effects of the measured ozone concentration on the symptoms, pulmonary function parameters, and medication use of the asthmatics.
MATERIAL AND METHODS
Study population
Twenty asthmatics who were residents of Cheonan or Cheongju were recruited from 3 June to 18 July 2005, and the ozone concentration to which each person was exposed was measured for 31 days. All the subjects were given personal logs and pocket peak flow meters to record peak expiratory flow (PEF) and changes in asthma symptoms or medication use on a daily basis during the same period. All the patients had been diagnosed with bronchial asthma according to the guidelines of the American Thoracic Society (8) and had been managed for at least 2 months without changes in their medication before they were enrolled to this study. Ten patients were registered at Dankook University Hospital in Cheonan city, and the other ten patients were registered at Cheongju St. Mary's Hospital in Cheongju city. Patients with active pulmonary infection, lung cancer, congestive heart failure, or chronic renal failure or who were active smokers were excluded from the study. Asthmatics taking oral or systemic corticosteroid were also excluded.
All subjects underwent a bronchodilator test and ten patients underwent a methacholine provocation test to confirm reversible airflow limitation and airway hyperreactivity. A skin prick test was performed according to the individual clinical manifestations, and baseline PFT were obtained before subjects were enrolled. Thirteen patients were severe-persistent and seven patients were moderate-persistent in terms of severity, as classified by the symptoms, pulmonary function, and treatment according to the 2002 GINA guideline. All the subjects had been managed with medications, such as inhaled corticosteroids, long-acting β2-agonists, and oral theophylline, according to the severity of their asthma before they were enrolled. The subjects were allowed to use relief medication, such as a short-acting β2-agonist, when they experienced episodic symptoms of cough, sputum, wheezing, shortness of breath, morning chest tightness, or other asthma symptoms. A questionnaire that included demographic data, medical history, medication use, and smoking history was provided to each study subject, and personal logs were provided so the subjects could record any of their respiratory symptoms and additional symptoms. The personal logs were accepted for analysis if the data covered at least two-thirds of the study period. Informed consent for the study protocol was obtained from all patients, and the study motocol was approved by the ethics committee of Dankook Medical Center.
Ozone concentration measurement
A passive sampler (ozone PSs; R&D Center, Envors, Daegeon, Korea) was used to evaluate the ozone concentrations to which the subjects were exposed and p-acetamidophenol, which reacts specifically with ambient ozone to produce a fluorescent material, was used as the reagent in the passive sampler. This passive ozone sampler was developed to measure the ambient ozone concentrations at several sites, and field validation tests indicated that the results from the passive ozone sampler correlated (r=0.963) with a UV photometric O3 analyzer, which is the standard equipment used for measuring ambient ozone concentrations in Korea (9). The passive samplers were distributed to the study subjects, and the subjects were told to attach a new sampler to their clothes every day and to return the ozone samplers to the hospital at least every 15 days. The samplers were then delivered to the R&D Center of Envors and analyzed using a fluorescence spectrometer (Hitachi F2500, Tokyo, Japan).
Patient log of asthmatic and allergic symptoms
Study subjects were asked to record the degree of their asthma symptoms (cough, sputum, wheezing, shortness of breath, morning chest tightness), and other symptoms (rhinorrhea, ocular irritation, and febrile sensation) at the end of each day. The patients subjectively graded their symptoms as none, mild, moderate, or severe and recorded the grade as a number, 0, 1, 2, or 3, respectively. The total asthma symptom score was obtained by adding each daily asthma symptom score and used to analyze the statistical relationship between the subject's ozone concentration exposure and asthma symptoms. The frequency of using relief medications was also recorded.
Measuring pulmonary function
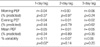
The subjects were taught a standard method for using a pocket peak flow meter and were asked to take PEF measurements in triplicate in the morning and evening during the study period. The highest of the three values was recorded. The mean PEF and PEF variability were derived and calculated from the patient's log according to the following formulas:
Mean PEF=(Morning PEF+Evening PEF)/2
PEF variability=2×100 (%)×(Maximum PEF-Minimum PEF)/(Maximum PEF+Minimum PEF)
Statistical analysis
To define the associations between the ozone concentration and the degree of symptoms, pulmonary function parameters, and the frequency of reliever medication use, we obtained daily average levels of ozone from a passive ozone sampler, which was distributed to each study subject. Each subject's morning PEF, evening PEF, mean PEF, and percent variability in PEF were measured on a daily basis during the study period to gauge the pulmonary function. The ozone concentration was compared with each pulmonary function parameter on the current day and for 1-, 2-, and 3-day lags because the bronchial responses of asthmatic patients to ozone can be delayed. To evaluate the influence of ozone on the degree of asthma symptoms, total asthma symptom scores as well as each symptom score were compared with the level of ozone concentration on the current day. Furthermore, we evaluated the frequency of reliever medication use based on the ozone concentration in the same manner. SPSS version 11.5 (SPSS, Chicago, IL, U.S.A.) was used for data analysis, and Pearson's correlation analysis and Spearman's rho were used for statistical comparisons.
RESULTS
Subjects
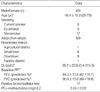
Twenty subjects were enrolled in the study, but three subjects were excluded because their data did not cover two-thirds of the study period. Consequently, 17 subjects (8 male, 9 female; mean age: 45.4±15.3 yr) were included for analysis. The skin prick test was positive for more than one allergen in eight subjects. Bronchodilator tests were all positive and the mean geometric PC20-methacholine was 3.24±2.03 mg/mL. The ozone concentration, which was analyzed by a fluorescence spectrometer (Hitachi F2500), showed that the average daily ozone concentration during the study period was 28.2±23.6 (3.4-315.3) ppb. Baseline demographic data, including baseline pulmonary function measurements, are presented in Table 1.
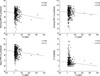
Correlation of changes in pulmonary function with ozone exposure
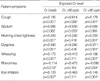
To define the relationship between the ozone concentration and changes in pulmonary function, we compared the individually measured ozone exposure levels to each pulmonary function parameter, including the morning PEF (% predicted), evening PEF (% predicted), mean PEF (% predicted), and PEF (% variability). When the relationships between the PEF and ozone levels in general or individually on the current day were analyzed, no statistically significant correlation was found, although the morning, evening, and mean PEF values had a decreasing tendency according to the level of ozone concentration (p>0.05; Fig. 1). The data were also similar when the pulmonary function parameters associated with two extreme ozone levels (228 and 315.3 ppb) were excluded. The level of ozone concentration with each pulmonary function parameter on 1-, 2-, and 3-day lags was compared to evaluate any delayed effects of ozone on asthmatic airways. Although the PEF (% variability) for the 1-day lag was statistically significant, it was not relevant clinically (r=-0.11, p=0.02; Table 2). In addition, the correlational analyses between the ozone concentration and other pulmonary function parameters for the 1-, 2-, and 3-day lags did not show any significant differences (Table 2).
Correlation of asthma symptoms with ozone exposure
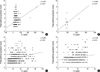
Total asthma symptom scores according to the daily average level of ozone on the current day were analyzed to define the association between the ozone concentration and the level of asthma symptoms. Although there was no significant correlation between the level of ozone concentration and PEF, the total asthma symptom score increased when subjects were exposed to a higher ozone concentration. Correlational analysis revealed that there was a weak, but statistically positive, correlation between the level of ozone concentration and the total asthma symptom score (r=0.303, p<0.001; Fig. 2A). In addition, when the influence of ozone concentrations above and below 80 ppb on the total asthma symptom scores was evaluated, a significant positive correlation was noted when exposed to ozone levels above 80 ppb (ρ=0.582, p=0.037; Fig. 2B), and there was a weak positive correlation when exposed to ozone levels less than 80 ppb (ρ=0.298, p<0.001; Fig. 2C). The strength of the positive correlation decreased with the exposed ozone concentration (Fig. 2D). There was no statistically significant correlation for the 1-, 2-, or 3-day lags (p>0.05). Each asthma symptom, nasal symptom, and ocular symptom was also analyzed, and the correlation analysis revealed weak positive correlations for morning chest tightness and dyspnea with the exposed ozone in general (Table 3). These results suggest that the degree of asthma symptoms is influenced by the level of ozone concentration exposure, even at ozone concentrations below 80 ppb.
Correlation of the frequency of inhaler medications use with ozone exposure
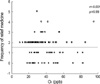
Although the total symptom score was influenced by changes in the level of ozone concentration, a statistically significant correlation between the level of ozone exposure and the frequency of reliever medication use was not observed (r=-0.001, p=0.99; Fig. 3).
DISCUSSION
Although numerous studies have examined the effect of ozone on asthmatics, the ozone concentrations were measured in specific areas without considering the individual's site-specific ozone exposure level. Our study examined the on-site level of ozone and the influences of daily personal ozone exposure on the symptoms and lung function in asthmatics; to our knowledge, no other study has used subject-borne passive ozone samplers. The on-site measured level of ozone was not high in the midsection of two medium-sized cities in Korea.
Some articles have suggested that there is a time lag between increased ozone levels and their effects, and the development of airway inflammation in response to ozone exposure might occur during this time lag (10). In addition, one study found a statistically significant association between emergency room visits and mean O3 levels, on the day of admission and also on days 2 and 3 (11). In contrast to most of the studies that have already been performed, changes in the level of ambient ozone did not induce significant changes in the PEF or PEF variability for the current day or 1-, 2-, or 3-day lags in our study. These results may have occurred because the average ozone concentration during our study was only 29.4±24.4 ppb, whereas the level of ozone in the prior studies was higher, at least 100 ppb.
However, the total asthma symptom scores had a linear association with the ozone concentration. Our data showed that as the level of ozone exposure increased, the total symptom score increased, and this increase in the total symptom score was observed even at ozone concentrations below 80 ppb; however, the symptoms might not have been severe since there was no increase in reliever medication use. The strength of the correlation decreased with the decrement in the exposed ozone level. This level of ozone concentration has been previously considered to be too low to cause respiratory symptoms in non-asthmatics. The results suggest that asthma symptoms are provoked or aggravated by the ozone concentration, even at concentrations below 80 ppb, at least in patients with moderate to severe persistent asthma. There is also a chance that the quality of life for asthmatic patients is being deleteriously affected by these low levels of ozone.
Numerous studies have already documented the effects of ozone on asthmatics, such as increases in morbidity, emergency department visits, mortality, and the prevalence of asthma. During the 1996 Olympic Games in Atlanta, a 13% reduction in the ozone concentration reduced acute asthmatic events in children, and increases in daily acute asthmatic events was associated with levels of the 1-hr ozone concentration from 60 to 89 ppb (12). Summer asthma camp studies, seeking to define the association between daily ozone levels and lung function, have also observed linear decreases in the PEF and FEV1 associated with 1-hr ozone concentrations. This study showed that a 0.5% decrease in the PEF accompanied a 15 ppb increase in ozone (13). The influence of ozone is more profound in patients with persistent asthma. A study involving patients with persistent asthma who had been taking maintenance medications revealed that patients with persistent asthma were more vulnerable to ozone and that an 8% increase of coughing in children with persistent asthma accompanied a 50 ppb increase in the ozone level on the current or previous day (14). Repeated exposure to ozone at a peak ambient air level can enhance the inflammatory responses to inhaled allergens in subjects with preexisting allergic airway disease (15). The exposure of subjects with mild allergic asthma to an ozone level sufficient to cause modest decreases in lung function increased the reactivity to allergens (16).
Many studies have attempted to determine the underlying mechanisms of the harmful effects of various pollutants. Ozone has been found to induce a neutrophilic inflammatory response in the airway that can persist up to 24 hr after exposure (17). Recent research has focused on the specific effects of various pollutants at clinically relevant levels of exposure in susceptible individuals. Some studies investigated the effects of ozone exposure in subjects with mild asthma who had a prior allergen challenge and found that the percentage of eosinophils was significantly higher after exposure to ozone, suggesting that ozone exposure potentiates the eosinophilic response of the airways induced by allergen inhalation in patients with asthma (18). Furthermore, a study on bronchial cytokine expression induced by ozone exposure in both healthy and asthmatic subjects showed significantly increased expression levels of interleukin (IL)-5 and granulocyte macrophage colony-stimulating factor in the asthmatic group (19). These results imply that a worsening of airway inflammation can be caused by up-regulation of Th2-related cytokines when exposed to clinically relevant ozone levels, and this response is only found in the asthmatic airways. Recently, some studies have suggested that the effects of ozone can be amplified by co-exposure with urban dust, such as carbon black particles in diesel exhaust. The carbon black particles possibly act as a carrier for ozone to distal lung areas that are not usually accessible to ozone in the gaseous phase, or the ozone might alter the physicochemistry of the particulates from a nontoxic to a toxic form (20). According to a study using a mouse asthma model, methacholine-induced Penh and interleukin (IL)-4, neutrophils, and eosinophils in BAL fluids increased more in the allergen (OVA)-sensitized-challenged and the ozone and diesel exhaust particles (DEP) exposure group than in the allergen (OVA)-sensitized-challenged and ozone exposure group (21). These findings suggest that ozone and DEP have an additive effect on airway hyper-responsiveness in murine asthma models and that the mechanism responsible for increased hyper-responsiveness contributes to the Th2 immune responses (21). Since our results were analyzed according to the individual on-site ozone concentrations, the results would not reflect the effects of other air pollutants, including PM, NO2, and SO2. Therefore, the changes in the asthma symptoms in our study might have been overestimated or biased. In summer, the concentrations of air pollutants other than ozone are relatively low. The levels of SO2, NO2, and PM10 during the study period were well below the national standards. The respective monthly averages of SO2, NO2, and PM10 in June were 0.004 ppm, 0.018 ppm, and 61 µg/m3 in Cheonan and those for Cheongju were very similar (22). Considering the levels of these air pollutants during the study period were relatively low, it is unlikely that the association between ozone and respiratory symptoms was confounded by other air pollutants like SO2, NO2, and PM10.
Our study has some limitations. Due to the small study population and short study period, the results cannot be generalized to all asthmatics. The relationship between the measured ozone levels and the asthma symptom scores do not fully reflect individual patient's characteristics because the data were not analyzed individually. In addition, all of the subjects were severe asthmatics using medications before and during the study period. This medication use could have masked the inflammatory responses of asthmatic airways on exposure to ozone and might be one of the reasons our results did not show changes in pulmonary function parameters or relief medication use.
Although there are some limitations to our study, the results suggest that exposure to ozone concentrations lower than 80 ppb influences the symptoms of patients with moderate to severe asthma, regardless of the changes in pulmonary function or frequency of relief medication use.
 XML Download