

 PDF
PDF ePub
ePub Citation
 Print
Print


INTRODUCTION
Since Mixter and Barr found that compression of the nerve root by disc herniation could be a major cause of low back pain (LBP) (1), many diagnostic approaches including myelography, epidurography, and discography had been extensively used to demonstrate the mechanical factors which might compress the nerve roots (2). Introduction of modern neuroimaging techniques which can visualize the internal structures of the spine, however, replaced the old techniques rapidly because of its non-invasiveness and superior imaging quality. Especially, high resolution magnetic resonance imaging (MRI) or computerized tomography (CT) seems to be an efficient way to find the pain source in the patients suffering from LBP. Consequently, based on the imaging findings on MRI, most spinal surgeons perform operations with high confidence (3, 4). Furthermore, MRI facilitates the decision making on spinal pain, hence encourage extensive use of spinal operation (5).
On the other hand, analysis of spinal operations revealed that incidence of failure after spinal operation is not decreasing despite wide application of modern neuroimaging techniques (6, 7). Boos et al. investigated abnormal findings of MRI in the patients with disc disease and asymptomatic volunteers (8). Surprisingly, MRI examination showed disc herniation (76%) and extrusion (13%) in volunteers, even though they did not have any evidence of back pain. It implies that MRI is an excellent method to show the structural abnormality in the spinal canal, yet it does not indicate the pain source (9-11). Therefore, surgical decisions solely based on imaging findings are likely to lead to failure in back surgery. Recent studies revealed that discogenic pain is caused not only by mechanical compression of disc herniation, but also by chemical factors which are irritating dorsal root ganglion and spinal root (12-14). Structural damage in the disc and disruption of annulus fibrosus release the chemical substances such as phospholipase A2 and other cytokines including tumor necrosis factors into the spinal canal and provoke spinal pain (15). In line with these ideas, necessity of new techniques which can demonstrate the physiological source of pain as well as visualize the internal structure of disc is highly demanding.
Discography has been widely used to evaluate LBP (16-19). In the beginning, morphological change which can be demonstrated by injection of contrast media was a major concern in interpreting the results of discography. However, modern discography is performed to identify the concordant pain response when contrast media injected into the disc. Subsequent post-discography CT can demonstrate the extent of fissures which are created by annular tears (20). Recently, pressure-controlled manometric discography is reported to be useful to decrease the false positive results (21-23). We investigated patients with suspected discogenic pain to determine pressure-volume relationships among morphologically abnormal discsand to determine diagnostic relevance of pressure controlled discography in clinical decision-making.
MATERIALS AND METHODS
Patient population
A total of 21 patients with clinically suspected discogenic LBP who underwent pressure-controlled discography between April 2004 and December 2005 were included in this study. All patients had more than 6 weeks of unremitting LBP despite appropriate conservative management. There were 12 men and 9 women, with a mean age of 52 yr (range, 23-81). All patients were interviewed by a pain-specialized nurse who recorded pain distribution, nature of pain and pain-related dynamic factors. Indication to discography in this study is as follows: 1) patients with midline back pain and radicular symptoms, 2) patients with midline LBP, 3) patients with LBP, confirmed not to have pain source in zygapophyseal joint or nerve root, 4) multiple disc herniations on neuroimaging, 5) patients requiring confirming whether recurrent herniation or epidural fibrosis is causing spinal pain. Patients who have obvious evidence of herniation and extrusion of disc on neuroimaging with corresponding neurological sign were not included, for their surgical decision can be accurately made without discography. Also, patients who had multiple spinal operations (more than three times of operation), rheumatism, collagen and vascular disease are not included in this study.
Discography technique
All patients had discography in the operating room under the guidance of C-arm image intensifier (Series 9600, GE OEC medical systems, UT, U.S.A.). Every patient was instructed to stop using their pain medications on the day of the procedure to assure higher diagnostic accuracy. Intravenous antibiotics were administered 30 min before the procedure. The patient was placed in prone position with blood pressure and EKG monitoring. The patient's lower back was prepared and draped in sterile fashion. For L2-5 disc puncture, the fluoroscope was adjusted to visualize the superior endplate of the inferior vertebra, and rotated until the superior articulating process (head of "Scotty dog") is centered midway between anterior and posterior aspects of vertebral body. A 25-guage, 6-inch needle was introduced just anterior to superior articular process and positioned in the middle of internal disc. For L5-S1 disc puncture, the fluoroscope was caudally angled to visualize a triangle formed by superior articular process of the S1 vertebra, sacral ala, and the inferior endplate of L5. A discography needle was introduced through this entry triangle, and it was positioned in the exact center of the disc. Then, nonionic contrast medium (Iopamiro, Ilsung Pharmaceuticals, Seoul, Korea) was injected into each disc using a manometric syringe (Atrion QL 1015, Atrion Medical Products, AL, U.S.A.). The patient was asked to describe the nature, distribution, and intensity of pain on a 0-10 visual analog scale (VAS) when he or she subjectively perceived pain. Intradiscal pressure was continuously monitored during the procedure. We used the criteria of discography procedure of Derby et al. (21-23). The opening pressure was defined when the first contrast media was visualized from the tip of needle by fluoroscopy (21-23). As each subsequent 0.5 mL of contrast medium was injected, the pressure, location of contrast medium, and pain responses were recorded. Injection was continued until one of the following end points was reached: 1) the subject reported pain ≥6 VAS; 2) an intradiscal pressure of greater than 100 psi; or 3) a total of 3.0 mL contrast medium had been injected. The pressure and injected volume at which pain was initially evoked were recorded. Also, the VAS scores at 10, 30, 50 psi above opening pressure were recorded. After the procedure, patients were moved CT scan (SOMATOM Sensation 4, Siemens, PA, U.S.A.) room to check post-discography CT scan. Approximately three to four slices at 5-mm thickness and 4-mm intervals were checked at each disc level in axial view with simultaneous reconstruction of sagittal views.
Analysis of elastance and imaging findings
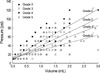
Elastance was defined as the unit change in pressure per fractional change in volume using linear regression. Elastance was measured and analyzed, correlating with the grading of annular disruption. Imaging of post-discography CT was used to grade the extent of annular disruption according to the modified Dallas discogram classification (20). Disc herniation and degeneration evaluated on MRI imagings were reviewed by one of the authors, and these analyses were confirmed by the other author who is blind to clinical background of the patients.
Pain response
The patients were divided into two groups on the basis of pain response; negative response (Neg-R), and positive response (Pos-R). Positive response was defined when patient described concordant or similar pain with pain intensity ≥6/10 VAS at pressures ≤50 psi above opening pressure and ≤3.0 mL total injected volume. Neg-R was required to have no pain or discordant pain with pain intensity ≥6/10 VAS at pressures ≤50 psi above opening pressure and ≤3.0 mL total injected volume.
Statistical analysis
Statistical analysis was performed with SPSS 11.0 software (SPSS, IL, U.S.A.). Statistical analysis for elastance was performed with ANOVA, sex ratio with chi-square test, and age, pain provocation on intradiscal pressure and pressure and volume of initial pain response with Student's t-test. All differences were regarded as significant if p<0.05.
RESULTS
Population characteristics
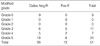
Discograms were performed on a total of 51 discs, L2-3 through L5-S1 from 21 patients. Among 51 discs, 38 (74.5%) satisfied negative response criteria, and were categorized as Neg-R group. Among 38 negative discs, 9 (23.7%) exhibited Grade 0 annular tears, 6 (15.8%) for Grade 3, 5 (13.2%) for Grade 4, and 18 (47.4%) for Grade 5 (Table 1). Among 51 discs, 13 (25.5%) satisfied positive response criteria, and were categorized as Pos-R group. Among 13 positive discs, 5 (38.5%) exhibited Grade 3 annular tears, 2 (15.4%) for Grade 4, and 6 (46.2%) for Grade 5 (Table 1).
Comparison of Pos-R and Neg-R group
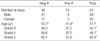
Sex ratio of the Pos-R group (M:F=1.6:1) was not statistically different from that of the Neg-R group (M:F=1.2:1, Table 2). Mean age of the Pos-R group (41.9±17.6) was significantly lower than that of the Neg-R group (55.1±16.8, p<0.02, Table 2). In the same modified Dallas discogram scales, mean age of the Pos-R group was lower than that of the Neg-R group, but it had no statistical significance (Table 2).
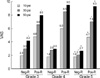
VAS scores in Grade 5 of the Pos-R group (4.7±1.5) were significantly higher than those of the Neg-R group (1.8±1.7, p<0.005, Fig. 2) at 10 psi. On the contrary, there were no significant differences in VAS scores in Grade 3 and 4 at 10 psi. VAS scores in Grade 5 of the Pos-R group (7.0±1.9) were significantly higher than those of the Neg-R group at 30 psi (2.1±1.6, p<0.001, Fig. 2), whereas there were no significant differences in VAS scores in Grade 3 and 4. VAS scores in Grade 3 and 5 of the Pos-R group (8.0±2.1, 9.3±2.0) were significantly higher than those of the Neg-R group at 50 psi (4.2±3.7, 2.7±1.8, p<0.05, p<0.001, Fig. 2), whereas there were no significant differences in VAS scores in Grade 4.
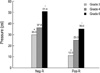
In Grade 3, the mean pressure that evoked pain in the Pos-R group (12.0±4.5 psi) was significantly lower than that of the Neg-R group (30.0±7.1 psi, p<0.001, Fig. 2). In Grade 5, the mean pressure that evoked pain in the Pos-R group (35.0±5.5 psi) was significantly lower than that of the Neg-R group (51.4±12.1 psi, p<0.01, Fig. 3).
The mean injected contrast media volume at which pain was initially evoked in Grade 3 was 0.8±0.3 mL in the Neg-R group, and 0.5±0.3 mL in the Pos-R group. The mean injected volume in Grade 4 was 1.6±0.1 mL in the Neg-R group, and 1.0±0.1 mL in the Pos-R group, respectively. The mean injected volume in Grade 5 was 1.9±0.7 mL in the Neg-R group, and 1.3±0.5 mL in the Pos-R group, respectively. However, there was no statistically significant difference between groups in Grade 3, 4 and 5.
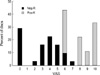
The intensity of pain responses differed significantly (Fig. 4) between the Pos-R and the Neg-R groups. Eighty-seven percent of the Neg-R group discs evoked less severe pain (VAS <6) at 50 psi, however, all of patients in the Pos-R group evoked significantly more severe pain (VAS ≥6).
Among 21 clinically suspected discogenic pain patients, 12 (57.1%) were diagnosed as discogenic pain, and 9 (42.9%) were diagnosed as non-discogenic pain. Among 12 patients diagnosed as discogenic pain, 5 received interbody fusion, 1 intradiscal electrotheramal treatment, 1 arthroscopic discectomy with posterior annular coagulation, and 1 open discectomy. Remained 4 patients refused any surgical treatments. Nine patients diagnosed as non-discogenic pain were encouraged to take different investigations for other sources of pain.
DISCUSSION
Discography armed with pressure-controlled technique and analysis of provoked pain response is emerging as an important diagnostic tool for clinical decision-making process (21, 22). Although there is no agreement on the mechanisms responsible for discogenic pain, it is more commonly accepted that discogenic pain is not caused solely by mechanical irritation of nociceptors. Recently, relevance of chemical irritation of dorsal root ganglion and surrounding structures are being more highlighted to elicit discogenic pain (12, 24). Unfortunately, even high resolution MRI fails to visualize the internal architecture of disc (9). As yet, there are no other imaging methods except discography to demonstrate the annular disruption and internal change of disc. Discography is provoking pain by exerting mechanical force to the low threshold branches of sinuvertebral nerve extended into the outer disc margin. However, discography does not provided entire answers to spinal pains. Even limited to discogenic pain, there are other sources of pain simulating discogenic pain. Therefore, full understanding about the spinal pain and combination of other diagnostic methods are mandatory for successful management of spinal pain (25).
Our results showed that elastance (unit change in pressure per fractional change in volume) of disc can be used to measure the degree of disc degeneration. Disc degeneration are commonly measured by morphological changes on MRI (26, 27). Classification of disc degeneration which is not designed to detect the structural changes inside disc has a limitation to localize the degenerative changes which can be related with clinical judgement (28, 29). Elastance measured during discography showed significant differences between normal and degenerative discs. There was statistically significant change between Grade 0 and Grade 4 & 5. Vanharanta et al. noted that pain response by discography correlates with the extent of annular disruption (30). Normal or Grade 1 disc rarely produces pain, yet discs with over Grade 3 disruption usually provoked pain response. Disc degeneration were observed in both the Pos-R and the Neg-R groups. However, decreased elastance with the Pos-R was a good indicator implicating that disc degeneration could be a pain generator in this setting. This information can influence the choice of surgical method, consequently disc removal should be an essential part of surgery whether it is combined with fusion or not.
Pain provoking procedure is an essential step of the discography. Similar to other studies, the Pos-R group showed the concordant pain response at lower intradiscal pressure, whereas the Neg-R group showed absent or discordant pain even at high intradiscal pressure (21-23). Contrary to other study, pain response was not dependant on the amount of injected volume in the present study (23). The difference may come from the fact that volume of disc has individual difference, depending on the size of vertebral bodies and degree of disc degeneration. A certain amount of injected volume may be enough to provoke pain in the patients with smaller disc, but not enough in the patients with larger disc. Consequently, injected volume cannot be regarded as a sole factor to influence the result of discography, rather pressure-controlled procedure is a more sensitive test to detect the Pos-R group.
Neuroimaging findings became a convincing guide in decision-making for spinal operations to date (3, 4). If neuroimaging finding showing disc herniation or extrusion coupled with clinical suspicion of discogenic pain are presented, spinal operations are likely to be planned. However, the present study shows that among 31 discs of Grade 4 and 5 on the modified Dallas discogram classification which matches disc herniation and extrusion on MRI, 74% showed negative pain response and 26% showed positive response. Considering that patients who underwent discogram in this study had clinical background to suspect discogenic pain, the number of true discogenic pain is not many, even though authors admitted that other source of pain simulating discogenic pain can exist. This figure is delivering a message that spinal operations should be more carefully planned and more strict indication respected.
The present study has two limitations. This study has the small number of the patients investigated, especially in Grade 1 and 2 groups. However our data clinically address the usefulness of discography in decision-making for spinal operations. Second drawback is that, even though we tried to maintain steady speed in injecting the volume, it may produce errors in the interpretation of pain responses, because the procedure is often interrupted for communication with the patient. To avoid the possible errors, new apparatus which can incorporate automatic injection of volume and continuous recording of the pressure is ideally demanded.
 XML Download