

 PDF
PDF ePub
ePub Citation
 Print
Print


INTRODUCTION
Recently, staphylococcal superantigens (SsAgs) have been tentatively implicated in the pathogenesis of atopic dermatitis (AD). Lyden et al. (1) reported that over 90% of the skin of AD patients was colonized with Staphylococcus aureus, and over half of the S. aureus strains isolated from AD skin exhibited the secretion of superantigenic toxins, including staphylococcal enterotoxins A and B (SEA, SEB), and toxic shock syndrome toxin-1 (TSST-1) (2, 3). It was also found that combined AD treatment involving both antibiotics and corticosteroids is more effective than corticosteroid therapy alone, also suggesting that S. aureus plays an important role in AD (4).
Dermatitis has also been experimentally induced via the application of SEB to normal skin or normal-looking skin in AD patients (5). When SsAgs were added to cultured keratinocytes (KCs), TNF-α secretion was observed to increase (6). The addition of SsAg to organ-cultured human skin resulted in increases in ICAM-1 or TNF-α expression (7). These results demonstrate that SsAgs may exert a direct influence on KCs. However, no difference was determined to exist between AD patients and normal controls with regard to the ability to produce IgG antibody against SsAgs, or its prevalence (8). This indicates that the immunological abnormality against SsAgs observed in AD patients may be couched in the KCs themselves. KCs cultured from AD patients have been observed to generate increased amounts of GM-CSF and other proinflammatory cytokines (TNF-α and IL-1α), as the result of exposure to phorbol myristate acetate (9, 10). This dysregulated cytokine production in KCs further suggests that the keratinocytes themselves may have intrinsic defects in cases of AD.
SsAgs isolated from AD patients have been shown to exert direct pro-inflammatory effects on KCs via TNF-α release, and these effects may be relevant to the induction and persistence of AD lesions (6). In studies of psoriasis patients, it has been reported that HLA-DR expression in KCs exacerbates inflammatory skin responses to SsAgs (11). This indicates that smaller quantities of SsAgs are required to trigger inflammation in vivo in subjects in whom the KCs exhibit HLA-DR expression.
People are frequently exposed to SsAgs. This raises the obvious question as to why AD patients characteristically develop lesions, especially on flexural areas which are exposed to SsAgs. Therefore, our hypothesis was that lesional KCs from AD may react differently to SsAgs than does nonlesional skin or normal skin, due to the production of a greater quantity of proinflammatory cytokines in the KCs. In order to evaluate this hypothesis, we acquired 3 different skin samples from lesional and nonlesional (normal looking) skin from AD patients, and normal skin from nonatopic controls. We then conducted a comparison with regard to HLA-DR or CD1a expression, and measured a variety of cytokine responses (IL-1α, IL-1β, and TNF-α) to SsAgs in the cultured KCs of these 3 different skin samples.
MATERIALS AND METHODS
Skin samples
We obtained 3 different types of skin samples; 1) lesional skin, 2) nonlesional (normal looking) skin from 8 AD patients (8 males, age range 22-29 yr), and 3) normal skin from the inner arms of nonatopic controls. We obtained 2 matched skin samples from each patient: lesional skin from the antecubital fossa, and nonlesional skin from the volar aspect of the forearm. AD was diagnosed according to the criteria established by Hanifin and Rajka. None of the patients in the study had been treated with systemic steroids, immunosuppressive agents, or other drugs which affect immunologic status, for a period of at least 6 weeks prior to the acquisition of skin samples. All of the patients in the study exhibited increased serum IgE levels (range ; 800-3,000 IU). The disease activity of these patients was considered severe, according to the grading system developed by Rajka and Langeland (12); the extent of their skin involvement was approximately 20-30%, their disease course was continuous in most cases, and all complained of severe itching. Five age-matched healthy controls (5 males, age range 24-36 yr) were also recruited into the study, none of whom had any history of atopic disease.
Portions of each of the skin samples were snap-frozen immediately after the skin biopsy, and were stored at -70℃ until HLA-DR or CD1a staining. The remainders of the skin samples were further processed for cell culturing.
Immunohistochemical staining for HLA-DR and CD1a
We used CD1a monoclonal antibody in addition to HLA-DR monoclonal antibody to confirm whether HLA-DR (+) cells in the epidermis are activated keratinocytes themselves or Langerhans cells (LCs).
Serial sections, each 6 µm thick, were mounted onto silane-coated slides (Dako, Glostrup, Denmark). Acetone-fixed frozen sections were then stained with HLA-DR monoclonal antibody (Becton-Dickinson, Los Angeles, CA, U.S.A.) for 1 hr at room temperature. For the staining of the LCs, 4 µm thick sections were incubated with anti CD1a (1:500) (Dako) at 4℃ for 18 hr. After rinsing in phosphate-buffered saline (PBS), the sections were visualized with an LSAB kit (Dako), which utilizes a biotinylated secondary antibody and horseradish-streptavidine conjugate. 3-amino-9-ethylcarbazole was used as a chromogenic substrate. The sections were briefly counterstained in Mayer's hematoxylin. Control staining was performed with normal mouse immunoglobulin, and manifested no immunoreactivity (data not shown). The entire field of each section was examined at a magnification of ×100, and the number of HLA-DR (+) cells or CD1a (+) cells per field (×100) were counted. At least 5 fields of HLA-DR (+) or CD1a (+) cells in the epidermis were counted.
Keratinocyte culture
Obtained human KCs were isolated as was previously described (13). The KCs were cultured in keratinocyte growth medium (Clonetics, San Diego, CA, U.S.A.), composed of MCDB 153 medium supplemented with epidermal growth factor (10 ng/mL), bovine pituitary extract (70 µg/mL), hydrocortisone (0.5 µg/mL), penicillin (100 µg/mL), streptomycin (100 µg/mL), and fungizone (0.25 µg/mL). Fourth-passage KCs were used.
MTT assay
Cellular cytotoxicity was assessed via 3-(4, 5-dimethylthiazol-2-yl)-2, 5-diphenyl tetrazolium bromide (MTT) assay (14). KCs (1.5×10⁴ cells/well) were seeded into 96-well plates, then cultured for 24 hr with various concentrations (0.05, 0.1, 0.2, 0.5, and 1.0 µg/mL) of SEA, SEB, and TSST-1. 20 µL of MTT (5 mg/mL Sigma, St. Louis, MO, U.S.A.) was added to each well, and the cells were incubated for 4 hr at 37℃. The supernatants were then extracted, and 200 µL of dimethylsulfoxide was added in order to dissolve the formazan products. Absorbance was determined spectrophotometrically at 570 nm, using an ELISA reader. Results were expressed as a percentage of the control in six cultures. Values are represented as means±SEM.
Cytokine assay
KCs were cultured in triplicate at a concentration of 4×10⁴ cells per well, with 0, 0.1, and 1.0 µg of toxin (SEA, SEB, TSST-1; Sigma) per mL, in 96-well plates. The cell culture supernatants were collected 48 hr after incubation. The supernatants of the toxin-treated KCs were analyzed in triplicate for IL-1α, IL-1β, and TNF-α, using a sandwich enzyme-linked immunosorbent assay (ELISA) kit, which was purchased from Endogen (Woburn, MA, U.S.A.).
Semi-quantitative RT-PCR for IL-1β and TNF-α
The KCs were cultured in triplicate, at a concentration of 4×10⁴ cells per well, with 0, 0.1, and 1.0 µg of toxin (SEA, SEB, TSST-1) per mL, in 12-well plates. The cell pellets were collected 6 hr after incubation.
Total RNA was extracted with a TRIzo kit (GibcoBRL Life Technologies, Inc., Gaithersburg, MD, U.S.A.). 2×10⁶ cells were sedimented via centrifugation (10,000×g, 10 min, 4℃) and washed twice with ice-cold PBS prior to RNA extraction. The pellets were then resuspended with 1 mL TRIzol and 100 µL water-saturated chloroform. These mixtures were then incubated on ice for 15 min, and subsequently spun for phase separation at 4℃. RNA was precipitated from the upper aqueous phase via the addition of an equal volume of isopropanol. After 60 min of incubation at -20℃, the precipitates were pelleted by 15 min of centrifugation at 10,000×g at 4℃. Each pellet was washed once with 75% ethanol, and redissolved in 50 µL RNase-free water. 10 µL of the RNA solution was reverse-transcribed into single-strand cDNA with a reverse transcription system (NEB, MA, U.S.A.), in a total reaction volume of 20 µL using 250 ng oligo (dT) primer, 7.5 units of avian myeloblastosis virus reverse transcriptase (AMV-RT), and 0.5 U of ribonuclease inhibitor.
We determined the linear amplification conditions for the primer pairs used in this study. Identical amounts of cDNA were subjected to increasing PCR cycle numbers, in order to delineate the linear amplification range. Increasing amounts of cDNA (up to 4-fold the starting quantity) were subjected to PCR at a given cycle number within the linear range, in order to rule out the possibility that increased amounts of specific cDNA might result in non-linear PCR amplification. PCR amplifications of the resulting specific cDNA fragments were conducted with the following primers: 1) IL-1β (sense, 5'-GTCTCTGAATCAGAAATCCTTCTATC-3' and antisense, 5'-CATGTCAAATTTCACTGCTTCATCC-3') and 2) TNF-α (sense, 5'-TCACCCACACCATCAGGCCGCATCG-3' and antisense, 5'-GGGAAGGTTGGATGATCGTCCTCC-3'). The mixture was incubated for 60 min at 37℃. Denaturation, annealing, and elongation in the PCR procedure were conducted at 94, 55, and 72℃ for 1, 1, and 2 min, respectively, for 28 cycles for IL-1β, and TNF-α, and for 24 cycles for GAPDH (5'-ATTGTTGCCATCAATGACCC-3', 5'-AGTAGAGGCAGGGATGATGT-3'). 10 µL of PCR products were then separated on 2% agarose gel, and the DNA fragments were stained with 0.5 µg/mL ethidium bromide and photographed. We quantitated the fragments using a densitometry program (Raytest Isotopenmeβgerate, Germany).
Statistics
The results are presented as mean values and standard errors. Significant differences in the HLA-DR and CD1a stainings of the 3 different skin samples and MTT tests, as well as differences in the ELISA and RT-PCR results, were assessed by Wilcoxon-rank sum tests. A p-value of less than 0.05 was considered to be statistically significant. All analyses were conducted using the SPSS software package.
RESULTS
Both HLA-DR and CD1a expression were significantly elevated in AD skin vs. nonlesional or normal skin
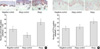
Numbers of HLA-DR (+) cells in the epidermis were significantly elevated in the lesional skin samples (53.13±5.29) as opposed to those from nonlesional skin from AD patients (25.00±5.10) and from normal skin from the nonatopic controls (38.33±5.95) (p<0.05) (Fig. 1A). Quite similarly, numbers of CD1a (+) cells in the epidermis were also significantly elevated in the lesional skin samples (63.13±3.97) compared to those from nonlesional skin from AD patients (49.38±5.37) and from normal skin from the nonatopic controls (46.44±2.47) (p<0.05) (Fig. 1B). HLA-DR (+) or CD 1a (+) cells appeared to be located primarily around the basal layer in the normal controls, and tended to be found scattered throughout the epidermis in both the lesional and nonlesional skin samples from the AD patients. However, the numbers of HLA-DR (+) or CD 1a (+) cells in the nonlesional skin from the AD patients did not differ significantly from those in the normal skin acquired from the healthy controls.
SEA, SEB, and TSST-1 significantly augmented IL-1α release from the KCs of lesional skin from AD patients as opposed to those in the nonlesional skin from the AD patients, or the normal skin from the nonatopic controls
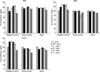
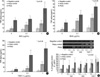
No significant cellular cytotoxicity was determined to exist at any of the tested SsAgs concentrations (Fig. 2). A slight decrease in optical density was detected when 1.0 µg/mL of SEA, SEB, and TSST-1 was added, but this difference was not statistically significant. Therefore, for the cytokine assay, we used 0.1 and 1.0 µg/mL concentrations, in order to observe the maximal effects of each SsAg on the KCs.
The detected level of IL-1α released from the cultured KCs in response to SsAgs exposure was quite low, in a range between 3 to 20 pg/mL (Fig. 3). Even in the absence of stimulation, KCs from the lesional skin of the AD patients (atopic KCs) generated a significant amount of IL-1α, as compared to the KCs acquired from the nonlesional skin of the AD patients (atopic control KCs) and the normal skin from the nonatopic controls (negative control KCs) (p<0.05). Significant increases in the release of IL-1α from the cultured atopic KCs, as compared to the atopic control or normal KCs, was only observed at a concentration of 1.0 µg/mL of SEA and SEB, and 0.1 and 1.0 µg/mL of TSST-1 (p<0.05) (Fig. 3). With regard to TSST-1, a concentration of 1.0 µg/mL resulted in a significant increase in the release of IL-1α from the atopic KCs, as opposed to the IL-1α release observed at a concentration of 0.1 µg/mL (p<0.05). Also in the case of TSST-1 stimulation, a concentration of 0.1 µg/mL resulted in a significant increase in the release of IL-1α from the atopy control KCs, as opposed to the IL-1α release observed with no simulation (p<0.05).
SEA, SEB, and TSST-1 significantly augmented the release of IL-1β from cultured atopic and atopic control KCs vs. the negative control KCs
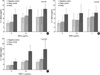
Even in the absence of stimulation, the atopic KCs and atopic control KCs released significantly greater quantities of IL-1β as compared to the nonatopic control KCs (p<0.05). The atopic KCs released a significantly greater amount of IL-1β in response to SsAgs, as compared to that observed in the atopic control KCs and negative control KCs (p<0.05). Also, the atopic control KCs released significantly greater quantities of IL-1β than did the negative control KCs (p<0.05). Both concentrations (0.1 and 1.0 µg/mL) of SEA, SEB, and TSST-1 resulted in significant increases in IL-1β release from the cultured atopic KCs and the atopic control KCs, as opposed to that of the negative control KCs (p<0.05) (Fig. 4A-C). The increased secretion of IL-1β from each KCs proceeded in a clearly dose-dependent manner. The most pronounced change was observed, however, with the application of TSST-1.
In SEA stimulation, both concentrations (0.1 and 1.0 µg/mL) resulted in significant increases in IL-1β release from the cultured atopy KCs, as opposed to that of the cultured atopy KCs with no stimulation (p<0.05). In SEB and TSST-1 stimulation, IL-1β release from atopy KCs, atopy control KCs, and even negative control KCs was significantly greater with stimulation compared to that without stimulation (p<0.05).
Increased IL-1β mRNA in the atopic KCs and atopic control KCs vs. the negative control KCs was confirmed by semiquantitative RT-PCR, particularly in the cases of SEB and TSST-1 stimulation (Fig. 4D). Statistically significant differences among 3 different samples (marked by *) were observed only in SEB and TSST-1 stimulation.
SEA, SEB, and TSST-1 significantly increased the release of TNF-α from the cultured atopic and atopic control KCs vs. the negative control KCs
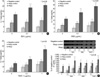
In this study, the most pronounced effects observed involved the release of TNF-α. The atopic KCs released a significant amount of TNF-α in response to SsAgs exposure, as compared to that observed with the atopic control KCs and the negative control KCs (p<0.05). Also, the atopic control KCs released significantly greater amounts of TNF-α than did the negative control KCs (p<0.05). Both tested concentrations (0.1 and 1.0 µg/mL) of SEA, SEB, and TSST-1 induced significant elevations in the levels of TNF-α release in the cultured atopic KCs and the atopic control KCs, as opposed to that observed in the negative control KCs (p<0.05) (Fig. 5A-C). The increased TNF-α secretion observed in each of the KC types proceeded in a clearly dose-dependent manner. The most pronounced change in TNF-α secretion was also induced by exposure to TSST-1.
The significantly increased TNF-α secretion observed in atopy KCs, atopy control KCs, and even negative control KCs with SEA, SEB, and TSST-1 stimulation compared to that with no stimulation (p<0.05).
Increased TNF-α mRNA in the atopic KCs vs. the atopic control KCs and negative control KCs was revealed by the results of semi-quantitative RT-PCR, particularly in the cases of 1.0 µg/mL of SEA and SEB stimulation (Fig. 5D).
DISCUSSION
Keratinocytes are the most abundant cell type in the epidermis by far, and our perception of the role of KCs in inflammation has changed significantly. Whereas at one time, the KCs were believed to be passive target, they are now considered active participants. Keratinocytes exhibit the ability to generate and release a host of lipid and protein cytokines. Among the protein-derived cytokines which are generated by keratinocytes, TNF-α, and IL-1 have been termed primary cytokines (15). Therefore, we opted to focus our study on these cytokines, with regard to the role played by SsAgs in AD.
Travers et al. (11) reported that HLA-DR expression in the KCs exacerbates inflammatory skin responses to SsAgs. This conclusion was reached by virtue of the observation that significantly higher HLA-DR expression occurred in KCs from psoriatics after patch testing with SsAgs. This demonstrates that smaller amounts of SsAgs are required to trigger inflammation in AD patients in vivo, when the KCs express HLA-DRSsAgs can also bind to and activate MHC class II on nonprofessional antigen processing cells such as KCs, as the result of cytokine stimulation. However in this study, we found that both HLA-DR (+) cells or CD1a (+) cells in the epidermis were significantly more abundant in lesional skin from AD patients only than in nonlesional skin from AD patients and normal skin from nonatopic controls. Our study suggests that HLA-DR (+) cells correspond to Langerhans' cells because increased numbers and the locations of immunopositive cells showed quite similar pattern in the epidermis of each sample. Actually IgE-bearing Langerhans' cells are reported to be increased in AD skin (16).
Girolomoni and Pastore (9) reported that GM-CSF was overexpressed in the KCs located in AD lesions, and also reported that even the KCs which were cultured from the nonlesional skin of AD patients generated higher levels of GM-CSF, both basally and in response to IL-1 or phorbol esters, than did the KCs isolated from nonatopic subjects. Thus, they suggested that dysregulated cytokine production in KCs might be a principal contributor to the pathophysiology of AD (10, 17).
Ezepchuk et al. (6) reported that S. aureus isolates obtained from the skin of AD patients exhibited characteristic superantigenic toxins, and stimulated TNF-α secretion from a Ha-Cat cell line. In their HaCat cell experiment, TNF-α expression levels after simulation with SEA, SEB, and TSST-1 were vanishingly low, ranging from about 5 to 15 pg/mL, but were still significantly higher than those measured in PBS controls. It was reported that, in organ-cultured human skin, SsAgs could induce cytokines (TNF-α, IL-1α, and IL-1β) and that, among these cytokines, TNF-α was the most abundantly expressed in the KCs, at both the protein and mRNA levels, whereas IL-1α and IL-1β were demonstrated only at the mRNA level (7). These studies suggested that SsAgs can induce a variety of cytokines in the KCs, and may perform a vital function in the induction of AD. However, there have not yet been any studies which have compared changes in the levels of TNF-α, IL-1α, and IL-1β in response to SsAgs exposure in the lesional skin of AD patients, as compared to those occurring in the nonlesional skin of AD patients or in normal skin.
In this study, we compared the reactivity of 3 different samples of human skin to SsAgs. These samples were obtained from lesions in AD patients, normal-looking skin in AD patients, and normal skin. We determined that cultured KCs, particularly those obtained from the AD lesions, released slightly higher quantities of IL-1α, IL-1β and TNF-α than did KCs in the absence of staphylococcal antigenic stimulation, as was expected. When SsAgs were added to the cultures, we noted that IL-1α, IL-1β and TNF-α were generated and released in significantly greater quantities in the KCs cultured from AD lesions than in those of the normal looking skin from AD patients or from the KCs of normal skin. With regard to IL-1α, both basal and post-SsAgs-stimulated levels were quite low. However, exposure to SsAgs resulted in significantly elevated levels of IL-1α release in the KCs cultured from the AD lesions than in those cultured from normal looking skin or from normal skin. With regard to IL-1β, both basal and post-SsAgs-stimulated levels were still quite low. However, exposure to SsAgs resulted in significant increases in the amount of IL-1β released from the KCs, which were cultured from the AD lesions and the normal looking skin of AD patients, as opposed to the KCs isolated from normal skin. The most pronounced responses were observed in the case of TNF-α. SsAgs exposure resulted in significant increases in the release of TNF-α from the KCs, which were cultured from the AD lesions and the normal looking skin, as opposed to the KCs isolated from normal skin. Furthermore, SsAgs exposure significantly augmented IL-1β and TNF-α release from the KCs cultured from the AD lesions, as compared to those cultured from normal-looking AD skin. These exaggerated IL-1β and TNF-α responses to SsAgs were also corroborated by the results of semi-quantitative RT-PCR, which measured mRNA levels.
All in all, our study demonstrated that KCs cultured from the affected skin of AD patients generate greater quantities of inflammatory cytokines in response to SsAgs exposure than do the KCs of nonlesional skin or normal skin. This may be attributable to intrinsic defect or altered responsiveness in the AD lesional KCs. This, then may constitute one of the pathomechanisms by which S. aureus induces and aggravates skin lesions in cases of AD.
 XML Download