

 PDF
PDF ePub
ePub Citation
 Print
Print


INTRODUCTION
A genetic instability is believed to underlie the various genomic changes in a malignancy (1). In solid tumors, unilateral chromosomal losses are the most common genetic events that are detected as a loss of heterozygosity (LOH) using highly polymorphic microsatellite markers (2). The extent of the unilateral chromosomal losses and the microsatellite instability (MSI) detected in stage II and III gastrointestinal carcinomas (3, 4) have been classified into high-level LOH (LOH-H) and baseline-level LOH (LOH-B) in those with a poor prognosis and low-level LOH (LOH-L) and MSI in those with a low risk. Gastric carcinomas frequently display an intratumoral heterogeneity with the different histological types and varying degrees of differentiation (5, 6). Previous multifocal LOH studies on gastric carcinomas (7, 8) reported the extent of the chromosomal losses as a stem-line genotype commonly shared by heterogeneous tumor sites. This suggests that the level of chromosomal losses plays a master role in the diverse progression of gastric carcinomas.
Chromosomal losses detected by LOH analysis, in a naive sense, represent an imbalanced loss or a dose reduction of the genetic elements. A difference in the dose of the X chromosome between males (XY) and females (XX) is equalized via a dosage compensation mechanism, which randomly inactivates one of two X chromosomes via DNA hypermethylation (9). The X-to-autosomal chromosome ratio is believed to inherently initiate the methylation changes in order to maintain the genomic dosage in mammals (10, 11). Although solid tumors suffer from global DNA hypomethylation and multiple gene-specific hypermethylation (12), the link between the unilateral chromosomal losses and DNA methylation is poorly understood in terms of the genetic and epigenetic interaction including the compensative methylation changes in response to a genome dosage reduction. Therefore, it is important to determine if the extent of the chromosomal losses is related to the pattern of DNA methylation changes.
Hypomethylation and hypermethylation involve the different spectra of cancers in distinct fashions. The genomic and gene-specific hypomethylation closely correlate with advanced-stage cancers (13, 14). Meanwhile, gene-specific hypermethylations are widely detected in different subsets of gastrointestinal cancers with and without MSI (15, 16). At the genomic level, global hypomethylation of the cancer genome is only an insignificant change affecting a small portion of the non-coding genetic elements in the gene- and GC-poor heterochromatin region (14, 17). However, GC-rich regions adjacent to the coding genes frequently exhibit hypermethylation in the undermethylated CpG islands (15) and hypomethylation in the overmethylated non-island CpGs (13), suggesting a methylation variation that is prone to hyper- and hypomethylation changes in cancer cells. Therefore, it is likely that both hypermethylation and hypomethylation, each of which plays a distinct role in diverse tumor progression, can be detected in the methylation variation regions adjacent to the genes.
In this study, multifocal analysis on gastric carcinomas was carried out to determine the relationship between the stem-line extent of the chromosomal losses and the CpG methylation status in heterogeneous tumor tissues. A total of 120 tumor foci from 40 gastric carcinomas were examined to determine the extent of chromosomal losses using a PCR-based LOH analysis on 8 cancer-associated chromosomal arms. The 13 extragenic regions adjacent to the 10 cancer-related or -unrelated genes were evaluated for the methylation status of the CpG islands and/or the non-island CpGs using methylation-specific PCR (MSP) and bisulfite sequencing analyses. The proportion of methylation and unmethylation was compared to determine the rise and fall in the methylation density in the paired normal and tumor tissues.
MATERIALS AND METHODS
Patients and tumor tissues
The gastric carcinoma tissues were selected from those that had been recently resected in a similar period because formalin-fixed paraffin-embedded tissue DNA tends to be poorly amplified by PCR in the older archives. Fifty patients who were suspected of having a gastric carcinoma were underwent a surgical resection at the St. Paul's Hospital, The Catholic University of Korea between March and December 2002. Of the 50 patients, 40 patients, who were suitable for isolating the matching normal and tumor DNAs from the paraffin-embedded tissues, and for providing the clinicopathological information, were enrolled in this study. The normal lymph nodes were also collected as the control. The nontumoral gastric mucosa was examined for the presence or absence of intestinal metaplasia. The histological type of the gastric carcinoma was classified into intestinal, diffuse, and mixed according to the Lauren classification (18) and the degree of differentiation was graded according to the WHO classification. The clinicopathological tumor stage was determined using the Tumor-Node-Metastasis (TNM) criteria (19). Permission for this study was obtained from the Institutional Review Board and written informed consent was obtained from each patient prior to the surgical resection.
Three tumor sites per gastric carcinoma were selected from the topographically opposite and histologically distinct areas. A tissue area ranging from 5 mm to 7 mm in diameter was microdissected from an average of 10 consecutive seven-µm-thick hematoxylin-eosin-stained sections using a stereomicroscope under a ×40 magnification. All the microdissected tumor sites were checked for the tumor cell contents ≥70% prior to DNA extraction. A tumor cell content of 80-89% held a major fraction (74 sites, 62%) of the microdissected tissue sites followed by ≥90% (29 sites, 24%) and 70-79% (17 sites, 14%) of the tumor cell contents. Approximately 50 microdissected cells were digested in 1 µL of a Tween 20-Proteinase K lysis buffer. An average of 100 µL of the tissue lysate from each microdissected site was examined for its LOH status, and an average of 500 µL of the lysate was subjected to bisulfite modification to determined the methylation status (Fig. 1). Because the digested tissue admixture contained genomic DNA of heterogeneous quality in different concentration, the amount of template DNA used for the PCR-based microsatellite and methylation analyses was determined based on the PCR band intensity of 20 ng/µL amplified by a microsatellite primer set, D19S226 (forward, 5'-CCA GCA GAT TTT GGT GTT GTC TA-3'; reverse, 5'-ACA GAG CCA GAG CCA GTA GGA GT-3'; amplicon size, 164 bp).
Microsatellite analysis
PCR amplification of the template DNA was performed under the so-called "multiplex, hot-start" condition using a radioisotope (α-32P dCTP, PerkinElmer, Boston, MA, U.S.A.) as described previously (7, 8). For each PCR, two pairs of microsatellite primers were used, and the template-primer mixtures were heated prior to adding the dNTP and Taq DNA polymerase (Takara, Shiga, Japan). One µL of the template DNA was amplified and labeled through 32 PCR cycles using a thermocycler (iCycler, Bio-Rad, Hercules, CA, U.S.A.) as follows: 1 min of denaturation at 94℃, 1 min of annealing at 58-64℃, and 1 min of elongation at 72℃ in a 10 µL reaction mixture. Of the PCR products, 5 µL was loaded directly onto a sequencing gel containing 7 M urea and visualized by repeated autoradiography using a radioluminograph scanner (BAS 2500, Fuji Photo Film, Kanakawa, Japan). The optimal range of the band intensities was measured by densitometry using TINA image software (Raytest Isotopenmeβgerate GmbH, Straubenhardt, Germany). Each reaction was repeated twice and the same band intensity was confirmed.
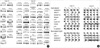
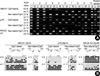
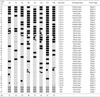
The MSI and LOH status were defined using a panel of 40 microsatellite markers that were selected from eight chromosomes, including 3p, 4p, 5q, 8p, 9p, 13q, 17p, and 18q, as described previously (Fig. 1A) (7, 8). The MSI status of the microsatellite sequences was scored if frameshift mutations were observed in >40% of the homozygous markers. Because increased instability in the repeated sequences obscured the LOH status in most microsatellite markers, a LOH was scored in those cases without a MSI. A reduction in the allelic intensity in the tumor tissue was scored as a LOH if the normalized ratio of the heterozygous alleles had decreased to the cut-off point of less than 0.65-fold intensity reduction.
The lost extent of a chromosomal arm was determined based on the number of allelic losses, and was classified into either a constitutional loss involving more than one microsatellite allele or an interstitial loss involving only one allele. The extent of the chromosomal losses in each case was scored according to the number of constitutional chromosomal losses causing a significant reduction in the genomic dosage. According to the classification criterion for the extent of the chromosomal losses reported previously (7, 8), the intestinal-type gastric carcinomas were divided into low-level (LOH-L, three or fewer losses) and high-level (LOH-H, four or more losses) loss groups, and the diffuse-type carcinomas were divided into the baseline-level (LOH-B, zero or one loss), low-level (LOH-L, two or three losses), and high-level (LOH-H, four or more losses) loss groups.
DNA modification by sodium bisulfite
Ninety microliters of the tissue lysate were denatured with 10 µL of 3 M NaOH for 15 min at 37℃. The mixture was then modified with 1,040 µL of 2.3 M sodium bisulfite and 60 µL of 10 mM hydroquinone for 12 hr at 50℃, and purified using the Wizard DNA purification resin (Promega, Madison, WI, U.S.A.) according to the manufacturer's instructions (20). The modified DNA was finally precipitated by adding 2.5 volumes of 100% ethanol and 1 µL of salmon testis DNA (5 mg/mL, Sigma-Aldrich, St. Louis, MO, U.S.A.). The pellet was washed with 70% ethanol, dried, and dissolved in 35 µL of a 5 mM Tris buffer (pH 8.0). In order to avoid repeated freezing and thawing, a 1 µL aliquot of the modified DNA solution was placed in a PCR tube and stored at -20℃.
The genomic DNA universally methylated by DNA methylase (CpGenome Universal Methylated DNA, Chemicon, Temecula, CA, U.S.A.) was used as the methylation control DNA. The PCR DNA that had been amplified by a universal primer (5'-CCG ACT CGA GNN NNN NAT GTG G-3') was used as the unmethylation control DNA. Universal PCR was carried out as follows: 1 cycle of denaturation at 94℃ for 3 min, 10 cycles of 94℃ for 1.5 min, 30℃ for 2.5 min, a ramp at 0.1℃/sec to 72℃, 72℃ for 3 min and 30 cycles of 94℃ for 1 min, 62℃ for 1.5 min, 72℃ for 2 min, and 8 min of elongation at 72℃.
Methylation density analysis
Methylation analysis using the radioisotope was performed in minimal of amplification rounds in order to avoid excessive DNA amplification. One µL of the bisulfite-modified DNA was amplified and labeled by a hot-start PCR containing α-32P dTTP (PerkinElmer, Boston, MA, U.S.A.) and dNTP mixture through 32 PCR cycles. Bisulfite-modified DNAs produced a total PCR intensity of 2-10 ng/µL by each MSP primer set. Of the PCR products, 5 µL was loaded directly onto a nondenaturing polyacrylamide gel and visualized by repeated autoradiography using a radioluminograph scanner.
An initial study validated the high specificity of each MSP primer set using the methylation and unmethylation control DNA. The standard curves for the MSP primers were plotted according to the methylation and unmethylation band intensities that were amplified from various mixtures of the two control DNAs (Fig. 2). The proportion of the methylation and unmethylation band intensities against the total intensity of each MSP primer set showed a linear relationship between the percentage of the methylation and unmethylation control DNAs in the template-primer mixtures. Based on the standard curve of the control MSP bands, the reciprocal proportion of methylation and unmethylation bands (Fig. 1B) was graded as complete unmethylation (0-20% methylation, zero methylation), low density methylation (21-40% methylation, one methylation), moderate density methylation (41-60% methylation, two methylation), high density methylation (61-80% methylation, three methylation), and complete methylation (81-100% methylation, four methylation).
Methylation- and unmethylation-specific PCR and bisulfite sequencing
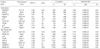
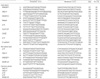
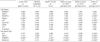
The MSP primer sets were designed in order to assess the small fragment less than 150 bp, which stably amplified the template DNAs from the obtained formalin-fixed paraffin-embedded tissues. The primer sequences were selected using a MethPrimer software (http://www.urogene.org/methprimer/), and were checked for any sequence redundancy by BLAST search (http://www.ncbi.nlm.nih.gov/BLAST/). Two different CpG regions adjacent to the transcription start site were accessed in this study. The CpG islands at a CpGObs/Exp ratio >0.6 resided within the extragenic regions 1 kb proximal to the genic regions, whereas the upstream regions more than 1 kb distant from the genes showed a low number of CpG site (Table 1). The MSP primer sets for the CpG islands of the hMLH1 (21), RASSF1A (22), p15 (23) genes and the non-island CpGs of MAGE-A2 (24) gene were based on those described elsewhere.
Two or three CpG sites within the MSP primer sequences were found to amplify the specific methylation and unmethylation band intensities from the control DNAs. The non-island CpGs, which had a relatively low CpG content, was insufficient to facilitate the primer design in some cases. These CpG primer sets introduced the non-specific bands to the counterpart control DNAs. Thirteen out of the 17 primer sets tested amplified only a specific band intensity ratio ≥0.9 from both the methylation and the unmethylation control DNAs (Table 1). Finally, a panel of 13 MSP primer sets were selected from the upstream regions adjacent to the p15, p16, hMLH1, E-cadherin, RASSFIA, MAGE-A2, CAGE, Maspin, and Cyclin D2 genes, in which one or more reports described the hypo- or hypermethylation changes in gastric carcinomas, as well as an arbitrarily selected RABGEF1 gene.
The methylation composition of each template DNA copy was analyzed by bisulfite sequencing. The methylation-unmethylation common primer sets encompassing the MSP primer sequences were used. The PCR products common to the methylated and unmethylated CpGs were cloned into the pCR2.1-TOPO vector (Invitrogen, Carlsbad, CA, U.S.A.), and the PCR clones from each genomic DNA were cycle-sequenced using a BigDye Terminator Kit (PE Biosystems, Foster City, CA, U.S.A.) and an ABI automated DNA sequencer (PE Biosystems, Warrington, U.K.) (Table 2).
Statistical analysis
The statistical comparisons of the clinicopathological features between the different microsatellite genotypes were performed using an independent t test and a χ2 test or Fisher's exact test. Mann-Whitney U and Kruskal-Wallis nonparametric tests were used to compare the methylation status according to the level of chromosomal losses and the clinicopathological parameters. Two-sided p-values less than 0.05 were considered significant.
RESULTS
Multifocal analysis of microsatellite alterations
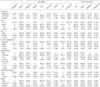
Of the 40 gastric carcinomas, three had a high-frequency MSI at more than 40% of the homozygous alleles in multiple tumor sites examined (Fig. 1A, Table 3). A total of 411 chromosomal losses were detected in 111 tumor sites from 37 MSI-negative cases. Of these, 389 (95%) were counted as being constitutional losses involving more than one microsatellite marker on a chromosomal arm. Thirteen (35%) out of the 37 LOH-positive gastric carcinomas were found to be composed of genetically different subclones in terms of the intratumoral LOH clonality. Six cases had heterogeneous LOHs involving the upper and lower opposite alleles on the same chromosome.
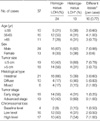
In a comparison of the LOH heterogeneity rate (Table 4), the mixed- and diffuse-type gastric carcinomas (61%), advanced-stage diseases (69%) and the small sized tumors ≤5 cm in diameter (69%) showed frequent LOH heterogeneity. However, as a result of the reciprocal losses of the opposite alleles on the same chromosomes, a difference in the genomic dosage reduction between the heterogeneous tumor sites was no greater than one chromosomal loss. In most LOH-positive cases (35 out of 37), the same or a similar number of chromosomal losses detected in heterogeneous tumor sites was classified into the same category of chromosomal losses (Table 3). Case 28, who contained two (low level) and four (high level) losses, was defined as a LOH-H genotype detected in two of the three tumor sites examined. Case 22 containing no constitutional chromosomal losses was classified into a LOH-B genotype based on the predominance of a diffuse-type histology. Consequently, 4 LOH-B (10%), 16 LOH-L (40%), 17 LOH-H (42.5%), and 3 MSI (7.5%) cases were identified in the 40 surgical specimens examined. In a comparison of the clinicopathological variables between the LOH-H and LOH-L gastric carcinomas (Table 5), a lymphatic invasion (p=0.005) and advanced stage (p=0.002) were significantly associated with the LOH-H cases.
Methylation status of the nontumoral tissues
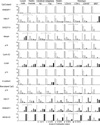
A total of 13 CpG regions examined showed various methylation densities in the nontumoral tissues including the gastric mucosa, gastric intestinal metaplasia and lymph nodes, which variably changed in the heterogeneous tumor sites (Fig. 1B). The multifocal MSP analysis results are summarized in Table 6. Initially, a methylation density in the different nontumoral tissues was compared (Fig. 3). The moderate to complete methylation of the hMLH1 (p=0.005) and Maspin (p<0.0001) CpG islands and the RABGEF1 non-island CpGs (p<0.0001) were significantly higher in the normal lymph nodes than in the gastric mucosa. The low density methylation of the Maspin gene at the gastric mucosa of intestinal metaplasia was significantly increased than the gastric mucosa without intestinal mucosa (p=0.019). In contrast, the high density methylation of the hMLH1 non-island CpGs was significantly increased in the gastric mucosa with intestinal metaplasia as compared with the gastric mucosa without intestinal metaplasia (p=0.002). The methylation status of the CAGE CpG islands and the p16 non-island CpGs were similar in the gastric mucosa and lymph nodes.
Comparison of methylation density between the paired normal and tumor tissues
When comparing the methylation status of the nontumoral gastric mucosa and their corresponding heterogeneous tumor sites (Fig. 3), the zero to two methylation of the CpG islands of the Maspin (p=0.031) and CAGE (p=0.005) genes as well as the non-island CpGs of the MAGE-A2 (p<0.0001) and RABGEF1 (p=0.004) genes was significantly higher in the tumor tissues. The tumor tissues demonstrated significant increases in the methylation density at the hMLH1 (p=0.020), p16 (p=0.005), and RASSF1A (p=0.015) CpG islands that were completely unmethylated in the normal tissues. The CpG islands of the RABGEF1, p15 and E-cadherin genes suffered few methylation differences in tumor tissues.
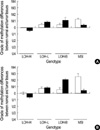
The methylation status of the tumor tissues was analyzed separately according to the four microsatellite genotypes, LOH-H, LOH-L, LOH-B, and MSI (Fig. 3). The methylation density at the CpG islands of the Maspin (p=0.007) and CAGE (p=0.010) genes in addition to all of the non-island CpGs upstream of the p16 (p=0.013), hMLH1 (p=0.003), MAGE-A2 (p<0.0001) and RABGEF1 (p<0.0001) genes were significantly decreased in the LOH-H tumor sites. The LOH-L tumor sites showed significant increased methylation in the CpG islands of the hMLH1 (p=0.012), RASSF1A (p=0.037), p16 (p=0.049) and Cyclin D2 (p=0.034) genes, and in the non-island CpGs of the p16 (p=0.038) and hMLH1 (p=0.005) genes. The increased methylation density of the six CpG regions in the LOH-L cases was significantly different from the unchanged (CpG islands) or decreased (non-island CpGs) methylation density in the LOH-H cases. All the p-values are listed in the Table 7.
In both the LOH-B and MSI cases, the methylation density tended to be higher in the CpG islands of the RASSF1A, p16, and Cyclin D2 genes as well as in the non-island CpGs of the p16 and hMLH1 genes. The CpG islands of the hMLH1 gene were mainly hypermethylated in the nine tumor sites from the three MSI-positive cases (complete methylation in 8 tumor sites and incomplete methylation in 1 tumor sites). Unmethylated E-cadherin CpG islands were detected in the LOH-B and MSI cases. The statistical analysis results are not shown for the small number of LOH-B and MSI cases.
Relationships between the methylation differences and the clinicopathological features
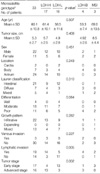
A difference in the methylation density between the paired nontumoral gastric mucosa and each tumor site was graded U1 through to U4 according to the decreased methylation degree and M1 through to M4 according to the increased methylation degree. The mean value of the methylation differences in the three tumor sites was correlated with the clinicopathological features in a subset of gastric carcinomas with low- and high-level chromosomal losses (Table 8). The hMLH1 (p=0.034), RASSF1A (p=0.031), and p16 (p=0.031) CpG islands and the four non-island CpGs (p16, p=0.002; hMLH1, p<0.0001; RABGEF1, p=0.015; MAGE-A2, p<0.0001) showed statistical significances in the pattern of methylation differences between the LOH-H and LOH-L cases.
In a subset of gastric carcinomas with low-level or high-level chromosomal losses, the decreased methylation differences in the non-island CpGs of p16, hMLH1, and MAGE-A2 genes correlated with the mixed histological type, a lymphatic invasion, and an advanced tumor stage (p<0.05) (Table 8). The decreased methylation differences in the CpG islands of the Maspin genes were associated with the large-sized tumors (p=0.012). In contrast, the increased methylation differences in the p16 CpG islands correlated with well differentiation (p=0.039), a small size (p=0.042), a non-lymphatic invasion (p=0.031) and an early tumor stage (p=0.042). The relationships between the increased methylation differences in the CpG islands other than p16 and either a non-lymphatic invasion (hMLH1, p=0.035; RASSF1A, p=0.031) or an early tumor stage (RASSF1A, p=0.042) also reached borderline-level statistical significance.
Methylation heterogeneity
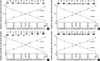
A total of 1,560 pairs of methylation and unmethylation bands were obtained from the 120 heterogeneous tumor sites using MSP analysis on the 13 CpG regions, of which 305 (19%), 267 (17%), and 991 (64%) demonstrated decreased methylation, increased methylation, and no methylation changes, respectively. When analyzing the pattern and grade of methylation differences in three heterogeneous sites of each case (Fig. 4A), the grade of increased and decreased methylation differences were similar (8% and 11%) or dissimilar (12% and 11%). However, no gastric carcinomas showed both the increased and decreased methylation in heterogeneous tumor sites simultaneously.
A large fraction (59%) of methylation differences tended to cluster in a range of U1 and M1 low-grade differences, whereas a complete difference (M4 and U4) of the methylation status was detected in only five normal mucosa-tumor pairs (0.9%) (Fig. 4B). The three tumor-cell-content groups, 70-79% (221 tumor sites), 80-89% (962 tumor sites), and ≥90% (377 tumor sites), demonstrated varying grades of methylation differences (Fig. 4C). The U1 and M1 low-grade differences and the U3 and M3 high-grade differences were similarly increased in the high tumor-cell-content group (63% and 12%) when compared with the low tumor-cell-content group (57% and 8%).
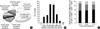
The CpG islands and non-island CpGs of the p16, hMLH1, and MAGE-A2 genes were amplified and cloned using the methylation-unmethylation common primers encompassing the MSP primer sequences (Fig. 5). The methylation densities of the individual PCR clones examined using the MSP primer sets were different (Fig. 5A), and the number and position of the methylated CpGs identified by bisulfite sequencing were heterogeneous (Fig. 5B). The pooled PCR clones showed a similar proportion of methylated and unmethylated amplifications to the corresponding genomic DNA (Fig. 5A).
DISCUSSION
The aforementioned studies have reported frequent gene-specific hypermethylation in the intestinal metaplasia and adenoma (15), whereas chromosomal losses were rare in the intestinal metaplasia and low-grade dysplasia (25). Given the multistep carcinogenesis, the tumor progenitor cells acquiring the hypermethylation in the initial step appear to subclonally expand via further hypermethylation or chromosomal losses (genome dosage reduction) providing a selective growth advantage. The previous results that <10% of colorectal carcinomas show frequent methylation of the CpG islands at the methylated-in-tumor (MINT) loci, but no MSI, which is associated with a poor prognosis (16). In this study, the four LOH-B cases detected in 10% of gastric carcinomas examined, which have been reported to be associated with poor prognosis (7, 8), shows a tendency toward an increase in methylation density. These findings on colon and gastric carcinomas similarly suggest that a subset of high-risk gastric carcinomas develop largely depending on methylator phenotype.
The methylation density at the CpG islands of the Maspin and CAGE genes as well as the non-island CpGs of the MAGE-A2 and RABGEF1 genes were decreased in the tumor tissues, which were significantly different from the normal tissues (Fig. 3) in similarity with previous studies (24, 26, 27). A tendency toward decreased methylation differences in these CpG islands and non-island CpGs was found to be significantly associated with the LOH-H cases but not with the LOH-L cases (Table 8). Interestingly, the methylation differences at the non-island CpGs of the p16 and hMLH1 genes that were incompletely methylated in the normal tissues tended to be decreased in the LOH-H cases, and they were further increased in LOH-B, LOH-L, and MSI cases (Fig. 6). The extragenic regions upstream of a gene appear to formulate a distance-dependent methylation gradient, which is easily dislodged for hypomethylation as well as hypermethylation. The hypomethylation compensating for the chromosomal losses can explain why the MSI inversely correlates with the chromosomal losses (7, 28). This inverse relationship might result from the hypomethylation effect of chromosomal loss on the hMLH1 promoter region in which hypermethylation silence the mismatch repair gene and induce the MSI.
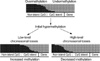
The methylation density at the non-island CpGs of the RABGEF1 gene arbitrarily selected in this study was significantly decreased in the LOH-H cases but there was no significant relationship with the clinicopathological features. Given the genome-wide influence of a dosage compensation mechanism that maintains the X-to-autosomal chromosome ratio (10, 11), the hypomethylation can occur in the cancer-related as well as cancer-unrelated genes in association with high-level chromosomal losses. Therefore, the high-grade hypomethylation compensating for the high-level dosage reduction are likely to surpass the initial hypermethylation and to drive the progression of high-risk gastric carcinomas independent of the hypermethylation status (Fig. 7). This supports the previous study of colorectal cancer that hypermethylation and hypomethylation separately contribute to the process of carcinogenesis (29).
The increased methylation differences in the p16, hMLH1, and RASSF1A CpG islands were statistically significant at well differentiation, no lymphatic invasion, and the early tumor stage (Table 8). The same increased methylation differences observed frequently in both the LOH-B and LOH-L cases were paradoxical, because the two genotypes represent high-risk and low-risk gastric carcinomas, respectively (Fig. 3). Moreover, the decreased methylation differences in the non-island CpGs adjacent to the p16 and hMLH1 genes were associated with the advanced tumor stage and a lymphatic invasion (Table 8). These paradoxical relationships between epigenetic alterations and malignant phenotypes can be explained by the dynamic pathways composed of preceding hypermethylation, irreversible chromosomal loss, and compensative hypomethylation. The gene-specific hypermethylation changes may initiate the tumor formation in a precancerous lesion and/or be potentially associated with the hypermethylation-dependent LOH-B cases (15, 16). The high-level chromosomal losses stimulate the hypomethylation-dependent pathway requiring no hypermethylation. The low-grade hypomethylation compensating for the LOH-L cases is thought to attenuate the extent of hypermethylation at high risk (Fig. 7). Alternatively, the low-level chromosomal losses are likely to cooperate with the hypermethylation for the development and progression of a low-risk gastric carcinoma.
It should be noted that multidirectionally differentiated mixed cancers such as a sarcomatoid carcinoma (30) and a glandular-neuroendocrine carcinoma (31) as well as heterogeneous tumor sites of a gastric carcinoma commonly have divergent losses involving different alleles on the same chromosome. Considering that epigenetic changes occur only in dividing cells (32), the divergent losses bifurcated in mixed tumors suggest that a genome dosage reduction results in the gradual and heterogeneous hypomethylation during carcinogenesis, which give rise to the expansion of dissimilar subclones driven by the same chromosomal loss.
Assuming the compensative interactions between the chromosomal losses and the methylation changes maintain a genomic dosage, the extent of irreversible chromosomal losses and the pattern of reversible methylation are likely to be stable and are unlikely to progress from the LOH-L cases to the LOH-H or LOH-B cases. In a previous LOH study using the same microsatellite markers (8), a lymph node metastasis and extraserosal invasion were frequent irrespective of the tumor size in the LOH-H and LOH-B cases. In contrast, in the LOH-L cases, the rate of a lymph node metastasis and extraserosal invasion increased linearly with the increased tumor size. The age of onset and the tumor size in the LOH-L and LOH-H cases, which were significantly associated with the early and advanced tumor stage, respectively, were similar (Table 8). It is likely that the clinical course of a gastric carcinoma is determined at the early stage and is dependent on the stem-line extent of chromosomal losses before tumor cells appear as a visible mass.
The MSI cases demonstrated frequent hypermethylation and infrequent hypomethylation (Fig. 3), which is in agreement with a subset of gastric carcinomas positive for MSI and MINT (15, 33). The MSI cases associated with a good prognosis contain many cancer-related mutations caused by hypermethylation silencing the mismatch repair gene. The accumulation of irreversible gene mutation might be disadvantageous over the viable tumor cells due to the lack of a physiological gene function. Unlike the reversible methylator phenotype, the irreversible mutator phenotype appears to lead to a favorable clinical course.
The present methylation analysis of the paired normal and tumor tissues identified an epigenetic heterogeneity in the CpG islands as well as in the non-island CpGs adjacent to the cancer-related and -unrelated genes. A complete conversion of the methylation status in the tumor tissues was quite rare in the CpG sites examined (Fig. 4B). A high tumor cell contents ≥90% tended to increase both the low- and high-grade methylation differences (Fig. 4C). The amplification intensity of the MSP analysis along with the methylated CpG composition identified by bisulfite sequencing also showed a wide range of methylation densities in the CpG islands and non-island CpGs (Fig. 5). Previous bisulfite sequencing analyses on tumor cell lines and pure primary tissues have also reported a wide range of methylation densities in the CpG island regions of the Maspin, CAGE, E-cadherin, p16, and hMLH1 genes (26, 27, 34-36). This indicates that the heterogeneous methylation changes in the 5'-franking regions were generalized over the tumor tissues.
The hypermethylation status in the CpG islands examined in this study were extensively examined in previous studies on gastric carcinomas, and the rates reported in the literature varied from 10% to as high as 67% for the p16 CpG island (37, 38) and from 18% to 33% for the hMLH1 CpG island (33, 39). Moreover, the CpG island hypermethylation was also observed in 0-67% of the normal gastric mucosa (15, 39). In this study, the incompletely unmethylated CpG island of the hMLH1 gene (33%) was frequently methylated (48%) and completely unmethylated CpG islands of the p16 and RASSF1A genes were slightly methylated (18% and 14%). The methylation differences between gastric mucosa and tumor were more prominent in variably methylated non-island CpGs than relatively unmethylated CpG islands of the hMLH1 and p16 genes (Fig. 6). The normal lymph nodes contained an increased methylated density in the CpG islands of the hMLH1 and Maspin genes and the non-island CpGs of the RABGEF1 gene compared with the normal gastric mucosa (Fig. 3). The wide hypermethylation rates might be caused by the genomic position of the CpG sites examined and the cell content of the normal and tumor tissues.
The number of PCR cycles is important for an unbiased amplification of the bisulfite-modified heterogeneous sequences. This study performed a minimum number of 32 PCR cycles using a radioisotope for the slightly erroneous PCR products. The heterogeneous tumor tissues in each case tended to have a pattern of increased or decreased methylation differences, but not both differences, in a CpG region that was dependent on the stem-line extent of chromosomal losses (Fig. 4A). Only one case (case 28) contained low-level (two) and high-level (four) chromosomal losses as well as a similar methylation pattern in the heterogeneous sites. These findings support a close relationship between the chromosomal loss and the heterogeneous methylation differences. The biased MSP condition is unlikely given to the pattern of methylation differences measured in the paired normal and tumor tissues.
This multifocal genetic and epigenetic study on gastric carcinomas can explain the tumor progression process based on the stem-line chromosomal losses and the compensative or cooperative reversible epigenetic changes. The extent of the chromosomal losses is believed to drive the diverse progression of a gastric carcinoma via a dosage compensative mechanism that influences the methylation status of the tumor cells.
 XML Download