

 PDF
PDF ePub
ePub Citation
 Print
Print


INTRODUCTION
Renal cell carcinoma (RCC) represents the most common cancer of kidney and accounts for approximately 3% of all adult malignancies in western countries (1). RCC remains primarily a surgical disease requiring early diagnosis to optimize the opportunity for cure. The treatment for patients with RCC who have no clinical signs of distant metastases is radical nephrectomy. However, metastases occur in approximately 30% of these patients, usually within 1 yr. Moreover 30% of patients already have metastases at the time of presentation (2), and in this situation neither chemotherapy nor radiation therapy is effective. Despite the lack of an effective systemic therapy, a small but significant improvement in overall 5-yr survival has been noted due to early detection and advances in surgical management of the disease (3).
A number of investigations have recently undertaken to search for a protein marker for RCC, which can be used for early diagnosis, staging, detection of occult metastatic disease, and to monitor the response to treatment. However, they have been shown to be either nonspecific or insensitive (4). Proteins are key materials to understand cellular functions and disease process, such as tumorigenesis, tumor growth and metastases. Thus, it is expected that protein expression would differ between normal kidney tissue and homologous RCC tissue. Many investigators are currently working on the characterization of RCC using proteome-based techniques. This technique has been shown to be a useful tool to identify novel proteins for diagnosis and prognosis of malignant disease including colorectal carcinoma (5), lung (6), and breast cancer (7). In RCC, Sarto et al. (8) reported a number of polypeptides differentially expressed in RCC by comparing 2-dimensional electrophoresis patterns of whole normal kidney epithelium and RCC tissue.
In this study, we prepared proteins from the RCC tissue and the homologous normal kidney tissue, and analyzed a number of proteins to isolate and identify tumor-specific proteins of RCC by two-dimensional gel electrophoresis.
MATERIALS AND METHODS
Clinical sample
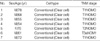
The tissue samples of conventional RCC and the surrounding non-cancerous kidney tissues were prepared from surgical specimens of 7 patients after radical nephrectomy. The study protocol was approved by the Human Subject Research Committee of the Gyeongsang National University. The specimens were examined by a pathologist. Part of the sample was immediately frozen in liquid nitrogen and stored at -80℃ until use. The remaining parts of the samples were taken and processed for histological examination. The tumor stage was determined according the 1997 TNM staging system (9).
Sample preparation for 2-demensional gel electrophoresis
The frozen kidney tissues were washed several times with phosphate-buffered saline (pH 7.2) to remove cell debris and any remaining blood. The samples were homogenized in lysis buffer (0.3 g tissue/l mL buffer) (8 M urea, 2% CHAPS, ampholytes and 1 mM PMSF), and were centrifuged at 100,000 ×g for 10 min at 4℃. The resulting supernatant was kept at -80℃ until use. The total protein concentration was determined by the Bradford method using bovine serum albumin as a standard (10).
Two-dimensional gel electrophoresis
The IPG gel strips (Bio-Rad, CA, U.S.A.) were rehydrated in a swelling solution [7 M urea, 2% CHAPS, 100 mM dithiothreitol, 0.5% IPG buffer (Amersham biosciences), and bromophenol blue] that contained 50 µg (for silver staining) or 500 µg (for Coomassie staining) proteins for 12 hr at 20℃. Isoelectric focusing (IEF) was performed on immobilized pH gradients (IPG, pH 4-7, 18cm) at 20℃ in three steps: at 250 V (15 min), 10,000 V (3 hr), and then for 40,000 Vh using Protean IEF Cell (Bio-Rad, CA, U.S.A.). After the IEF procedure, the strips were equilibrated with a buffer containing 50 mM Tris-HCl, pH 8.8, 6 M urea, 30% glycerol, 2% SDS, and 1% dithiothreitol for 15 min as a first step, and with 2.5% iodoacetamide instead of dithiothreitol for another 15 min as a second step. For SDS gel electrophoresis, a 7.5-17.5% gradient SDS gel was prepared, then an equilibrated IPG gel strip was laid on top of the gel and was covered with 0.5% agarose solution. Gel electrophoresis was carried out at 16℃ at 5 mA/cm (constant current) for 1 hr, and then at 10 mA/cm until the bromophenol blue reached the bottom of the gel. For silver staining, the gel was fixed in a solution (50% methanol and 12% acetic acid) for 1.5 hr; washed in 50% ethanol twice for 30 min each time, and then treated with 0.2% sodium sulfoxide for 1 min. After washing with deionized water 3 times for 1 min each, the gel was impregnated in a solution (0.2% silver nitrate and 0.75 mL/L formaldehyde) for 20 min and washed twice in water. The gel was developed in a solution (2% sodium bicarbonate, 0.0004% sodium sulfoxide, and 0.5 mL/L formaldehyde), and the reaction was stopped by adding 1% acetic acid at the designated time point. For Coomassie blue staining, the gel was soaked in a fixation solution (30% ethanol, and 2% phosphoric acid) for 30 min, then in 2% phosphoric acid for 20 min, and equilibrated in a solution (2% phosphoric acid, 18% ethanol, and 15% ammonium sulfate) for 30 min. The gel was stained in the equilibration solution containing Coomassie Brilliant Blue G-250 for overnight.
Image analysis and protein identification
The protein patterns in the gel were recorded as digitalized images using a high-resolution scanner (GS-710 Calibrated Imaging Densitometer, Bio-Rad, CA, U.S.A.). Four gels were running for each sample. The scanned gel image was analyzed using a standard protocol for PDQuest software (Bio-Rad, Hercules, CA, U.S.A.). Differentially expressed proteins (p<0.05 by Student's t-test) were identified in each patient's tumor sample compared to the corresponding normal kidney sample to form eight independent analyses. Inter-individual comparisons were then made by comparison of reference gels and protein spots found to be significantly higher or lower in all tumor samples compared to corresponding normal kidney samples. For protein identification, we used a Voyager -DE™ (delayed extraction) STR biospectrometry workstation (Applied Biosystems, Forster city, CA, U.S.A.) for MALDI-TOF mass spectrometry. The gel pieces containing the desired protein spots were excised, washed and digested in gel with trypsin (sequencing grade, Boehringer Mannheim) (11). The resulting peptides were then processed for MALDI-TOF/MS. The search for protein identity was performed with reference to the public sequence databases (SWISS-PROT or NCBI) using MS-Fit (http://prospector.ucsf.edu/ucsfhtml13.4/msfit.htm). The data were analyzed using Student's t-test. Statistical significance was set at p<0.05.
RESULTS
We analyzed the proteomic profiles of the RCC tissue and the corresponding normal kidney tissues from 7 consecutive patients with conventional RCC. The mean age of the patients was 65.4 yr (range 54 to 78). The tumor stage of the patients ranged from pT1 through pT3a. The samples were examined histologically to verify the macroscopic cell type (benign or cancer). Necrosis was not seen in the samples. Table 1 shows clinical and pathological features of those patients with RCC.
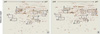
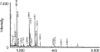
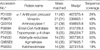
Spots representing proteins that were differentially expressed in RCC were selected (p<0.05 by Student's t-test). A total of 905 spots from a conventional RCC samples and 953 spots from a corresponding normal kidney samples were visualized in a gel (pH range from 4.0-7.0 and a molecular mass range from 10-100 kDa) (Fig. 1). The overall protein expression patterns in clear cell RCC and normal kidney tissues were quite similar except for some areas. Ten specific regions containing some proteins differentially expressed in RCC and normal tissues were further analyzed by comparing their expression patterns in all 7 patients. For the assessment of differentially expressed proteins only protein spots altered in all tumor samples were considered. The protein identities from all the spots were entered in the composite gel database so that any changes in the protein expression could be determined for each protein spot. The integrated protein intensity was determined for each identified spot in seven gels each from the RCC tissues and corresponding normal kidney tissues. The mean intensity of each spot was calculated by its silver stain intensity and the relative intensities between the RCC tissues and normal tissues. Two proteins were dominantly expressed in the conventional RCC and six proteins were revealed largely repressed, these proteins were found with a statistical significance. Some of these proteins have been identified by mass spectrometry. A typical mass spectrum of a protein, aldehyde reductase, is shown in Fig. 2. Total 8 proteins from 11 spots were identified. The expression level of each protein in both RCC and normal tissue was indicated by the density values (Fig. 3, 4). Their predicted values of isoelectrical point (pI) and molecular weight (Mw) are summarized in Table 2, and the values were compatible to those of acquired from the gels. The sequence coverage of proteins isolated from the peptide mass matching in a program was acceptable (19-55% ranges).
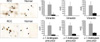
Several horizontal rows of spots were seen on the gel (Fig. 4). These rows of protein spots, which typically had similar molecular sizes but slightly different isoelectrical points, probably were due to posttranslational modifications that change in the protein charge. The protein identities from all spots were entered in the composite gel database so that changes in protein expression could be determined for each protein spot. Integrated protein intensity was determined for each identified spot in seven gels each from RCC and corresponding normal kidney tissues. The mean intensity of each spot was calculated by silver stain intensity, and relative intensities between RCC and normal tissues were compared.
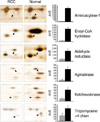
Six proteins showed largely repressed expression in RCC with a statistical significance; aminoacylase-1 in region 1, enoyl-CoA hydratase in region 2, agmatinase and ketohexokinase in region 4, aldehyde reductase in region 5 and tropomyosin α-4 chain in region 9 (Fig. 1, 3). Two proteins were dominantly expressed in RCC (Fig. 1, 4); α-1 antitrypsin precursor in region 3 and vimentin in region 7.
DISCUSSION
The proteomic approach shows great potential to be a powerful tool for the identification of proteins differentially expressed in the normal kidney tissue and RCC tissue, and the characterization of the newly isolated RCC-specific markers might allow for a better subclassification of RCC and the early diagnosis of this disease. In this study, 66 proteins were shown to have either increased or decreased expression (≥2) in RCC (data not shown). Some of these proteins have previously been shown to have an altered expression in RCC. Among them, five proteins were identified as vimentin (12), aminoacylase-1, enoyl-CoA hydratase (13), aldehyde reductase (14), and agmatinase by using MALDI-TOF mass spectrometry (15).
Vimentin, one of the cytoskeletal proteins, was significantly overexpressed in RCC tissue compared with the corresponding normal tissue. A proteome-based study demonstrated a heterogeneous expression pattern of vimentin in different RCC subtypes (12). It is often associated with cellular differentiation, invasion, migration and metastatic potential of tumors (16).
Aminoacylase-1, which is found in many mammalian tissues with the highest activities occurring in the kidney, is usually involved in detoxification processes. It hydrolyzes a variety of N-acylated amino acids generating free amino acids and may be involved in the synthesis of hippurate that is formed during detoxification of aromatic compounds (17). A diminished expression of this enzyme has also been found in lung cancer cell lines of small cell type and pulmonary tumors (18). It is of particular importance that the gene is localized on chromosome segment 3p21.1., a chromosome band found altered in nearly all RCC. The von Hippel-Lindau (VHL) gene, a tumor suppressor gene, is located on chromosome 3p25-p26 (19), and the VHL gene mutations were detected in a high percentage of tumors from patients with conventional RCC (20).
In line with the previous observation, enoyl-CoA hydratase, a short-chain mitochondrial enoyl-CoA hydratase, involved in mitochodrial β-oxidation, was shown to have decreased expression in RCC (13).
Aldehyde reductase is an oxidoreductase that catalyzes NADPH-dependent reduction of a variety of aromatic and aliphatic aldehydes (21). This enzyme is important because of its ability to detoxify a variety of reductive aldehyde species and metabolize certain steroid and neurotransmitter metabolites and glucuronate (22), however, little is known about its physiological role. G250-treated and untreated RCC cell lines were investigated for their protein expression profiles to identify tumor markers, which may allow the selection of patients prior to specific immunotherapy. They found decreased expression of aldehyde reductase in G250-treated RCC cell line (14). This is in line with our observation.
Recently, Dallmann et al. (15) reported that human agmatinaes is diminished in the clear cell type of RCC by proteomic approach. RT-PCR and Nothern blot analyses demonstrated a clearly decreased amount of agmatinase mRNA in tumor cells, and they confirmed the differential expression of agmatinase mRNA at the protein level by Western blot analysis. The expression of agmatinase in this study was also diminished in RCC compared with that in the normal counterpart of kidney (Fig. 3).
α-1 antitrypsin precursor, which present in the proximal tubule of kidney, showed an increased expression in the tumor. Based on the histochemical profile of normal kidney, carcinoma, and oncocytoma, 89% of RCC and 50% of oncocytoma expressed α-1 antitrypsin activity (23). α-1 antitrypsin is a broad spectrum inhibitor of serine proteases, including trypsin protease, chymotrypsin protease, and elastase like enzyme (24). Its major physiological role is the inhibition of leukocytes elastases released at sites of inflammation. The function of α-1 antitrypsin released by epithelial cells is still unclear, although they may play a role in the regulation of growth and proliferation processes. In this study, this enzyme was overexpressed in RCC tissue, suggesting the tumor tissues might need the α-1 antitrypsin activity.
A significantly heterogeneous expression pattern of the different members of the cytoskeleton was found between different RCC cell lines and by comparison of RCC cell lines with corresponding kidney epithelium cell lines. Tropomyosin α-4 chain, one of the cytoskeletal proteins, showed a decreased expression in RCC. It is noteworthy that with the exception of cytoskeletal tropomyosin, cytoskeletal proteins seem to be readily recognized by patients with RCC than by control sera. The reason for the relatively high frequency of cytoskeletal tropomyosin autoantibodies in control sera and their potential role in the development of autoimmune disease requires further investigation using a larger sample number (12). It might be suggested that the loss of potential tumor antigens over time represents an effective strategy of tumors to evade immune recognition.
Ketohexokinase, also called fructokinase, catalyzes the phosphorylation of fructose to fructose1-phosphate. Much of the ingested fructose is metabolized by the liver, using fructose 1-phosphate pathway, and then can be funneled into the universal glycolytic pathway. Although ketohexokinase is most abundant in the liver, it is also found in the kidney, small intestine, and pancreas (25). Glycolysis takes place predominantly in the distal segments of renal tubular system. During the development of rat renal basophilic cell tumors, there is a loss of gluconeogenic enzymes (26). A predominant biochemical alteration in cancer cells is a markedly elevated rate of glucose catabolism (27). Thus, it has been observed that activities of key glycolytic enzymes such as hexokinase and pyruvate kinase are increased in tumor cells compared with normal cells from their tissue of origin. Nonetheless, the increased glycolysis cannot be considered as a general phenomenon in neoplasm. Some brain neoplasm, for example, neuroblastomas (28), and retinoblastoma (29) show decreased hexokinase activity compared with normal brain. This study showed a decreased expression of ketohexokinase in renal tumor tissues. However, it might also be suggested that different types of RCC represent different expression pattern of ketohexokinase, which is eventually involved in glycolysis.
In conclusion, two-dimensional polyacrylamide gel electrophoresis is a powerful tool to comprehensively analyze total proteins that are differentially expressed in RCC. We compared proteomes of the normal human kidney with that of the corresponding renal cell carcinoma tissues in gels, and identified differentially expressed proteins by mass spectrometry. Eight proteins from 11 spots were identified by peptide mass fingerprinting. The expression of six proteins, aminnoacylase-1, enoyl-CoA hydratase, aldehyde reductase, tropomyosin α-4 chain, agmatinase and ketohexokinase, was decreased in RCC. The expression of vimentin and α-1 antitrypsin precursor was largely increased. The study of the protein expression in RCC and the normal kidney tissue may help us to find tumor-specific proteins of these diseases.
 XML Download