

 PDF
PDF ePub
ePub Citation
 Print
Print


INTRODUCTION
The measurement of total body water (TBW) is frequently performed to evaluate the body composition and nutritional status. The accurate measurement of TBW is difficult, and it requires isotopic dilution techniques. Therefore, several indirect equations for estimating the TBW using simple anthropometric variables are commonly employed. However, these equations are largely based on individuals of the western hemisphere.
The purpose of this study was to develop anthropometry-based TBW equations in Korean and to compare these equations with the other available TBW equations. Since it is difficult to perform isotopic dilution techniques on a large number of subjects, we used bioelectrical impedance analysis (BIA), which has been shown to accurately and reliably estimate TBW (1). Therefore, we first measured the TBW using BIA (TBWBIA) in a large study population to develop an anthropometry-based TBW equation. Then to validate this equation, we analyzed the agreement between the TBWBIA and the TBW derived from anthropometry-based equations in another control group.
MATERIALS AND METHODS
A total of 2,943 healthy adults were selected for this study from the 3,781 people visiting the Health Promotion Center (HPC) at Inha University Hospital (IUH) from May to December 2003. The exclusion criteria were as follows: age <18 yr, a serum creatinine >1.4 mg/dL, positive urine protein, subjects who complained of edema, those with an amputation or who had diabetes mellitus, congestive heart failure, chronic liver disease, or those subjects who did not allow BIA to be performed. Among them, 2,223 subjects were used for the development of equations. The remaining 720 subjects were used for the validation of equation. This study was approved by the ethical board of IUH.
After 8 hr of fasting, the subjects visited to the HPC at 9 a.m. Their height (Ht) and body weight (BW) were measured to the nearest 0.1 cm and 0.1 kg using a linear height scale and an electronic weight scale, respectively. The mean values of two measurements were used for data analysis.
BIA (Inbody 3.0, Biospace Co., Seoul, Korea) was performed by a well trained nursing staff. The equipment involves placing eight tactile electrodes on a patient in an upright posture. When the subject was standing on the sole electrodes and gripping the hand electrodes, the microprocessor was switched on and the impedance analyzer started to measure the segmental resistances of the right arm, left arm, trunk, right leg, and left leg at four frequencies (5, 50, 250 and 500 kHz), thus measuring a set of 20 segmental resistances for one individual. The mean values of two sets of BIA measurements were used for analysis. The repeat measured coefficient of variation for TBW was 0.29%, and the day-to-day coefficient of variation of TBW was 1.18%. The accuracy of the 8-point tactile-electrode impedance method on the measurement of TBWBIA was validated on healthy subjects (2). The procedure was performed in 3 min or less and the TBWBIA was automatically calculated from the BIA with equations installed in the instrument's program.
We chose the Watson (3) and Hume-Weyers (4) formulas to compare the accuracy of the newly developed equation:
Watson formula
Male: TBWW=2.447-(0.09156×age)+(0.1074×Ht)+(0.3362×BW)
Female: TBWW=-2.097+(0.1069×Ht)+(0.2466×BW)
Hume-Weyers formula
Male: TBWH=(0.194786×Ht)+(0.296785×BW)-14.012934
Female: TBWH=(0.34454×Ht)+(0.183809×BW)-35.270121
Where age in years, Ht in cm, and the BW in kg.
Statistical analysis
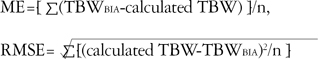
The data were expressed as means±SD. Linear regression analysis was performed to develop the anthropometry-based TBW equation. Stepwise selection was employed using entry and exit criteria of p<0.01. TBWBIA was used as a dependent variable. Sex, age, Ht and BW were used as independent variables. Polynomial terms for continuous variables and multiplicative interaction terms were considered in the model building process. Pearson's correlation coefficient (r) was used to find the relationship between two variables. To analyze the differences in TBWBIA and TBWs derived from anthropometry-based equations, one-way analysis of variance (ANOVA) was performed with using the Bonferroni method for the post-hoc test. To assess the agreement, Bland-Altman plots using the means and differences between TBWBIA and calculated TBW were used (5). To quantitate the degrees of bias, we compared the correlation coefficients of the respective differences and means. The closer the correlation coefficient of Bland-Altman plot was to zero, the less the bias. Root mean square error (RMSE) and mean prediction error (ME) were also used. ME was also an indication of bias, but not of accuracy. The RMSE value was used as a measure of the goodness-of-fit of an equation. If there were more than one equation to fit the data, the one with the smallest RMSE value had the highest precision. The equations used for ME and RMSE are as follows:
A p value less than 0.05 was considered as statistically significant.
RESULTS
Development of anthropometry-based TBW equations
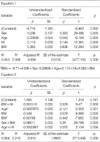
For the 2,223 subjects, the male to female ratio was 1.72:1, the mean age was 45.1±10.9 yr, the mean BW was 64.3±11.0 kg, the mean Ht was 164.9±8.5 cm, and the mean TBWBIA was 34.9±6.6 L. The simple (TBWK1) and complicated (TBWK2) TBW equations based on the anthropometric variables were developed by linear regression analysis (Table 1). The adjusted R2 was 0.908 for TBWK1 and 0.910 for TBWK2.
Validation of newly developed TBW equations
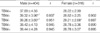
In another 720 control subjects, the male to female ratio was 1.28:1, the mean age was 47.0±11.1 yr, the mean BW was 63.6±10.5 kg, the mean Ht was 163.8±9.3 cm, and the mean TBWBIA was 33.6±6.2 L. In males, TBWBIA showed the highest correlation with TBWH (r=0.951), followed by TBWK1 (r=0.945), TBWK2 (r=0.945) and TBWW (r=0.937) (Table 2). There were no differences between the TBWBIA and TBWK1 or TBWK2. However, TBWW and TBWH were significantly larger than the TBWBIA. There were significant differences between TBWW and TBWK1 or TBWK2 and between the TBWH and TBWK1. In females, TBWBIA showed the highest correlation with TBWW (r=0.902), followed by TBWK2 (r=0.895), TBWK1 (r=0.890), and TBWH (r=0.887). There were no differences between TBWBIA and TBWW, TBWK1 or TBWK2. The TBWH was significantly larger than the others.
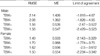
In males, the TBWK1 and TBWK2 showed the lower RMSE (1.58, 1.58, 2.14, and 2.08 for TBWK1 TBWK2 and TBWW TBWH, respectively) and ME (0.526, 0.547, 1.426, and 1.362 for TBWK1 TBWK2 TBWW and TBWH, respectively) than the TBWW and TBWH (Table 3). On the Bland-Altman plot, the correlations between the difference and means were smallest for the TBWK2 (r= -0.192), followed by the TBWK1, TBWW, and TBWH (Fig. 1A, C, E, G). In females, the RMSEs were smallest for the TBWW, followed by the TBWK2, TBWK1, and TBWH (1.49, 1.50, 1.62, and 1.70 for the TBWW, TBWK2, TBWK1 and TBWH, respectively). The ME was closest to zero for the TBWK2, followed by the TBWK1, TBWW and TBWH (0.554, 0.556, 0.593, and 0.988 for the TBWK2, TBWK1, TBWW and TBWH, respectively). The correlation coefficients between the means and differences were highest for the TBWW (r=-0.553), and lowest for the TBWK2 (r=0.057) (Fig. 1B, D, F, and H).
DISCUSSION
In this study, we developed two anthropometry-based TBW equations (TBWK1 and TBWK2) for Koreans using TBWBIA as a reference. Among them, TBWK2 showed the highest precision and the smallest bias for males and a similar precision and the smallest bias for females compared to the TBWs derived from Watson or Hume-Weyers formulas.
Accurate estimation of the TBW is important in many pathophysiologic states, as the clinical symptoms and signs of volume dysregulation complicate a variety of medical and surgical conditions. Furthermore, the disposition of electrolytes, enteral and parenteral nutrition, and selected drugs largely depends on the size and distribution of the TBW space. As the majority of TBW resides in the skeletal muscle, TBW may also be used as estimates of somatic protein stores (6).
The need for an accurate measurement of the TBW is particularly important for dialysis patients, as it equates to the distribution volume of urea (V). In hemodialysis (HD) patients, urea is the substance that is most often monitored as a surrogate for measurement of dialysis adequacy (7). A dose of HD (prescribed or delivered) is best described as the fractional clearance of urea as a function of its distribution volume (Kt/V) (8). However, in the dialysis centers, it is not easy to measure TBW each time using an accurate method such as BIA. For convenience, the Kt/V is automatically calculated using a computerized program in which the TBW equations are installed by simply entering height, sex, the pre- and post-HD blood urea nitrogen concentration, the ultrafiltration amount and duration of HD. For the calculation of V, the Watson and Hume-Weyers formulas are generally recommended (9). However, these TBW equations were mainly derived from the age, gender, height and weight of a western population. These equations have not been validated in a Korean population, nor have their accuracies been compared with a race-specific formula. In this study, we found that the TBW equations derived from a western population showed greater bias than our formulas. They tended to overestimate the small TBWs and underestimate large TBWs. Compared to Caucasians, Koreans are smaller with lower body weights and lower values of TBW (10). Therefore, it is natural that systematic errors occur when applying the prediction formula from a reference population to another population under study. Several studies have pointed out that race-specific TBW equations should be used when applying them to another race with a different body build (11-13). Considering this background, TBWK2 may be helpful for assessing the nutritional status and dialysis adequacy more exactly for the Korean healthy control population and the Korean patients with end-stage renal disease.
In this study, TBWW showed a lower RMSE value than the TBWK2 in females. Therefore, TBWW might have a better accuracy than TBWK2, at least in females. However, TBWW showed a greater bias than TBWK2, as shown in Fig. 1B, H. TBWK2 had a similar RMSE value and its ME was closer to zero than TBWW. Furthermore, it had the least bias in females. Therefore, TBWK2 seemed to be more suitable for the estimation of the TBW in Korean females.
In this study, TBWs estimated from the Watson and Hume-Weyers formula showed overestimation in small TBWs and underestimation in large TBWs. The reason for this might be due to the characteristics of subjects when the Watson and Hume-Weyers formulas were derived. For the Watson formula, the mean TBW was between 36.7 and 44.1 L in males and between 31.4 and 33.2 L in females (3). For the Hume-Weyers formula, the mean TBW was between 35.3 and 46.2 L in males and between 30.2 and 39.8 L in females (4). Therefore, when the TBWs were out of those ranges, the TBWs estimated from the Watson and Hume-Weyer formula seemed to over- or under-estimate the real TBWs.
There are several limitations to this study. First, TBW was estimated using BIA rather than using deuterium oxide or another standard dilution method. However, any methods, even the gold standard methods, for the assessment of TBW are based upon assumptions that allow for some inherent errors. Furthermore, the gold standard methods are expensive, laborious and hard to apply to a large number of subjects, as in this study. BIA does have several advantages; it is easy to use, rapid, non-invasive, inexpensive and applicable at the bedside. Several studies have shown that TBW can accurately and reliably estimated by BIA in normal healthy subjects (1, 14, 15). We used segmental BIA by the eight-polar tactile electrode impedance method. Segmental BIA reduced the errors from whole body BIA estimation (16). The accuracy of the TBW assessment by this method has been validated in control subjects (2). Second, the subjects of this study were not randomly selected from nationwide regions. Therefore, the study subjects may not be representative of the entire Korean population. In spite of this problem, the number of study subjects was large enough to overcome this drawback. We also validated the accuracy of newly developed equations in another set of subjects. Third, for the males, the newly developed TBW equations (and even the TBWK2) still showed weak correlation between the means and differences in the Bland-Altman plot. Thus, the TBW derived from TBWK2 might underestimate the real TBW in men with large BW. Fourth, this study was limited to the healthy subjects. Therefore, it should be validated for patients with the volume disorders such as acute renal failure, liver cirrhosis with ascites, ESRD, congestive heart failure, and nephrotic syndrome.
In summary, our race specific anthropometry-based equation provides superior or at least similar precision of TBW, compared to Watson or Hume-Weyers formula, in Korean subjects, with least bias. This equation may be useful for the estimation of TBW in a large number of subjects.

 XML Download