

 PDF
PDF ePub
ePub Citation
 Print
Print


INTRODUCTION
Atrial fibrillation (AF) is characterized by irregularly irregular RR intervals (1-3), resulting in beat to beat variations of left ventricular (LV) performance due to continuous changes in left ventricular filling (preload) (4, 5), contractility including mechanical restitution in the interval-force relation (6, 7), and diastolic aortic pressure (afterload) (5). This variation makes it difficult to measure LV function quantitatively with reproducibility (8-10), and thus new parameters that are independent of the irregularity of RR intervals are necessary (11).
In contrast to the difficulty of evaluating LV function, irregular RR intervals in AF give an opportunity to apply theoretical hemodynamic and mechanical mechanisms clinically, although the situation is rather complicated (4-7). The Frank-Starling mechanism is the relation between end-diastolic cardiac muscle length or pressure and contractility. Mechanical restitution is the return of the contractile strength of cardiac muscle after it has been depolarized. This is independent of preload as the phenomenon is working at experiment using an isolated strip of cardiac muscle fixed at both ends (12). In addition, aortic pressure is involved. The longer the preceding RR interval is, the higher is the end-diastolic volume and/or pressure, the more complete is the restitution of cardiac muscle and the lower is the aortic pressure, resulting in the higher cardiac performance.
In AF, LV performance is dependent not only on the preceding RR interval (RR-1) but also on the prepreceding RR interval (RR-2) (8, 9, 13, 14). A beat with a shorter RR interval produces a smaller stroke volume and subsequently a higher end-diastolic LV volume and a lower diastolic aortic pressure. Consequently cardiac outflow increases for the next beat. Extrasystolic potentiation may also work (7). Therefore, the integrated effects of the above phenomena according to RR-1 and RR-2 determine cardiac performance in AF.
To obtain the direct relation between RR intervals and LV performance in AF, it is necessary to adjust the mutual influences between RR-1 and RR-2. Recently we reported a new and easy method of improving the relation between RR intervals and cardiac performance in AF (15). The relation between RR-2 and cardiac performance was improved by excluding the coordinates with RR-1 <0.5 sec. The relation between RR-1 and cardiac performance was also improved by adjusting for the effect of RR-2 using the equation obtained from the relation between RR-2 and cardiac performance. In addition, we suggested that the relation between RR intervals and cardiac performance might be correlated with LV function. RR-2 played a more important role in patients with LV dysfunction than in those with normal function.
The aim of this study was to identify RR interval-independent parameters to measure LV function quantitatively in AF from the relation between RR intervals and LV performance based on hemodynamic and mechanical mechanisms.
MATERIALS AND METHODS
Patients with AF referred for echocardiography were studied prospectively. Among these, patients with most RR intervals <0.6 sec or >1.0 sec were excluded and 18 patients with RR intervals distributed evenly between 0.6 and 1.0 sec were enrolled. These patients were divided into two groups by LV function; Normal Group with a normal LV function (n=9) and LV Dysfunction Group (n=9). LV function was determined by visual estimation by echocardiography.
Two-dimensional and Doppler echocardiograms (Hewlett-Packard Sonos 2000, 2.5 MHz transducer) were performed in left lateral position. Dimensions were measured according to the American Society of Echocardiography standards (16). Fractional Shortening (FS) was measured using an M-mode echocardiogram at the beat with the longest RR-1. A total 35-40 consecutive LV outflow ejection velocities were recorded at the paper speed of 50 mm/sec with pulsed Doppler ultrasound from the apical 5-chamber view with a sample volume positioned in the left ventricular outflow track immediately proximal to the aortic valve. Electrocardiogram was recorded simultaneously and LV peak ejection velocities (Vpe) and RR intervals were measured.
The relation between RR interval and Vpe was obtained using the method reported previously (15). Briefly, the logarithmic equation for the relation between RR-2 and Vpe was obtained after excluding the coordinates with RR-1 <0.5 sec. The logarithmic equation for the relation between RR-1 and Vpe was calculated after adjusting for the influence of RR-2 on LV performance using the equation from the relation between RR-2 and Vpe.
After the adjustment, the coordinates with RR-1 <0.6 sec or >1.0 sec were excluded, and the logarithmic equation between RR-1 and Vpe for the coordinates with RR-1 between 0.6 and 1 sec was recalculated.
From the equations, the squared correlation coefficient (r2), slope, Vpe at RR-1 or RR-2=1 sec (Vpe-1), and the ratio of slope to Vpe-1 (Slope/Vpe-1) were calculated. To find parameters representing LV function, these variables were compared with the groups determined by visual estimation of LV function and with fractional shortening.
Data are presented as mean±SD. To compare the continuous variables between Normal and LV Dysfunction groups, the Mann-Whitney U test was used. For the comparison of frequency, the χ2 test or Fisher exact test was used. Spearman correlation analysis, logistic regression analysis and linear regression analysis were used to analyze parameters associated with LV function. Statistical significance was inferred at p<0.05.
RESULTS
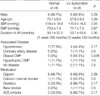
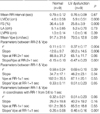
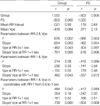
Clinical characteristics, associated diseases and medications are summarized in Table 1. There were no significant differences between the two groups except for a higher proportion of dilated cardiomyopathy in LV Dysfunction group (p=0.029). In echocardiographic findings, LV Dysfunction group had larger LV dimension and lower fractional shortening than Normal group, as were expected (Table 2).
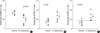
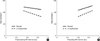
In the relation between RR-2 and Vpe, the Slope/Vpe-1 was lower in LV Dysfunction group than in Normal group (-0.47±0.23 vs. -0.15±0.10, p=0.001, Table 2, Fig. 1A). In addition, there were significant differences in slope (p=0.006, Fig. 2A) and r2 (p=0.004) between the two groups (Table 2).
In the relation between RR-1 and Vpe, the Slope/Vpe-1 was higher in LV Dysfunction group than in Normal group (0.51±0.23 vs. 0.33±0.11, p=0.05, Table 2, Fig. 1B). In the relation between RR-1 and Vpe in the coordinates with RR-1 from 0.6 to 1 sec, the Slope/Vpe-1 was higher in LV Dysfunction group than in Control group (0.46±0.16 vs. 0.26±0.08, p=0.001, Table 2, Fig. 1C). The slope was steeper in LV Dysfunction group than in Normal group although it did not reach statistical significance (p=0.16, Fig. 2B).
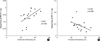
By Spearman correlation analysis, the relationship between the groups determined by visual estimation of LV function and the various parameters was found to be similar to the results shown in Table 2 (Table 3). By multivariate logistic forward regression analysis, Slope/Vpe-1 in the relation between RR-2 and Vpe was the most significant parameter to discriminate between Normal and LV Dysfunction groups.
The relations of fractional shortening with the various parameters were similar to those of the groups (Table 3, Fig. 3). By multiple linear stepwise regression analysis, fractional shortening was independently associated with Slope/Vpe-1 in the relation between RR-2 and Vpe.
In contrast to the above results, the Slope/Vpe-1 in the relation between RR-1 and Vpe in coordinates with RR-1 from 0.6 to 1 sec was found to have the greatest power to discriminate between Normal and LV Dysfunction groups compared with the other significant variables, including Slope/Vpe-1 in the relation between RR-2 and Vpe. At a dividing value of 0.35, the positive and negative predictive values were 89% and 100% respectively (Fig. 1C).
DISCUSSION
This study demonstrates that several parameters derived from the relation between RR interval and ventricular performance are closely associated with LV function, and that these parameters might be helpful for the quantitative measurement of LV function and for the discrimination of AF patients with LV dysfunction from those with normal LV function.
In AF, it is difficult to evaluate LV function quantitatively with reproducibility because of continuous change of LV performance according to irregular RR intervals. Irregularity of RR intervals results in a continuous change of preload, myocardial contractility and afterload (1-7). Therefore, stroke volume varies and classic indicators for LV function, such as fractional shortening or ejection fraction, also change beat to beat (17). In a previous report, a mean of 13 Doppler waveforms were required in AF to estimate cardiac output with a variability of less than 2% (10). When rapid ventricular response is not controlled, the classic indicators underestimate LV function despite normal intrinsic contractility (18, 19). Therefore, it is necessary to develop new methods to represent LV function independent of the variation of RR intervals in AF (11).
In contrast to the difficulty in the evaluation of LV function, irregular RR interval in AF gives an opportunity to apply theoretical hemodynamic and mechanical mechanisms, such as the Frank-Starling mechanism, mechanical restitution in the interval-force relationship, postextrasystolic potentiation, and afterload clinically (4-7). The parameters from the relations between RR intervals and LV performance determined by these phenomena are independent of the irregularity of RR intervals. Here we tried to find new parameters from these relationships to represent LV function quantitatively in AF.
A few number of reports have evaluated the effect of LV function on the relation between RR-2 intervals and cardiac performance in AF, and the results are conflicting (14, 20). Kerr et al. reported that the relation between RR interval and the aortic velocity-time integral was similar in patients with normal and impaired LV functions and that stroke volume variability was not influenced by LV systolic function (14). However, Nagahama et al. reported that the fractional increase of Vpe following short RR-2 was greater in patients with impaired LV function than in those with a normal LV function (20). In previous study, we showed that r2 between RR-2 and Vpe was negatively associated with fractional shortening, and suggested that RR-2 might have greater influence on the change of Vpe in patients with LV dysfunction than in normal subjects (15).
In the present study, the slope between RR-2 and Vpe was steeper in LV Dysfunction group than in Normal group (p=0.006, Table 2, Fig. 2A). This finding means that changes in RR-2 cause greater variations of Vpe in LV Dysfunction group than in Normal group, which is consistent with previous reports by Nagahama et al. and by ourselves (15, 20). In the former study, they calculated only the difference of Vpe at RR-1=0.75 second between the shortest and the longest quartiles of RR-2, and then compared between the patients with impaired LV function and with normal LV function.
To our knowledge, no report has tried to obtain clinical parameters representing LV function from the relation between RR-1 and ventricular performance in AF, although the differences are expected considering the Frank-Starling and mechanical restitution mechanisms. For example, a shorter RR interval results in a lower stroke work due to a lower end-diastolic volume and/or pressure in the Frank-Starling mechanism, incomplete restitution in the time-force relationship and a higher aortic pressure, and vice versa. In the present study, the slope was steeper and Vpe was lower in LV Dysfunction group than in Normal group although these differences were statistically insignificant due to the small number of cases (Table 2, Fig. 2B).
In atrial fibrillation, both RR-1 and RR-2 influence LV performance (8, 9, 13-15). To observe the precise relation between RR intervals and LV performance, it is necessary to correct the mutual influence of RR-1 and RR-2 on LV performance. Recently we reported a new method improving of the relation between RR interval and cardiac performance (15). The relation between RR-2 and cardiac performance was improved by excluding coordinates with RR-1 <0.5 sec. The relation between RR-1 and cardiac performance was also improved by adjusting for the influence of RR-2 using the equation obtained from the relation between RR-2 and Vpe. After this adjustment, RR-1 could explain 72% of the variation of Vpe and the value was consistent with those derived from sophisticated equations of previous reports (8, 9). In the present study we adopted these methods to rule out the effect of RR-2 on the relation between RR-1 and Vpe. So the effects of changes in end-diastolic LV volume, postextrasystolic potentiation and aortic pressure according to RR-2 variation could be removed.
In this study, we adopted an arbitrary parameter, the ratio of the slope to Vpe at RR-1 or RR-2=1 sec (Slope/Vpe-1), to increase the power of discrimination between Normal and LV Dysfunction groups. The slope between RR-2 and Vpe was steeper in LV Dysfunction group than in Normal group (p=0.006, Table 2, Fig. 2A). Vpe at RR-2=1 sec was lower in LV Dysfunction group than in Normal group, although this did not reach statistical significance due to the small number of cases (p=0.06, Table 2, Fig. 2A). A new parameter, Slope/Vpe-1 between RR-2 and Vpe, was found to be more closely associated with LV function than slope or Vpe-1 alone (p=0.001, Table 2, Fig. 3A). In multivariate analysis, this parameter was the only parameter independently correlated with fractional shortening or LV function estimated visually. However, there was considerable overlap of this parameter between Normal and LV Dysfunction groups (Fig. 1A).
We also calculated Slope/Vpe-1 from the relation between RR-1 and Vpe. Of these parameters in the relation between RR-1 and Vpe, only Slope/Vpe-1 was significantly associated with LV function (p=0.05, Table 2, Fig. 3B). However the association was not as close as that of Slope/Vpe-1 derived from the relation between RR-2 and Vpe (p=0.001, Table 2, Fig. 3A), and became insignificant by multivariate analysis.
Mechanical restitution in interval-force relationship and LV filling are nearly completed in 0.5 sec after depolarization, and the remaining effect is minimal (12, 13, 15). The relation between RR-1 and Vpe can be divided into two zones (3, 13, 15). With shorter RR-1, the slope is steep and Vpe deviates less from the regression line. At longer RR-1, the relation has a gentle slope and the deviation of Vpe from the regression line is higher. Therefore, the differences in the distribution of RR-1 in each case can influence the parameters including slope and Vpe. To minimize these effects, the relation between RR-1 and Vpe was analyzed in the beats with RR-1 from 0.6 to 1 sec. Among the parameters calculated in this range, Slope/Vpe-1 was the most significantly associated with LV function (p=0.001, Table 2, 3). Although this association was not as close as that of Slope/Vpe-1 in the relation between RR-2 and Vpe (p=0.001, Table 2), this parameter was the most useful to discriminate between LV Dysfunction and Normal groups, and was superior to Slope/Vpe-1 in the relation between RR-2 and Vpe. The positive and negative predictive values were 89% and 100%, respectively (Fig. 1C).
There are several limitations in this study. We used Vpe to show cardiac performance. Although several studies have used Vpe (3, 7, 13), most studies adopted stroke volume, cardiac output (1, 2), velocity-time integral (18) or ejection fraction (4). As the scattergrams of these studies appear similar, we thought that the difference in the measurement of cardiac performance might be insignificant. In contrast, Vpe may have several advantages, such as less time consuming and less variation of measurement than the other parameters. In this study, we assumed a logarithmic relation between RR intervals and Vpe, which did not fit all coordinates exactly. However, it was the best one among simple relationship models. In addition, the logarithmic relation fitted very well in the relation between RR-1 and Vpe in the coordinates from 0.6 to 1 sec.
In summary, we suggest that several parameters derived from the relation between RR intervals and cardiac performance based on hemodynamic and mechanical mechanisms may be useful to represent LV function quantitatively, and to discriminate AF patients with LV dysfunction from those with normal function. These parameters are independent of the irregularity of RR intervals. Further study will be needed to validate these parameters.
 XML Download