

 PDF
PDF ePub
ePub Citation
 Print
Print


INTRODUCTION
The incidence of colorectal cancer is rapidly increasing in Korea as the life style and the dietary pattern change. The incidence has been increased about 200% in recent 15 yr occupying more than 10% of total cancer incidence in Korea (1). Accordingly, the hospital charges related to colorectal cancer show huge expansion (2). Therefore, it has become very important to predict the hospital charges related to the colorectal cancer for the allocation of medical resources and the establishment of medical policies in Korea.
There are several researches related to the prediction of hospital charges of cancer patients using a statistical analysis such as regression or aualysis of variance (3-5). Since most of these researches were based on a small number of variables among many affecting the hospital charge, their prediction accuracy was less satisfactory than expected. For example, Penberthy et al. developed the prediction models for hospital expense of elderly patients with breast, colorectal, lung or prostate cancers but the R-square values were only 38-49% (4). In this aspect, better prediction models for cancer care costs are warranted. In the meantime, data mining has emerged as an analytical method which can discover interesting knowledge from tremendous data using various technologies from diverse domains such as pattern recognition, statistics, database, machine learning and so forth (6). To achieve various objectives, data mining techniques such as association rules, cluster analysis, classification, artificial neural network (ANN), decision tree, genetic algorithm are used. Among these, we built hospital charge prediction models using ANN and decision trees because these two methods are able to use more various types of data than statistical methods.
MATERIALS AND METHODS
Dataset
The dataset is based on the digitalized records of colorectal cancer patients who have been treated in Kyung Hee University Hospital from January 1999 to December 2002. This hospital had more than 130,000 admissions, 4,000,000 out-patients' visits and 5,000 newly diagnosed cancer patients during the period. Among them, 492 patient's 1,022 admission records with 154 variables were used to build prediction models. The median number of admission for a patient is 2.1 (ranges 1-14) and the average days of admission were 11.38 days.
Korea has a single national health insurance system for all the Korean people by the national policy. The health insurance system provides only a portion of total charges of the patients. For example, the medical charges are composed of two parts, one is paid by health insurance and the other is paid by patients. The charges for hospital diet, the charges for superior class room, charges for assigning a specified doctors, and the charges for some expensive radiological examinations such as MRI or ultrasonography are 100% paid by patients. The other parts are paid 20% by patients and 80% by health insurance. So, we have analyzed both the charges paid by insurance (charge A) and the charges paid by patients (charge B) to reveal actual financial burden of the patients.
Preprocessing of raw data
The initial dataset cannot be used without preprocessing because it has so many variables, some of which has quite a few null values. So variable selection is one of the most careful steps since the prediction accuracy depends on the set of variables used for the analysis. In general, building models with a subset of appropriate variables results better accuracy than with a total set (7). Thus we have performed variable selection and null value processing with the help of medical domain experts. For example, fields 'operation_1' to 'operation_10' each consisting of a two-digit doctor code and a two-digit operation number have many null values, because it is rare that a patient receives more than ten operations during an admission period. So, we derived a new field 'operation_count', which simply stores the sum of the numbers of operations, thereby reducing both the number of null values and the number of fields. Similarly, fields 'diagnosis (Dx)_1' to 'diagnosis_12' store all the disease codes of a patient. We categorized these fields into 6 'cancer_code' fields and 12 'other_Dx' fields and additionally created 'other_Dx_count' field to store the number of other diagnosis. Each 'cancer_code' field denotes the location of primary cancer according to International Classification of Diseases for Oncology-3 (ICDO-3) and each 'other-Dx' field stores disease codes other than cancer. We further divided 'other_Dx' into 23 groups, creating 'other_ Dx_group_1' to 'other_Dx_group_23', each of which represents a disease group according to the Korean Standard Classification of Disease. ICD-9CM procedure codes stored in 'Mx_1' to 'Mx_10' fields were categorized into 4 groups according to the treatment taken to each patient, such as OPx, RTx, RDx and CTx, related to operational treatments (OPx), radiological tests (RDx), radiation therapy (RTx) and chemotherapy (CTx), respectively. As a consequence, 61 new fields were derived and among these 38 fields were selected as input variables. Then, we divided the dataset into a training dataset (681 records: 67%) and a test dataset (340 records: 33%), using stratified sampling method. We used Clementine 7.1 program to build ANN and classification and regression tree (CART) models.
Artificial neural network model
Artificial neural network models are created using a training dataset. After many attempts to train neural networks, two ANN models were created heuristically using training dataset. We named models for hospital charge A and hospital charge B as NN-A and NN-B respectively. Test dataset was used to test the models' prediction accuracy. 38 input variables are listed in Table 1.
Classification and regression tree model
Similarly, we built two CART models, CART-A for charge A and CART-B for charge B. We used the same 38 input variables which were used for ANN models. When creating CART models, the Gini index which represents a level of impurity of a node is used as a basis for splitting the node. Training dataset and test dataset were identical to those for building and testing the ANN models.
RESULTS
ANN model
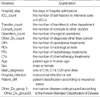
Sensitivity analysis conducted while building the NN-A model reveals that the most important variables were 'hospital_stay' (relative importance 0.692) followed by 'other_Dx_group2' (0.190), 'hospital_infection' (0.109), 'other_Dx_group 5' (0.079), 'other_Dx_group7' (0.078), 'other_Dx_group17' (0.068), CTx (0.067) and 'main_diagnosis' (0.062). In the training dataset, the mean absolute error was 554,972 won and the linear correlation was 0.886 while in the test dataset, the mean absolute error was 683,093 won and the linear correlation was 0.813. These coefficients suggest that there was a strong linear correlation between the actual and the predicted hospital charges.
The important variables of the NN-B model were 'hospital_stay' (relative importance 0.299), 'other_Dx_group2' (0.168), 'other_Dx_count' (0.103), 'other_Dx_group6' (0.059), 'other_Dx_group19' (0.059), 'operation_count' (0.054), 'other_Dx_group23' (0.053), 'patient_diff' (0.051), and 'hospital_infection' (0.048). In the training dataset, the mean absolute error was 343,372 won and the linear correlation was 0.764, while in the test dataset, the mean absolute error was 357,254 won and the linear correlation was 0.746. The linear correlation was weaker than in model NN-A, but it was still high in this model. Prediction errors among these neural net models including the mean absolute error and the linear correlation were compared in Table 2.
CART model
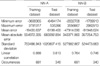
CART-A was created as a decision tree with 16 leaf nodes in 8 levels. Several important rules from the created decision tree are as follows: 1) IF 15.5≤'hospital_stay' THEN charge A=4,000,707 (191 cases), 2) IF 5.5≤'hospital_stay'<15.5 and 'operation_count'>=0.5 THEN charge A=2,648,716 (71 cases), 3) IF 'hospital_stay'<1.5 and 'age'>=52.5 and CTx>0.5=THEN charge A=1,437,424 (67 cases), 4) IF 'hospital_stay'<4.5 and CTx<0.5 THEN charge A=523,286 (65 cases), 5) IF 5.5≤'hospital_stay'<15.5 and 'operation_count'<0.5 and 'other_Dx_group5'>=0.5 and 'other_Dx_count'<1.5 THEN charge A=2,784,923 (58 cases). The numbers at the end of each rule indicate the number of patients whose charge A can be predicted by the rule. Charge A of 452 patients out of the 681 patients was able to be predicted by the above five rules. The variables and values of the above rules played an important role in predicting the charge A. Besides these variables, the 'sex' variable was also used as a split criterion. In the training dataset, the mean absolute error was 645,227 won and the linear correlation was 0.784. In the test dataset, the mean absolute error was 754,530 won and the linear correlation was 0.713.
CART-B was created using the same input variables as in CART-A. Since the total amount of charge B is relatively smaller than that of charge A, the initial tree has made many partitions even with small intervals of charge. So we pruned its branches and simplified the tree into four levels. The major variables used for the splits were 'hospital_stay', 'RDx', 'main diagnosis', 'OPx', 'other_Dx_group3', 'age', and 'sex'. In the training dataset, the mean absolute error was 299,721 won and the linear correlation was 0.804. In the test dataset, the mean absolute error was 345,066 won and the linear correlation was 0.720. Prediction errors of these neural net models were compared in Table 3.
Comparison of the two models
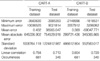
We have built four predictive models for hospital charge, NN-A, NN-B, CART-A and CART-B. These models were compared with respect to the linear correlation coefficient and the mean absolute error (Table 4). In predicting the charge A, NN-A showed a better the linear correlation coefficient than CART-A for both datasets. And in predicting the charge B, NN-B showed a better linear correlation coefficient than CART-B only for the test dataset. In the aspect of the mean absolute error, CART-A was inferior to NN-A but CART-B was superior to NN-B in both datasets.
DISCUSSION
In the previous studies related to the hospital charge of cancer care patients, statistical models showed limited explanatory power because of the limitations both in the data type and in the number of input variables (3-5, 8, 9). There were several researches to build prediction models with regression analysis for the health care costs (3, 4, 10). Penberthy et al. developed the prediction models for medicare cost of elderly patients who had suffered from breast, colorectal, lung or prostate cancers, resulting R-square values of 0.38 to 0.49 (4). Brooks et al. analyzed the health care cost for the patients undergoing hysterectomy for endometrial carcinoma (3). They used linear, stepwise and three-stage regression analyses to build a prediction model with resulting R-square value of 0.71. Tollestrup et al. applied Tobit regression model to breast cancer dataset and investigated whether the hospital charge for Hispanics was different from that of non-Hispanics (5). But the prediction error was not described in this article. Therefore, these regression models had significant limitations to be used for the prediction of hospital charge.
Up to the present, studies about the prediction of hospital charge of cancer patients using a data mining method are very rare. There have been some artificial neural network analyses in the medical field for other concern. Ismael et al. developed the predictive ANN models of hospital charge for acute coronary syndrome patients and compared the performances of these models with one another (11). They used 16 input variables representing the patient's status and complication and built four models for hospital charge. Among them, two models have shown the classification accuracy of 79%. Marshall et al. combined Bayesian belief network and phase-type distribution to build models for predicting the number of days of hospital stay for geriatric patients (12). Walczak and Scharf built models to predict the amount of blood which is needed in operations using ANN based on the radial basis function (13). They showed that the prediction accuracy of ANN models is better than that of MSBOS (Maximum Surgical Blood Order Schedule). ANN has also been used to compare cancer patient's prognosis. Burke et al. reported that the ANN was significantly more accurate than TNM staging system when both use the TNM prognostic factors alone (14).
Though the success of ANN in medical field is being demonstrated in many areas, the ANN is not widely used as an alternative of the statistical method to predict hospital charges until recently. In fact, there are debates whether the performance of ANN is better than statistical methods. In an article comparing ANN with statistical method, Sargent suggested that the artificial neural network should not replace standard statistical approaches as the method of choice for the classification of medical data (15). They referred the reason why ANN is not universally outperforming a regression technique to the limited amount of data and incorrectly measured variables. Regarding this aspect, Michie et al. reported that the success of the ANN is correlated directly with the success of the statistical procedures used (16). As a consequence, to have a good prediction result in ANN analysis, it is important to analyze integrated medical data to select appropriate features. Thus in our study, the feature selection was performed by medical domain experts who can identify and differentiate the diverse medical data so as to result in a good prediction performance. ANN being very useful when creating predictive models where the interrelationships and the behavior of the various problem parameters are unknown (17), it may allow users to create predictive models without explicitly specifying such information.
If we consider the results only from the test dataset in terms of the linear correlation, NN-A and NN-B were better than CART-A and CART-B. But for the mean absolute error, NN-A was better than CART-A while NN-B was worse than CART-B. Though we can not generalize which one is absolutely superior to the other, we suggest that ANN model is better than CART model to predict the charges of the colorectal cancer patients in Kyunghee University Hospital.
Our study has some limitations. First, when the target variable is a binary variable or a nominal variable, the models can be compared with the accuracy matrix generated by data mining system. But the target variables in this study were neither the cases so we cannot compare them with such an accuracy matrix. Second, the dataset we used did not include all the clinical information such as disease stages and pathologic cell types of the cancer. These variables, when added to our dataset, may enable us to build a more accurate prediction model in various aspects but they are not available in a digitalized form, yet. Our current study was designed to focus on the colorectal cancer patients for this reason. The colorectal cancer patients had a relatively homogenous clinical stage and pathologic cell type. That is, more than 80% of patients were advanced stage and the pathologic cell types were adenocarcinoma in more than 95%. Thus the patients shared almost the same treatment protocol including surgery, chemotherapy and radiotherapy to the extent that the effect of staging and pathologic cell type has been considerably offset. But we are planning to build a complete model including the entire patient's data to predict the charges of whole spectrum of cancer patients with the introduction of electric medial record (EMR) in the hospital.
 XML Download