

 PDF
PDF ePub
ePub Citation
 Print
Print


INTRODUCTION
Bronchiectasis is defined as a localized, irreversible dilatation of the bronchial tree (1). Currently, high-resolution computed tomography (HRCT) is commonly used to grade severity and extent in bronchiectasis (2, 3). The severity of airflow obstruction was found to be related to the extent of bronchiectatic segments as demonstrated on HRCT (4-6). Extensive bronchiectatic changes result in a restrictive defect due to a reduction in vital capacity (7), whereas productive sputum causes obstructive impairment through mucosal thickening and sputum retention (6, 8). Moreover, exacerbations of bronchiectasis precipitated by frequent infection may accelerate the deterioration of lung function (9, 10). However, few published data are available concerning the assessment of physiologic status with respect to the radiologic degree of bronchiectasis and a positive bacterial culture based on objective and simplified measurements (4, 11, 12). We have carried out a retrospective study on the relationship between the extent and severity on HRCT, pulmonary function and bacteriology in stable bronchiectasis.
MATERIALS AND METHODS
Subjects
Forty-nine patients with bronchiectasis, confirmed with HRCT, were included in the study. 'Stable' bronchiectasis was defined where symptoms of acute exacerbation were absent. Symptoms of acute exacerbation of bronchiectasis were change in sputum production, increased dyspnea, increased cough, hemoptysis, fever (body temperature, ≥37.5℃), increased wheezing, reduced lung function, radiographic changes consistent with a new pulmonary process, and changes in chest sounds (1, 13). Patients with secondary bronchiectasis due to post-tuberculous sequelae, patients with recent lower respiratory tract infection, patients with a history of significant dust exposure, and patients with pleural change or heart disease affecting lung function were excluded. The study was approved by the Ethics Committee at our hospital.
HRCT scanning
The CT scans were performed using a HiLight Advantage scanner (GE medical system, Milwaukee, WI, U.S.A.). Patients were scanned during full suspended inspiration from the lung apex to the diaphragm, and 1.5 mm sections were obtained at 20 mm intervals. A high spatial frequency algorithm was used for image reconstruction. The high-resolution images obtained were displayed at a window level of -700 HU and at a window width of 1,500 HU, as appropriate for lung parenchyma.
CT scoring
Two chest radiologists independently reviewed the CT scans in random order. Any differences in readings were resolved by consensus. Bronchiectasis was defined as cylindrical when the bronchial lumen had a smooth tubular outline, as varicose when the lumen had a variable diameter producing a beaded appearance, and as cystic when the dilated bronchi had the appearance of rings or clusters of cysts.
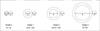
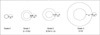
The CT scoring system, a modification of that described by Bhalla et al. (11), was used to quantify the severity and the extent of bronchiectasis. CT scoring was performed by consensus between two chest radiologists, consisted of bronchial dilatation, peribronchial wall thickening, the number of bronchiectatic segments, the number of bulla, and the number of emphysema segments. Each of above five parameters was scored ordinally from 0 in the absence of a lesion through to 3 according to severity. In cases where the severity of the bronchiectasis was not uniform on any one axial scan or throughout the lung zones in both lungs, scoring was based on the most frequently identified severity. The average severity of bronchial dilatation was quantified as a ratio of internal diameter of bronchus to diameter of the adjacent pulmonary arteries as follows: grade 0=no brochiectasis; grade 1=100-200% arterial diameter; grade 2=200-300% arterial diameter; grade 3=>300% arterial diameter (14, 15) (Fig. 1). Bronchial wall thickening was quantified relative to the adjacent pulmonary arteries as follows: grade 0=none; grade 1=<50% arterial diameter; grade 2=50-100% arterial diameter; grade 3=>100% arterial diameter (14, 15) (Fig. 2). The number of bronchiectatic segments was scored as follows: grade 0=none; grade 1=1-5 segments; grade 2=6-9 segments; 3=>9 segments. Each lung was considered as having 10 segments. The number of bulla was scored as 1 in cases of unilateral involvement and not exceeding four lesions, 2 in cases with bilateral involvement but not exceeding four lesions, and 3 in cases with more than four bullas. Bullae can range up to 20 cm in diameter, but are usually between 2 and 8 cm in diameter (16). Therefore when the largest diameter of a bulla exceeded 10 cm, it was counted as two in this study. Bulla has been defined as a sharply demarcated area of emphysema measuring 1 cm or more in diameter, and possessing a wall less than 1 mm in thickness (16). It can be easily distinguished from thin-walled cystic bronchiectasis, which generally has an accompanying vessel and the continuity of the dilated bronchus on adjacent scans (16). The number of emphysema segments was scored as 1 if 1 to 5 segments were involved, 2 for 6 to 9 involved segments, and 3 for cases exceeding 9 segments. Emphysema was defined as an area of low attenuation in comparison with contiguous normal lung parenchyma, with vascular disruption lacking a well-defined wall or an area of low attenuation possessing a wall less than 1 mm thick (16). The CT score was the sum of scores of above parameters, with a highest possible score of 15.
Presences of air-fluid levels and of alveolar consolidation were also evaluated.
Lung Function Tests
Spirometry was performed using the standard protocol recommended by the American Thoracic Society (17). Lung function was measured by using the 6200 Autobox DL Pulmonary Function Laboratory from SensorMedics Co. (U.S.A.). A maximum of three measurements, taken with good patient cooperation was selected. Predicted values were calculated using the formula suggested by the European Respiratory Society (18). The degree of ventilatory impairment was based on Morris's classification (19). Obstructive ventilatory impairment is characterized by a low forced expiratory volume in 1 sec (FEV1) with relatively normal forced vital capacity (FVC). Reduction of FEV1, FVC and FEV1/FVC% indicates mixed obstructive-restrictive ventilatory impairment. The severity of ventilatory impairment was classified according to a percentage of predicted normal value as follows: normal=>80%; mild=65-80%; moderate=50-64%; severe=<50% (19).
Isolation of Sputum Bacteria
Samples of spontaneous sputum were taken from all patients. Early morning samples were preferred. Before collection, patients received careful instruction to collect the specimen after washing and drying their hands and rinsing their mouth well with water. After a deep cough, the sputum was placed into the provided sterile container. Until it was taken to the laboratory it was kept refrigerated, and it was taken to the laboratory as soon as possible. Only sputum samples of Murray-Washington classification degree IV or V were processed (degree IV=10-25 epithelial cells and >25 leukocytes; degree V=<10 epithelial cells and >25 leukocytes per field using a low magnification lens (×100). To isolate bacteria, blood agar, MacConkey agar, chocolate agar, and mannitol salt agar were used. Cultures were evaluated for growth after 48 hr.
Statistical Analysis
All data are expressed as means and standard deviations or as frequencies. Statistical analysis was performed using the SPSS package (SPSS Inc, Chicago, U.S.A.). The Mann-Whitney test was applied for nonparametric comparisons between two groups, and the Kruskal-Wallis test was applied for nonparametric comparisons among three groups. The χ2 test was used to analyze categorical variables. The relationships between CT scores and pulmonary function parameters were examined using Pearson's correlation and when appropriate, multivariate linear regression. To determine predictors of bacterial colonization, logistic regression analysis was used. A p value of less than 0.05 was considered statistically significant.
RESULTS
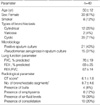
The mean age of the 49 patients was 50 yr and 19 patients were male. There was no current smoker, and 6 were ex-smokers. Bronchiectasis was cylindrical in 12 patients, varicose in 2 and cystic in 35. Bacterial cultures of sputum were positive in 21 of 49 patients, and the most common pathogen was Pseudomonas aeruginosa. Mean FVC was 76% of the predicted value, FEV1 69%, and FEV1/FVC ratio 67%. The mean CT score was 6.1 (Table 1).
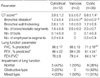
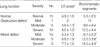
Table 2 shows the different CT scores and lung functions in cylindrical, varicose and cystic bronchiectasis. CT score (p<0.01), dilatation of luminal diameter (p<0.01), FVC (p<0.05), FEV1 (p<0.05), and FEV1/FVC (p<0.01) were significantly different in these 3 types. Moreover, patients with cystic bronchiectasis presented significantly higher CT score (p<0.01) and luminal dilatation score (p<0.01) and lower FVC (p<0.05), FEV1 (p<0.01) and FEV1/FVC (p<0.01) than patients with cylindrical bronchiectasis. However, no statistical difference was found in terms of the type of pulmonary functional impairment among these 3 types.
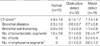
Thirty-four patients showed abnormal lung function: obstructive type in 16 cases and mixed obstructive-restrictive type in 18 cases. On comparing the CT score and its individual parameters for patients with normal lung function and obstructive and mixed ventilatory impairment, CT score (p<0.01), the number of bronchiectatic segments (p<0.01) and the number of emphysema segments (p<0.05) were significantly different. In particular, the number of bronchiectatic segments in patients with mixed-type ventilatory impairment was significantly higher than in patients with obstructive impairment (p<0.05) (Table 3).
Radiologic scores according to physiologic outcomes are shown in Table 4. A reduction in the lung function of patients with obstructive ventilatory impairment was accompanied with a significant increase in the CT score (p<0.05), whereas a decrease in the lung function of patients with mixed type ventilatory impairment was accompanied with a significant increase in the number of bronchiectatic segments (p<0.05).
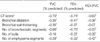
Table 5 shows correlations between CT scores and lung function parameters. FVC was found to be negatively correlated with the CT score (p<0.01), bronchial dilatation (p<0.05), bronchial wall thickening (p<0.05), the number of bronchiectatic segments (p<0.01), and the number of emphysema segments (p<0.05). FEV1 was negatively correlated with the CT score (p<0.01), bronchial dilatation (p<0.01), the number of bronchiectatic segments (p<0.01), and the number of emphysema segments (p<0.05). And, FEV1/FVC was negatively correlated with the CT score (p<0.01), bronchial dilatation (p<0.05), the number of bronchiectatic segments (p<0.01), the number of bulla (p<0.05), and the number of emphysema segments (p<0.05).
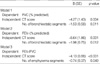
The factors affecting pulmonary function were further investigated using multivariate linear regression with respect to CT score, and with the five CT score parameters. Parameters showing no correlation with FVC, FEV1 and FEV1/FVC in Table 5 were excluded from models 1, 2 and 3, respectively. CT score and the number of bronchiectatic segments were found to be significant independent predictors of FVC and FEV1, whereas CT score and the number of emphysema segments were significant independent predictors of FEV1/FVC (Table 6).
Patients with a positive bacterial culture had significantly decreased FVC (68±20% vs. 81±15%, p<0.05) and FEV1 (61±27% vs. 74±23%, p<0.05) compared to patients with a negative culture. Patients with a positive culture showed higher CT score (6.7±2.0 vs. 5.6±1.6, p<0.05) and bronchial wall thickening score (1.4±0.9 vs. 0.9±0.8, p<0.05), and higher number of bronchiectatic segments (10.1±4.8 vs. 7.6±4.2, p<0.05) than patients with a negative culture. More frequent air-fluid levels were found in patients with a positive culture than in patients with a negative culture (62% vs. 21%, p<0.05). Logistic regression analysis for FVC, FEV1, CT score, bronchial wall thickening, number of bronchiectatic segments, and the presence of air-fluid levels showed that the presence of air-fluid levels (p=0.42, odds ratio=5.22, 95% confidence interval 1.1 to 25.6) was the only significant independent predictor of a positive bacterial culture.
DISCUSSION
Bronchiectasis is defined pathologically as an irreversible dilatation of bronchi usually related to airway infection (20). It presents as a chronic productive cough, recurrent episodes of infection, and hemoptysis (7). A classic sequence following airway infection is the structural destruction of lung tissues followed by functional deterioration (21). Radiological assessment of the degree of anatomical change may reflect pulmonary functional limitation (10). Since the criteria used for the diagnosis of bronchiectasis on CT scanning were first established by Naidich et al. (2) in 1982, and it became possible to identify segmental bronchi and blood vessels using CT scans (22), a novel scoring system for bronchiectasis was developed by Bhalla et al. using thin section CT in 1991 (11). However, their study was limited by the use of different scales in one scoring system. In the present study, the relationship between the morphologic changes and the pulmonary function were assessed using the same scale, and the influence of bacterial colonization in clinically stable bronchiectasis was analyzed.
Pulmonary function parameters may be normal in minimal degree of bronchiectasis (23). The severity of morphologic changes observed on HRCT influences these pulmonary functional parameters, and bronchiectasis of increased severity causes a gradual functional derangement. Previous studies emphasized obstructive pulmonary insufficiency in bronchiectasis, related to morphologic changes (24) and bronchial responsiveness (25). Focal stenosis and the eventual obliteration of peripheral bronchial contours, together with secretions and exudate, and associated emphysematous changes all contribute to pulmonary functional deterioration associated with obstructive changes (8, 16, 26). However, irreversible structural destruction contributes to a reduction in lung volume and obstructive changes, which present more commonly as the mixed type (27, 28). Moreover, the extent and severity of the morphologic abnormalities determine the degree of volume impairment.
In this study, in contrast with Lynch's study (29), no significant correlations were found between cylindrical bronchiectasis and obstructive disease or between cystic bronchiectasis and mixed disease. This may have been due to the small number of cases. However, still consistent with the findings of previous studies (29, 30), patients with cystic bronchiectasis showed a reduction in the individual parameters of lung function compared to patients with cylindrical bronchiectasis. Cystic bronchiectasis may reflect relatively late inflammatory changes, presuming its diagnosis is based on several morphological evidences such as more dilated bronchial lumen and higher CT score.
Patients with bronchiectasis and ventilatory impairment had significantly higher CT score and number of bronchiectatic segments than patients with bronchiectasis and a normal lung function. In particular, in patients with mixed ventilatory impairment, not only were more bronchiectatic segments seen than in patients with obstructive type, but the number of bronchiectatic segments in these patients also correlated with the severity of mixed disease. These findings suggest that obstructive impairment might result from relatively early bronchiectasis pathology, while progressive bronchiectatic changes contribute to further restrictive impairment resulting in the mixed ventilatory impairment.
In this study, FVC, FEV1 and FEV1/FVC were significantly associated with the CT score. Our CT score includes elements of severity, extent, and associated findings in bronchiectasis and reflects functional changes very well because no single parameter is specific for the functional consequences of bronchiectasis. FVC and FEV1 were also associated with the number of bronchiectatic segments, whereas FEV1/FVC was associated with the number of emphysema segments, suggesting that FEV1/FVC reflects an obstructive pathology, like emphysema, after adjusting for volume impairment more so than FEV1. Both FVC and FEV1 seem to be sensitive to the extent of bronchiectasis relevant to disease severity. Although Loubeyre et al. (24) previously showed negative correlation between emphysema in HRCT and FVC, FEV1, and FEV1/FVC in bronchiectasis, no relation of the other radiologic parameters with lung function or the significance of radiologic parameters as predictors of functional derangement was evaluated. The impact of smoking was reported to be associated with a 15% reduction in pulmonary function in the study of Ellis et al. (21). However, the incidence of smoking in our study was too low to affect lung function.
Our bacterial colonization results in stable bronchiectasis differed from those of other studies. Several reports mainly in white patients found Hemophilus influenzae to be the predominant bacteria, and a recent trend toward more P. aeruginosa and less H. influenzae has been reported (31, 32). In the present study, P. aeruginosa was the outstanding microorganism, occupying 71% of culture-positive cases. Overuse or inappropriate prescription of oral antibiotics without anti-pseudomonal activity could explain the predominance of P. aeruginosa.
Patients with colonization showed significantly lower FVC and FEV1 values than non-colonized patients. Angrill et al. (30) found that reduced FEV1 was a risk factor of bronchial colonization. It is unclear which is initiator for pulmonary functional deterioration among bronchiectasis itself and colonizing bacteria. However, data showing decreased lung function and/or extensive bronchiectasis in HRCT associated with the colonization of P. aeruginosa or other potentially pathogenic microorganisms are accumulating (15, 31-34). In a recent study, non-colonized patients with bronchiectasis showed a more intense bronchial inflammatory reaction than healthy controls, and patients colonized by potentially pathogenic microorganisms also exhibited an exaggerated inflammatory reaction which was found to correlate with bronchial bacterial load (31). Isolates of P. aeruginosa may indicate the presence of underlying bronchiectasis (35), because once P. aeruginosa infection is established in bronchiectasis by adhering to respiratory epithelial cells and following colonization, it is rarely eliminated (36, 37). Therefore, the phenomenon of chronic colonization, secondary inflammatory reaction, and progressive lung injury represents a 'vicious cycle' in bronchiectasis, and is the reason why the appropriate evaluation of distal airway colonization is necessary. Logistic regression analysis revealed that the presence of air-fluid levels was the only significant independent predictor of bacterial colonization. Neither decreased lung function nor the other findings of HRCT were significant. Thus, the air-fluid levels can be used as a marker of active infection and as a guideline when prescribing antibiotics.
In our patients with stable bronchiectasis, radiologic findings such as cystic type, high CT score, and a large number of bronchiectatic segments were highly relevant to functional impairment. In particular, the CT score was found to be the most important predictor of FVC, FEV1, and FEV1/FVC. P. aeruginosa was identified as the predominant colonizing bacteria, and the presence of air-fluid levels as a predictor of bacterial colonization. Further studies are required to verify these clinical, functional, and radiologic relationships.
 XML Download