

 PDF
PDF ePub
ePub Citation
 Print
Print


INTRODUCTION
Estrogen affects the growth and differentiation of the reproductive tissues as well as other metabolic processes by binding to the estrogen receptor (ER), that regulates the specific gene expression in the target tissues. ER is a member of the transcriptional activator family and requires a high mobility group-1 (HMGB-1) for its full transcriptional activity (1).
HMGB-1 is the most abundant and the most prominent member of the HMGB family. It is a ubiquitous and highly conserved nonhistone chromosomal protein that is implicated in transcription, replication and recombination as well as in chromatin organization (2). In general, the HMGB-1 gene appears to be tightly regulated and is expressed at the basal level in most cells and tissues (3). The HMGB-1 expression level is increased approximately 2-fold in proliferating tissues as well as in actively dividing cells (4-6). A similar increase has also been observed when estrogen responsive breast cancer cells are treated with estrogen (7), and when synchronized CHO cells progress from the G1 to S phase (8). Furthermore, in the rat uterus, it was reported that HMGB-1 synthesis is stimulated by an estrogen treatment (9). This suggests that the intracellular levels of HMGB-1 may be an important regulatory factor for the action of ER and might have a regulatory role on estrogen-mediated cell proliferation in the reproductive tract.
Accordingly, this study examined the effects of HMGB-1 overexpression on the estrogen-induced cell cycle progression in MCF-7 cells.
MATERIALS AND METHODS
Expression plasmid constructs
The entire HMGB-1 (nucleotide positions +51-+744) gene was amplified by PCR using the primers HMGB-1T (for 5'-tcgckgaggaaaawyaact-3'; rev 5'-aaaactgcgctagaaccaacttat-3'). PfuTurbo DNA polymerase (Stratagene, La Jolla, CA, U.S.A.) was used for the PCR (conditions: 95℃, 1 min; 58℃, 45 sec; 72℃, 2 min for 30 cycles followed by 72℃, 10 min). The PCR products were cloned into the pGEM-T easy vector (Promega, Madison, WI, U.S.A.) and sequenced to confirm their identity. The HMGB-1 insert was also recloned into the pBluescript KS(+) gene (Stratagene). After restriction enzyme digestion with Nhe I-Acc I, the DNA fragment was cloned into the Xba I-Acc I digested pCIneo (Promega), which yielded the plasmid HMGB-1-pCIneo. This plasmid enabled the expression of the HMGB-1 gene under the control of the phage T7 promoter.
Cell maintenance and Transfection
The MCF-7 cells were propagated in RPMI 1640 medium (Gibco BRL, Paisley, U.K.) containing 100 µg/mL gentamicin, 25 mM HEPES/NaOH, pH 7.3, and 10% heat-inactivated fetal bovine serum (FCS, Gibco BRL) in a humidified atmosphere of 5% CO2 at 37℃. Unless otherwise indicated, all the experiments were performed using synchronized MCF-7 cells. In order to synchronize the cultures, the MCF-7 cells were harvested from the stock dishes and cultured in RPMI supplemented with 10% FCS until they reached -50% confluence. The cells were then washed with phosphate-buffered saline (PBS) and cultured for 3 days in a RPMI 1640 phenol red-free medium and 0.5% charcoal/dextran-treated FCS (sFCS, HyClone, Logan, UT, U.S.A.). Under these conditions, 80 to 85% of the cells were arrested at the G0/G1 phase.
In order to compare the cell cycle progression of the normal MCF-7 cells and the HMGB-1 overexpressed MCF-7 cells, the cells that were synchronized at the G0/G1 phase in the 60 mm dishes were transfected with HMGB-1-pCIneo and pCIneo using the Lipofectamine Plus reagent (Gibco BRL) according to the manufacturer's instructions. After transfection, the cells were harvested for propidium iodide (PI, Sigma Chemicals, St. Louis, MO, U.S.A.) staining.
The cells were then stimulated with 10 nM estrogen for 30 hr. The cells also harvested for PI staining at the completion of the experiments.
Analysis of cell cycle kinetics
In order to analyze the cell cycle phase distribution, approximately 1×10⁶ cells were detached from the culture dishes using trypsinization, diluted 1:1 in a complete medium, and collected by low speed centrifugation at room temperature. The cell pellet was resuspended in the 1 mL phosphate buffered saline (PBS) containing 50 µg PI (Sigma Chemicals), and treated with 1 µg of the RNases (Sigma Chemicals) for 30 min at 37℃. The samples were filtered through a 25-gauge syringe needle immediately before undergoing flow cytometry analysis.
Western Blot Analysis
The MCF-7 cells were homogenized and lysed in 0.5 mL of the RIPA buffer (150 mM NaCl, 1% NP40, 0.5% sodium deoxycholate, 0.1% SDS, 50 mM Tris pH 8.0) with freshly added 1 mM phenylmethylsulphonylfluoride (PMSF, Sigma) for 30 min on ice. The lysates were centrifuged at 13,000 g for 15 min at 4℃, and the supernatants were stored at -70℃ until needed. Equal amounts of the total protein (30 µg) were separated by SDS-PAGE, which were then transferred to a supported westran PVDF (Schleicher & Schuell, New Hampshire, U.S.A.) using 100 V-2 hr with a plate electrode apparatus (Mini Trans-Blot Cell; Bio-Rad, CA, U.S.A.). The blots were blocked for 2 hr in Tris-buffered saline (TBST, 0.2 M NaCl, 0.1% Tween-20, 10 mM Tris pH 7.4) containing 5% non-fat dry milk. Subsequently, the blots were incubated with the antibodies against HMGB-1 (1:1,000; BD Pharmingen 66741N) in TBST, and then in anti-rabbit IgG (1:2,000; Amersham Pharmacia Biotech, Freiburg, Germany) in TBST. After each step, the blots were washed with TBST several times. The bound antibodies were detected using an enhanced chemiluminescence (ECL) system (Amersham Pharmacia Biotech). The blots were stripped with a stripping buffer (100 mM β-mercaptoethanol, 2% (w/v) sodium dodecyl sulphate, 62.5 mM Tris-HCl pH 6.7) before applying the β-actin antibody. The stripped blots were incubated with the β-actin antibodies (1:2,000; for the internal standard, Sigma AC-15) in TBST followed by anti-mouse IgG (1:2,000; Amersham Pharmacia Biotech) in TBST.
RT-PCR
The total RNA was extracted from the MCF-7 cells using a TRIzol reagent (Gibco-BRL) according to the manufacturer's instructions. The total RNA (2 µg) was reverse transcribed in a final 25 µL Tris buffer (50 mM; pH 8.3) supplemented with KCl (75 mM), MgCl2 (3 mM), DTT (5 mM), deoxynucleotide triphosphate (0.5 mM, each, Gibco-BRL), oligo dT (1.5 µM), and Moloney murine leukemia virus (M-MLV) reverse transcriptase (200 U, Promega) at 42℃ for 60 min. PCR amplification was performed in a final 50 µL reaction volume containing 2 µL of the reverse transcribed cDNA, 0.4 µM of each primer, 1U of Taq DNA polymerase (Promega), 1× Taq DNA polymerase buffer, MgCl2 (2.5 mM), and deoxynucleotide triphosphate (0.2 mM each). The PCR reaction was carried out using a Perkin Elmer DNA Thermal Cycler (version 2.3) according to the following program; denaturing for 1 min at 95℃, annealing for 45 sec at 55℃ (for Cyclin D1), 61℃ (for Cyclin A), 66℃ (Cyclin B), 53℃ (for Cdk4) and at 60℃ (for GAPDH), and elongation for 2 min at 74℃ for a total of 30 cycles (for Cyclin D1 and Cyclin B), 35 cycles (for Cycln A and Cdk4), and 28 cycles (for GAPDH), except for the final cycle, where the elongation step was extended to 10 min at 74℃. The amount of template cDNA used in each reaction was normalized to the amount of GAPDH mRNA. Amplification of the template cDNA was in the linear range for the number of PCR cycles and RT-PCR of the GAPDH transcript was performed using the same amount of cDNA from each sample as a template. The PCR products were visualized by electrophoresis on 1.5% (w/v) agarose gels.
Oligonucleotide primers
The Oligonucleotide PCR primers were selected with the aid of a computer program (DNA STAR) designed to optimize the GC content and melting temperature, and to minimize the level of hairpin and dimer formation. The PCR primers were: Cyclin D1 forward 5'-CCTACTCAAATGTGTGCAGAAG-3'; CyclinD1reverse5'-CAAGGAGAATGAAGCTTTCCCTT-3'; Cyclin A forward 5'-GCACCCCTTAAGGATCTTCC-3'; Cyclin A reverse 5'-CCTCTCAGCACTGACATGGA-3'; Cycln B forword 5'-CGGGAAGTCACTGGAAACAT-3'; Cyclin B reverse 5'-CAGGTGCTGCATAACTGGAA-3'; Cdk4 forword 5'-CTTGC CAG CCGAAACGAT-3'; Cdk4 reverse 5'-CCACGGGGCAGGGATAC-3'; GAPDH forward 5'-ACCACAGTCCATGCCATCAC-3'; GAPDH reverse 5'-TCCACCACCC TGTTGC TGTA-3', which resulted in 887, 536, 567, 408 and 452 bp products, respectively.
Densitometry
The gel image was scanned using a Gel Documentation System (Gel Doc 1000, Bio-Rad, Hercules, CA, U.S.A.) and the relative densities were analyzed using a Multi-analyst fingerprinting program (version 1.1). The relative densities of the bands are expressed in arbitrary absorbance units per unit area.
RESULTS
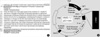
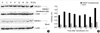
The primers were designed based on GenBank database in order to include the entire HMGB-1 sequence. Six hundred and ninety one-bp PCR products were cloned into the pGEM-T easy vector and sequenced to confirm their identity (Fig. 1A). The HMGB-1 insert was then recloned into the pBluscript KS(+). After digestion with the restriction enzyme, Nhe I-Acc I, the DNA fragment was cloned into pClneo/Xba I/Acc I, in which the expression level of both the HMGB-1 and neomycin resistant gene were controlled by a CMV promoter (Fig. 1B). Finally, the plasmid containing the HMGB-1 was transfected into the MCF-7 cells using the Lipofectamin Plus reagent. Standard lines of MCF-7 human breast cancer cells were used as the control in order to examine the transfection efficiency. Western blot analysis was performed to analyze the HMGB-1 expression level. The HMGB-1 level in the transfected MCF-7 cells increased 4.87-fold compared to that in the non-transfected cells (Fig. 2)
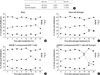
In order to establish a specific experimental system for examining the estrogen-regulated events regarding cell cycle progression, the MCF-7 cells were synchronized at the G0/G1 phase by serum and estrogen deprivation, as described in Materials and Methods. In the exponentially growing cells, the proportion of cells in the G1, S, and G2+M phases were 66.74, 1.26 and 31.99%, respectively. After serum and estrogen deprivation for 3 days, the proportion of cells changed to 80.88, 7.25 and 11.87%, respectively (Fig. 3A). In addition, this study examined whether or not the estrogen treatment in the synchronized MCF-7 cells changed the HMGB-1 mRNA level using RT-PCR. The HMGB-1 mRNA level increased 1.6-fold 30 min after the estrogen treatment compared to that of the basal level. The HMGB-1 mRNA level then slightly decreased to 1.3-fold of the basal level after 45 min. This increased mRNA level was maintained throughout the course of the estrogen treatment (data not shown).
The cell cycle phase distribution was evaluated in the MCF-7 cells using analytical DNA flow cytometry in order to determine if HMGB-1 affects the cell cycle progression. The MCF-7 cells were transfected with HMGB-1 after synchronization by serum and estrogen deprivation. HMGB-1 overexpression did not alter the cell cycle progression compared to the mocktreated cells (Fig. 3B, D). Estrogen was added to the synchronized MCF-7 cells in order to analyze the effect of estrogen on the cell cycle progression in the HMGB-1 overexpressed MCF-7 cells and mock-treated cells. After the estrogen treatment, there was few changes in the cell cycle phase distribution over the first 12 hr, but afterwards, the proportion of cells in the G1 phase decreased from 62% to 52% after 16 hr in the mock-treated cells, and from 62% to 49% after 16 hr in the HMGB-1 overexpressed MCF-7 cells (Fig. 3C, E). This decrease was accompanied by an increase in proportion of S phase cells from 27% to 43% in the mock and from 27% to 47% in the HMGB-1 overexpressing MCF-7 cells, which is a synchronized population of cells indicating the progression from the G1 to S phase. The subsequent decline in the proportion of S phase cells after 22 hr was accompanied by an increase in the proportion of G2 phase cells from 6% to 18% at 30 hr in the mock-treated cells and from 4% to 25% at 30 hr in the HMGB-1 overexpressing MCF-7 cells.
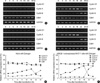
In order to confirm the molecular basis of this cell cycle progression, an analysis of the gene expression level of the cell cycle specific regulators was performed. For this, the total RNA from the mock and HMGB-1 overexpressing MCF-7 cells were prepared at each time point and analyzed by RT-PCR (Fig. 4). As expected, the mRNA levels of the S phase progression marker (Cyclin A) as well as that of the G2/M phase marker (Cyclin B) were not increased in the mock and HMGB-1 overexpressing MCF-7 cells without estrogen (Fig. 4A, C). In contrast, the expression level of these mRNAs changed after the estrogen treatment (Fig. 4B, D). After the estrogen treatment, the Cyclin A mRNA levels increased slowly over the first 16 hr and decreased dramatically after 22 hr in the HMGB-1 overexpressed MCF-7 cells. At that time point, the Cyclin B mRNA levels also increased dramatically (Fig. 4D). Similar patterns were observed in the mock-treated cells with estrogen. However, the changes in the mRNA levels were more prominent in the HMGB-1 overexpressing MCF-7 cells than in the mock-treated cells (Fig. 4B). The mRNA levels of the G1 phase marker (Cdk4 and Cyclin D1) did not change remarkably.
DISCUSSION
HMGB-1 enhances the DNA interactions and has the potential to activate the transcription of several different families of sequence-specific transcriptional activators (10). Because HMGB-1 is a conserved, ubiquitous protein, it might function as a general cofactor for a wide range of transcriptional activators. In particular, HMGB-1 is believed to influence the steroid hormone class of the nuclear receptors, and has no effect on the DNA binding of the transactivation function of the class II nuclear receptors (1). It was reported that the HMGB-1 expression level increased in the estrogen responsive breast cancer cells treated with estrogen (7). In this study the MCF-7 cells that expressed ER responded to an estrogen treatment with a rapid increase in the HMGB-1 mRNA level, which is in accordance with the results reported by Chau et al. (7). Therefore, the transcription activation of the estrogen responsive genes by estrogen may require HMGB-1 production. A study on the regulation of HMGB-1 suggested that two potential estrogen responsive elements (ERE) in intron 1 of the HMGB-1 gene might be involved in the estrogen-dependent transcription (11).
HMGB-1 was transfected into the synchronized MCF-7 cells in order to examine the effect of HMGB-1 on cell cycle progression. Prior to transfection, 80.88% of the MCF-7 cells were synchronized at the G0/G1 phase. However, after transfection, only 60% of the cells were in the G0/G1 phase. It is possible that the Lipofectamin Plus reagent caused this discrepancy. When compared to the mock-treated cells, HMGB-1 overexpression did not alter the cell cycle progression. Following the estrogen treatment, the cell cycle progressed in both the HMGB-1 overexpressed MCF-7 and mock-treated cells. In contrast to Prall et al. (12) the cell cycle phase distribution did not change dramatically after the estrogen treatment in the mock-treated cells. Nevertheless, the progression from the G1 to S phase and then to the G2 phase was more prominent in the HMGB-1 overexpressing MCF-7 cells than the mock-treated cells. This suggests that HMGB-1 play a role in the estrogen dependent cell cycle progression. The cell cycle regulator genes were also altered after the estrogen treatment in both the HMGB-1 overexpressing MCF-7 cells and the mock-treated cells. However, the mRNA levels of cell cycle regulators changed more dramatically in the HMGB-1 overexpressing MCF-7 cells than the mock-treated cells.
In conclusion, HMGB-1 overexpression itself does not alter the MCF-7 cell cycle progression, but the cell cycle progression appears to be accelerated by addition of estrogen to the HMGB-1 overexpressing MCF-7 cell.
 XML Download