

 PDF
PDF ePub
ePub Citation
 Print
Print


INTRODUCTION
The Third Report of the National Cholesterol Education Program Adult Treatment Panel III (NCEP ATP III) proposed the importance of the metabolic syndrome in assessing and managing cardiovascular diseases (1). People with the metabolic syndrome are at an increased risk for morbidity as well as mortality from cardiovascular disease (2, 3). Abdominal obesity, particularly visceral obesity promotes the insulin resistance (4-6), and also causes the clustering of cardiovascular risk factors at a given level of body mass index (BMI) (7, 8). A high waist circumference, a good predictor of cardiovascular disease (9), is one of important diagnostic standpoints of the metabolic syndrome. A recent prospective study has shown that obesity appears to be the central component of the metabolic syndrome (10), and thus, identification of these high-risk individuals would be crucial in order to provide appropriate therapy with the currently available disease-modifying treatments along with the recommendation of weight reduction as first-line treatment (1).
Korea, like other Asian countries, has experienced rapid socioeconomic growth with prominent lifestyle transformation over the past several decades. The cardiovascular diseases is being witnessed as one of the most common causes of death in Korea (11). Asians tend to show a high prevalence of cardiovascular risk factors at even lower BMI compared to Caucasians, presumably due to a greater central obesity (8). The prevalence of metabolic syndrome has been reported to be more than 20% among Koreans despite a lower prevalence of obesity (12). However, the BMI increment was identified as one of independent modifiable risk factors of the metabolic syndrome among Koreans (12).
The modification of associated factors is known to be essential to prevent and to manage the metabolic syndrome. However, little information is available regarding the effect of weight reduction or change of fat distribution on the metabolic components in obese patients among Koreans. The aims of this study were to examine the change of anthropometric indices, fat distribution, and metabolic components with modest weight reduction (5-10%), to compare the efficacy of weight reduction in patients with or without the metabolic syndrome, and to investigate the predictable variables for improvement of the metabolic components and insulin resistance during weight reduction in Korean obese patients.
MATERIALS AND METHODS
Recruitment of subjects
Our study included 78 obese patients (BMI ≥25 kg/m2) aged 15-60 yr (19 males and 59 females) who visited the Obesity Clinic in Asan Medical Center. This study was approved by the Institutional Review of Board of Asan Medical Center. The subjects excluded from this study were pregnant or lactating women, and those with secondary causes of obesity and evidence of severe hepatic or renal diseases. Also, the subjects who were taking medications that might have had affect on the metabolic components of metabolic syndrome (e.g., antihypertensive drug, oral hypoglycemic agents, insulin, hypolipidemic agents, and lipase inhibitors) were excluded. All individuals were subjected to a medical evaluation by physicians who were responsible for taking full medical history and physical examination.
Anthropometric measurements
Anthropometric measurements were taken with the subjects in light clothing and without shoes. Height and weight were measured by an automatic height-weight scale, to the nearest 0.1 cm and 0.1 kg. Body mass index (BMI) was calculated by dividing weight (kg) by square of height (m2). Percent body fat and total body fat were then measured by bioimpedance analysis (Inbody 3.0, Biospace, Seoul, Korea) (13). The waist circumference was measured at the midpoint between the lower border of the rib cage and the iliac crest, and the hip circumference at the widest part of the hip region. Only one well trained technician checked the anthropometric measurements throughout the whole process of this study to reduce the interpersonal variations. The waist-to-hip ratio (WHR) was calculated by dividing the waist circumference by the hip circumference.
Computed tomography
Cross-sectional abdominal visceral and subcutaneous adipose tissue areas were measured by computed tomography (CT) on a Siemens Somaton Scanner (Erlangen, Germany) using an established protocol (14, 15). A cross-sectional scan at 10mm thickness centered at the L4-L5 vertebral disc space with the subject in the supine position was obtained using a radiograph of the skeleton as a reference to establish the position of the scans to the nearest millimeter. Subcutaneous and visceral adipose tissue (SAT and VAT) boundaries were defined using a manual cursor by delineating these areas with a graph pen, and the adipose tissue areas were calculated by computing the adipose tissue surfaces with an attenuation range of -190 to -30 Hounsfield units. The abdominal VAT area was measured by drawing a line within the muscle wall surrounding the abdominal cavity. The SAT area was calculated by subtracting the VAT area from the total adipose tissue (TAT) area and the VAT to SAT ratio (VSR) was then calculated.
Metabolic variables
The metabolic components of the metabolic syndrome (e.g., blood pressure, fasting blood glucose, triglyceride, and HDL-cholesterol) as well as other metabolic variables (total cholesterol, LDL-cholesterol, uric acid, fasting insulin and HOMA score) were measured in the study subjects before and after weight reduction.
Blood pressure was measured with a mercury sphygmomanometer after 10 min rest in the sitting position. All study subjects were refrained from smoking or ingesting caffeine for 30 min preceding the measurements. Cuff size was selected according to arm circumference of the participants. The first appearance of sound (phase 1 Korotkoff sound) was used to define systolic blood pressure and the disappearance of sound (phase 5 Korotkoff sound) was used to define diastolic blood pressure (16). Two readings for each of systolic and diastolic blood pressure were recorded and the average of each measurement was used. If the first two measurements differed by more than 5 mmHg, additional readings were obtained.
Blood samples were obtained in the morning after a 12 hr overnight fast from an antecubital vein into vacutainer tubes containing EDTA and subsequently analyzed at a central, certified laboratory. Plasma glucose was measured by a glucose oxidase method, and total cholesterol and triglyceride levels by enzymatic procedures using an autoanalyzer (Hitachi-747, Tokyo, Japan). The HDL-cholesterol fraction was measured by enzymatic method after precipitation of apo-B containing lipoproteins with MnCl2. LDL cholesterol was calculated by Friedewald equation if triglyceride was below 400 mg/dL (17). The uric acid concentrations were measured by uricase method using autoanalyzer. Fasting insulin was measured by radioimmunoassay (Dianabott, Tokyo, Japan). The estimate of insulin resistance by HOMA score was calculated with the formula: fasting serum insulin (µU/mL)×fasting plasma glucose (mmol/L)/22.5 (18).
Participants having 3 or more of the following criteria were defined as having the metabolic syndrome; blood pressure: ≥130/≥85 mmHg; fasting glucose: ≥110 mg/dL; hypertriglyceridemia: ≥150 mg/dL; and low HDL-cholesterol: <40 mg/dL in men and <50 mg/dL in women, and abdominal obesity: waist circumference >102 cm in men and >88 cm in women as detailed in the NCEP ATP III report (1).
Weight reduction program
The weight reduction program consisted of life style modification and adjuvant pharmacotherapy using appetite suppressants. Unrestricted routine dietary intake of subjects was assessed by 24-hr dietary recall. For this, experienced, well-trained interviewers instructed respondents to recall and describe all foods and beverages they had consumed over the past 24 hr. Each subject's record was coded and standardized reference tables were used to convert household portions to gram weights. The nutrient analysis of the records was quantified using a computer aided nutritional analysis program (CAN, Korean Nutrition Society, Seoul, Korea) (19). Individual energy deficits were based on the estimated energy requirements calculated from a basal metabolic rate multiplied by a physical activity level (20). The basal metabolic rate was assessed by the Benedict-Harris equation. A well-trained dietitian instructed the daily energy prescriptions for weight reduction.
Diet regimen used in this study was a balanced diet no less than 1,000 kcal/day composed of carbohydrate 60% of total energy intake with the fat level below 30% of calories. Restriction of alcohol consumption either by reducing the frequency or the amount of alcohol beverage was strongly recommended to all subjects. However, the subjects were free to select the type of the foods and beverages, and to keep the food diaries recorded three times per week during the 12-week study period. The dietitians interviewed the subjects at regular basis, once a month, and reevaluated their total intake of energy and nutrients from food diaries. They monitored to ensure each patient to follow diet habit according to recommended proper nutrition for such subject.
The physical activity level of all subjects was assessed using a questionnaires categorized into one of the following groups of physical activity level: inactive, mildly active daily life (no outside exercise), moderately active daily life (formal exercise less than 3 times/week), and severely active daily life (formal exercise more than 3 times/week). Most of the subjects were categorized in inactive or mildly active. Based on initial physical activity level, the subjects were also encouraged to increased levels of daily exercise and to reduce the amount of time spent in a sedentary life style.
The initial duration of exercise was about 30 min, but was progressed to a maximum of 60 min according to individual capabilities. The exercise intensity was increased from 50% to 85% of the maximum heart rate. The mode of exercise was determined by the subjects and varied from walking, cycling, swimming, stationary cycling, or walking on a motorized treadmill under unrestricted living condition. Throughout the study, the interviewer monitored the compliance for exercise using a diary and reevaluated physical activity level.
The subjects were prescribed with adjuvant appetite suppressant for weight reduction, because they usually failed weight control with life style modification alone. Selective serotonin reuptake inhibitor (fluoxetine 40 mg) was prescribed during the 12-week weight reduction program. The subjects finished the 12-week weight reduction program and follow-up reassessment were taken including anthropometric measurements, abdominal fat CT scan, and metabolic variables.
Statistical analyses
The results are presented as mean±SD. The changes of anthropometric measurements, abdominal fat distribution, and metabolic variables before and after the weight reduction program in the subjects were tested by the paired t-test. The changes of all variables between the patients with or without the metabolic syndrome were compared by the Student t-test. The stepwise multiple regression analysis was used to investigate the predictable variables for the improvement of metabolic variables. All analyses were two-tailed and a p-value <0.05 was considered statistically significant. The statistical analyses were performed using SAS 6.12 for Windows (SAS institute Inc. Cary, NC, U.S.A.).
RESULTS
Effect of weight reduction on anthropometric variables and abdominal fat distribution
Table 1 shows the changes and the percent changes of the anthropometric variables and abdominal fat distribution after 12 weeks of weight reduction program in the study subjects. When compared to the basal state, body weight, BMI, body fat, fat mass, and fat free mass were significantly reduced (p<0.05). With regards to abdominal fat distribution, waist circumference, hip circumference, WHR, TAT, SAT, VAT, and VSR were significantly reduced (p<0.05) as well.
Effect of weight reduction on metabolic variables
The absolute mean and percent reductions in the variables of the metabolic syndrome or insulin resistance from baseline to 12 week of weight reduction are summarized in Table 2. Systolic and diastolic blood pressure, triglyceride, total cholesterol, LDL-cholesterol, uric acid, fasting insulin, and HOMA scores were significantly reduced (p<0.05). However, the fasting blood glucose and HDL-cholesterol were not significantly changed after 12 weeks of intervention compared to the baseline measurements of the study subjects.
Comparison the effect of weight reduction on anthropometric variables and fat distribution between the subjects with or without metabolic syndrome
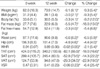
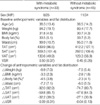
Table 3 shows the baseline and changes of anthropometric variables and abdominal fat distribution after 12 weeks of weight reduction program in the subjects with or without metabolic syndrome. The age, baseline anthropometric variables, and abdominal fat distribution were not significantly different between two groups. Also, the changes of weight, BMI, waist circumference, TAT, SAT, VAT, and VSR were not significantly different between these groups. However, individuals with the metabolic syndrome significantly lost more body fat than those without the metabolic syndrome (p<0.05).
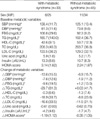
Comparison the effect of weight reduction on metabolic variables between the subjects with or without metabolic syndrome
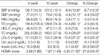
Table 4 shows baseline metabolic variables and changes of metabolic variables after 12 weeks of weight reduction program in the subjects with or without metabolic syndrome. There were significant differences in systolic and diastolic blood pressure, fasting blood glucose, triglyceride, and HDL-cholesterol between individuals with metabolic syndrome and those without the metabolic syndrome (p<0.05). Individuals with the metabolic syndrome showed significantly greater reductions in systolic and diastolic blood pressure, fasting blood glucose, triglyceride, fasting insulin and HOMA score compared to those without the metabolic syndrome (p<0.05).
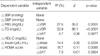
Predictable variables for the change of metabolic components of metabolic syndrome or insulin resistance
Table 5 indicates the results of stepwise multiple regression analysis for the independent relationship between the change of metabolic components of metabolic syndrome or insulin resistance and the change of anthropometric measurements or fat distribution. The change of VSR predicted significantly the change of fasting blood glucose and triglyceride with 27.5% and 33.9% of R2, respectively (p<0.05). The change of fasting insulin and HOMA score were independently related with the change of waist circumference (p<0.05).
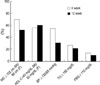
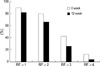
Change of the frequency of each or clustering of metabolic component of metabolic syndrome
In overall, there was a reduction in the number of individuals who met the criteria for the metabolic syndrome after weight reduction compared with baseline. The frequency of each metabolic component of metabolic syndrome from baseline to 12 week of weight reduction were changed as following; abdominal obesity (70.5% to 52.6%), high blood pressure (55.1% to 30.8%), high fasting blood glucose (14.1% to 10.3%), hypertriglyceridemia (26.9% to 21.8%), and low HDL-cholesterol (56.4% to 60.3%). The frequency of clustering of metabolic component of metabolic syndrome from baseline after 12 weeks of weight reduction were changed as following; one or more (89.5% to 82.1%), two or more (79.5% to 65.4%), three or more (42.3% to 25.6%), and four or more (11.5% to 2.6%). The changes of frequency of the metabolic variables were depicted in Fig. 1 and 2.
DISCUSSION
The NCEP ATP III has identified the metabolic syndrome as a secondary target of therapy, beyond lowering cholesterol (1). A recent prospective principal component analysis showed that BMI was the central feature of the metabolic syndrome over time (10). The BMI increment was also identified as an independent modifiable risk factor of the metabolic syndrome in Koreans despite a lower prevalence of obesity (12). Weight reduction may play an essential role in preventing and managing such metabolic syndrome. The recent Finnish Diabetes Prevention Trial (21) and the Diabetes Prevention Program (DPP) (22) have demonstrated the efficacy of even modest weight reduction, produced by modest changes in diet and physical activity, in preventing diabetes in overweight patients with impaired glucose tolerance.
Our study results indicate that average 8.1 kg weight reduction induced 18.0% loss of total body fat mass and 5.4% loss of fat free mass with 6.6 cm reduction in waist circumference accompanied by 22.9% of visceral fat loss and 14.3% of subcutaneous fat loss. These finding are comparable with other reports on weight reduction from different countries (23, 24). Above findings also indicate that visceral fat responds more promptly to weight reduction than subcutaneous fat. That is agreeable with other study results that visceral adipose tissue was more metabolically active and lipolytic than subcutaneous adipose tissue (25). Moreover, this study shows that moderate weight reduction (9.3% of initial body weight) would result in substantial reductions of metabolic risk factors related to the metabolic syndrome or insulin resistance. Among various metabolic variables studied, fasting insulin and HOMA score that serve as surrogate markers of insulin resistance, responded more sensitively to weight reduction than any other metabolic variables.
It is observed in this study that obese patients with metabolic syndrome lose, at similar degrees, total heaviness (weight and BMI), and fat distribution (TAT, SAT, VAT, VSR, and waist circumference) as individuals without metabolic syndrome. Thus, it indicates that the prognosis of obese patients even with metabolic syndrome might not be that poor if these patients try hard to lose weight. If we apply the criteria for abdominal obesity as waist circumference above 90 cm in men and 80 cm in women suggested by Asia-Pacific guidelines (26), same results were obtained.
While the differences of the changes of metabolic variables between the participants with or without metabolic syndrome were compared, the systolic and diastolic blood pressure, fasting glucose, triglyceride, fasting insulin, and HOMA score were significantly reduced more in the individuals with metabolic syndrome compared to those without it. This result indicates that there are greater metabolic benefits among the individuals with metabolic syndrome despite similar degree of weight reduction. This finding is in concordant with previous studies wherein the effectiveness of weight reduction as a therapeutic strategy was particularly useful for individuals with abnormal levels of metabolic risk factors (27, 28). Other studies have also shown that weight reduction improves insulin resistance (29, 30) and individuals with insulin resistance can lose weight as effectively as insulin sensitive individuals (31).
With regards to the predictive variables for the improvement of metabolic components, the reductions of visceral-subcutaneous fat ratio (VSR) was found to be the independent predictable variable for the improvement of fasting blood glucose and triglyceride, and the change of waist circumference was significantly related with the improvement of fasting insulin and HOMA score. This would mean that the reduction of abdominal fat distribution plays an important role in improving metabolic component and insulin resistance independent of the change of weight or BMI.
After weight reduction in obese patients, the frequency of each or clustering of metabolic risk factors was significantly decreased. Compared to start of intervention of this program, the frequency of metabolic syndrome was decreased from 42.3% to 25.6% (40% reduction) after weight reduction. Such findings bring to attention that, despite the persistence of obesity even after weight reduction, even modest weight reduction can result in clinically and statistically significant improvement of metabolic syndrome. If we apply the criteria of metabolic syndrome set by WHO (32), the frequency of metabolic syndrome would be lower than that would have been assessed by NCEP ATP III.
The limitations of this study are not generalizing to the normal weight population and not having been able to observe the effect of weight reduction on metabolic syndrome in participants according to the compliance of weight reduction program.
In conclusion, a moderate weight reduction was associated with substantial reduction in metabolic risk factors of metabolic syndrome or insulin resistance in obese patients that appeared to be partially mediated by the corresponding reductions in abdominal fat distribution. The benefit of weight reduction was found to be greater among individuals with the metabolic syndrome than in those without the metabolic syndrome. Future clinical research studies are needed to develop ideal methods to maintain these benefits of weight reduction in patients with the metabolic syndrome.
 XML Download